Categories:
OB analytics
Description of the OB OB Analytics subsystem that can be managed by OBs.
Introduction
The OB Analytics subsystem is an optional component in the dataflow, which enables the management of clean PPDs (Privacy-Preserving Datasets) by LCDOs for the analysis of Aura behavior.
In order to work with OB Analytics subsystem, the following items must be fulfilled:
-
The legal agreement for log management and creation of PPDs must be signed between the OB and Aura Global Team.
-
The mechanism for PPD creation and transfer must be installed. This requires the deployment of a piece of software (provided by Aura Global Team) inside the OB cloud, with access to the repository (AWS bucket or Azure Blob Storage) holding Aura logs.
-
A virtual machine must be deployed on the OB cloud to hold the OB Dashboard. This virtual server must be provisioned by the OB on the same cloud environment (provider and region, e.g., AWS West Europe) than the Kernel cloud, but separated from it in terms of access rights (placing it in the same cloud enables saving transfer costs from the cloud provider for PPD access).
Architecture and installation
The basic infrastructure of the OB Analytics subsystem consists on a Virtual Machine that is fed with the extracted and cleaned PPDs. This virtual machine is set up with a proposed stack of tools based on the open-source ELK framework (See figure in Architecture document).
-
Elastic Search: indexing database.
-
Logstash: ingester for PPD data, configured to upload the anonymized clean PPD tables into Elastic Search.
-
Kibana: visualization tool offering dashboards and panels created over Elastic Search data.
The OB is required to set up the base VM, for which an Ubuntu 18.04 system is advised.
On top of this base system, Aura Global Team provides an installation kit that includes:
- The pre-processing and ingesting configuration for feeding clean PPD data into logstash.
- The indexing configuration for Elastic Search.
- Certain prototype dashboards and panels for Kibana.
- Basic security provisions (providing web-based secure access to the dashboard).
Once installed, the system automatically ingests any new clean PPD being produced, so that the index and dashboards remain up to date.
In principle, the PPD creation process specifies daily production, since Aura logs are sent to Kernel once a day. This means that information about Aura behavior and user actions on one given day will be available in the dashboards on the following day.
The provided system and installed dashboards are only visualization examples for clean PPDs. The system allows the creation of additional panels that may provide complementary insights on clean PPD elements and OBs are encouraged to explore data as they see fit.
Dashboards can be exported and reimported in a different system, so in addition to the LCDO team adding new analysis features, it is possible to provide later updates to the OB Analytics system. These updates can be provided by the Aura Global Team or shared between OBs.
Outside the dashboard stack, it is also possible to process clean PPD with alternative tools (PPDs are essentially CSV files with a defined structure, so they can be processed with a variety of tools).
Kibana dataflow
The Aura Analytics dashboard follows a standard ELK deployment:
-
An Elastic Search index has been created. It is called
aura-message-COUNTRY, and its index schema contains a cleaned version of theAURA MESSAGEtable (which registers input and output messages). For details on the fields that this index contains, go to the document Data model. -
A Logstash configuration ingests into this index the cleaned sets of datapoints that are produced daily as a result of the transfer and processing of Aura logs. This is usually done in the early morning (which will then upload data for the previous day).
-
A Kibana index pattern has been created, matching the uploaded Elastic Search index. An Elastic Search index is how the data is stored inside the DB; a Kibana index pattern is how it is visualized in the interface. Typically, Kibana index patterns match Elastic Search indices, but it is, for example, possible to create a Kibana index pattern that matches more than one Elastic Search index and hence combines different data sources.
-
A small set of visualizations have been pre-installed in Kibana over that index pattern, as a means to get a default peek on the index data. See the section preinstalled visual elements to check them.
This configuration is deployed on the Kibana default space (the only one available on a freshly created Aura Analytics dashboard). If there is the need to create additional spaces, to better organize visualizations, then the Elastic Search index pattern needs to be installed into those additional spaces.
Preinstalled visual elements
Kibana offers many possibilities to visualize the ingested data and there are many resources and tutorials around explaining its mechanics. We therefore refer to the official Kibana documentation, or tutorials available on the web, for generic information.
In the particular case of the Aura Analytics deployment, there is an Elastic Search index that gets automatically ingested daily. It is called Aura-message-COUNTRY and contains a cleaned version of the AURA MESSAGE table (which registers input and output messages).
Over this index, three types of panels/visualizations have been preinstalled, to provide a starting point:
- Discover panel
- Visualizations
- Dashboards
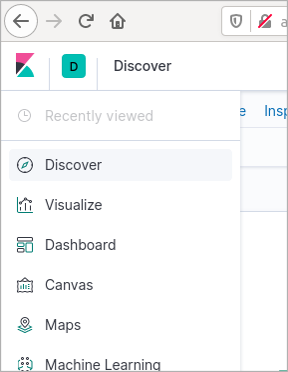
These preinstalled elements are described in the following subsections. To access them, select the appropriate icon in the left navigation panel.
Discover panel
The Discover panel in Kibana is an essential tool where one can perform queries to an Elastic Search index (and save those searches if desired), and explore users’ interactions with Aura in detail log by log, these being filtered by:
- Search terms or conditions
- A time interval
- Additional filters applied to the query results
- A set of index fields to show in the result table
These 4 steps are represented in the following figure:
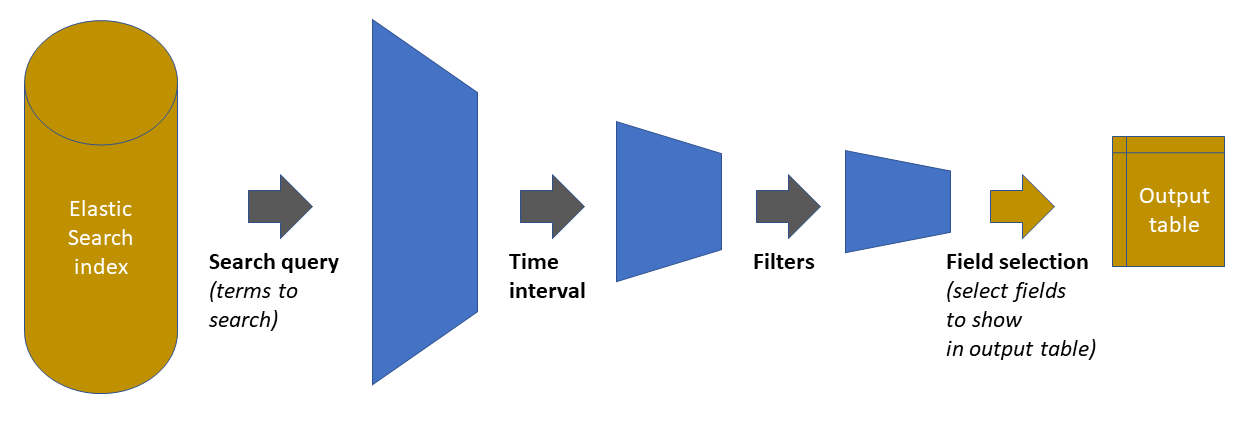
As shown in the previous figure, the starting point is the Elastic Search index holding all the data. The three first steps in the chain reduces the amount of data handled, by pruning out elements that do not satisfy the defined condition. The fourth step is just a display adjustment: on the final dataset, define which of the available fields will be shown on the output table that appears in the panel. However, the retrieved data contains all fields (clicking on any of the rows will show them).
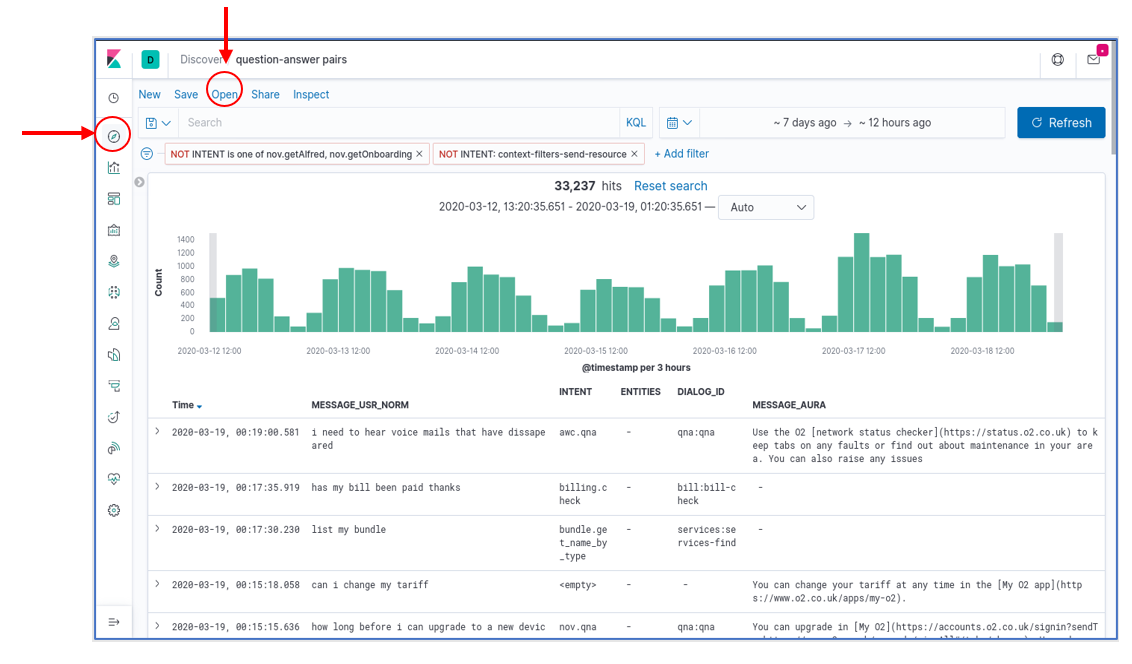
In the Aura Dashboard default set, there is one Discover panel preinstalled. It is called question-answer pairs and has the following characteristics:
- A blank query (i.e., provide all the results)
- A time interval for the last 7 days
- A “only user” filter: it filters out all intents that correspond to non-user queries (suggestions, help commands from the client application, etc.)
- A visualization that includes: the timestamp, the (cleaned) user message, the detected aura intent, associated entities (if applicable), the dialog that was invoked and Aura’s response
This figure shows a snapshot of this panel. To load it, select the Discover tool in the left navigation bar and then click on the “Open” menu option in the top menu bar. A list of saved panels will be shown, together with the already mentioned “question-answer pairs”.
Once the panel is loaded, each one of the aforementioned four elements can be freely modified. For example, the interface allows:
- Adding new filters with the “+Add Filters” button
- Deactivating the current filters by pressing over the predefined filter and clicking over the “Temporarily Disable” option
- Modifying the query interval with the “calendar” button or “Dates Box”
- Adding a specific query on a given index field(s) by using the “Search Box”, instead of the (default) blank query.
Discover panels can be saved as named objects, to be later loaded at will. So, if needed, any panel (a modified panel or a newly created one) can be saved with a new name to have it available for later loading.
Visualizations
A total of 7 visualizations come preinstalled with the base Aura Dashboard. The list can be obtained from the “visualizations” item in the left menu bar, as shown in the figure, and they are:
- Three “Stats” type visualizations, which provide general statistics on platform usage.
- Four “User” type visualizations, which provide insights on user behavior.
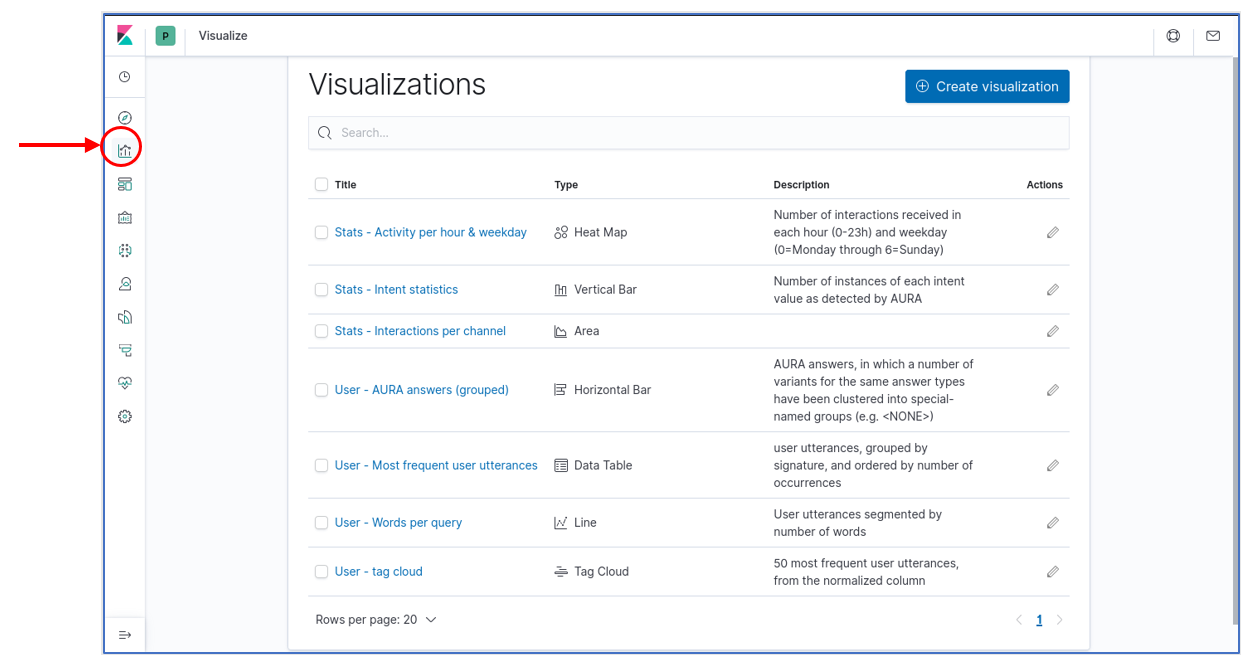
Note that this distinction between “User” and “Stats” is purely conceptual and based on the fields that have been used to generate the visualizations that, from the point of view of Kibana, are all regular visualizations. Those visualizations can be instantly loaded by clicking on their names. But they can also be integrated into dashboards, as described in the next section.
Dashboards
A dashboard in Kibana is essentially a spatial arrangement of visualizations. For example, to construct a dashboard, just place visualizations into a page, resizing them as required, so they can be observed in a single place.
It is interesting to know that in a dashboard all visualizations are linked. So that if, for example, time interval is changed, or a filter is added using the interface, these modifications affect all visualizations in the dashboard and all of them get updated.
Elements in the dashboard visualizations can also generate instant filters by clicking on graphs or table elements. Those filters are then added to the top of the page as a filter and, therefore, can then be modified or removed.
The Aura Analytics default installation preloads two dashboards. Those are available for selection when we click on the “dashboard” icon in the left navigation bar:
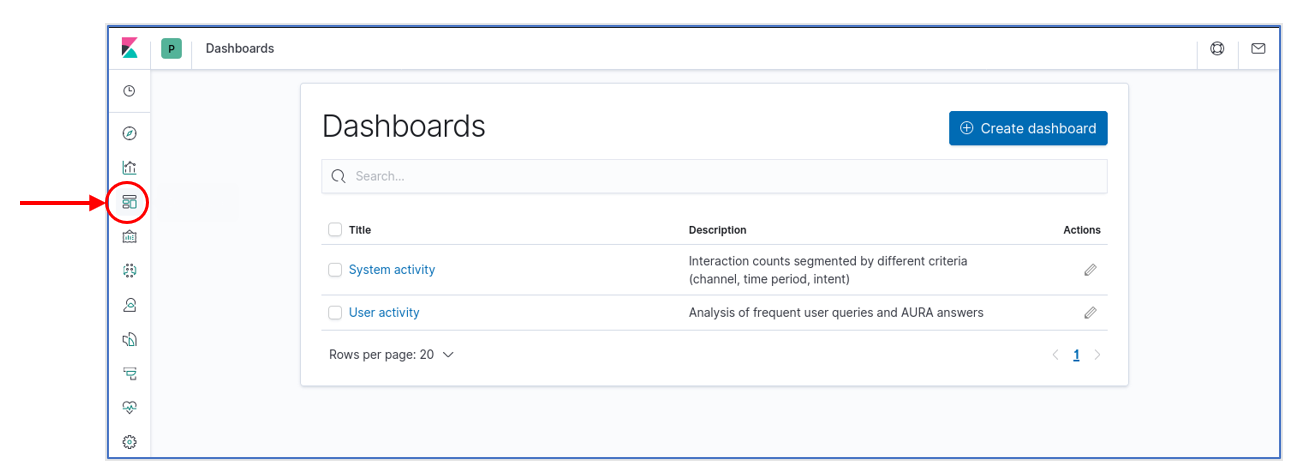
There are different types of dashboards, described in the following sections.
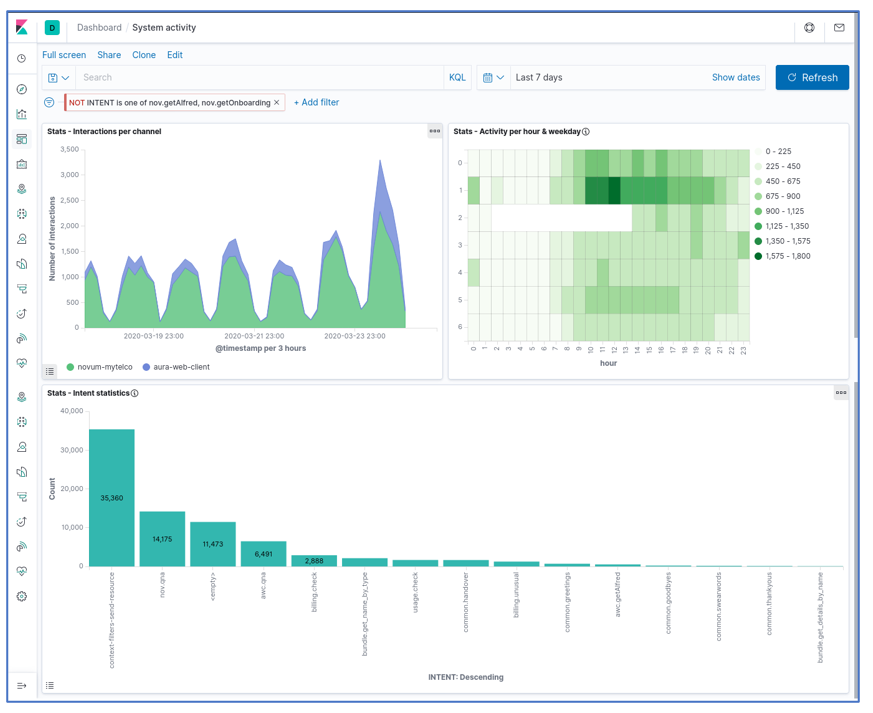
System dashboard
This dashboard integrates the three predefined “Stats” visualizations (generic statistics):
- A timeline of interactions (user messages sent and answered), segmented by channel
- A heatmap of interactions by weekday and time of day (hour)
- A bar graph classifying the interactions produced in the period by detected intent
The following figure shows a screenshot of this dashboard:
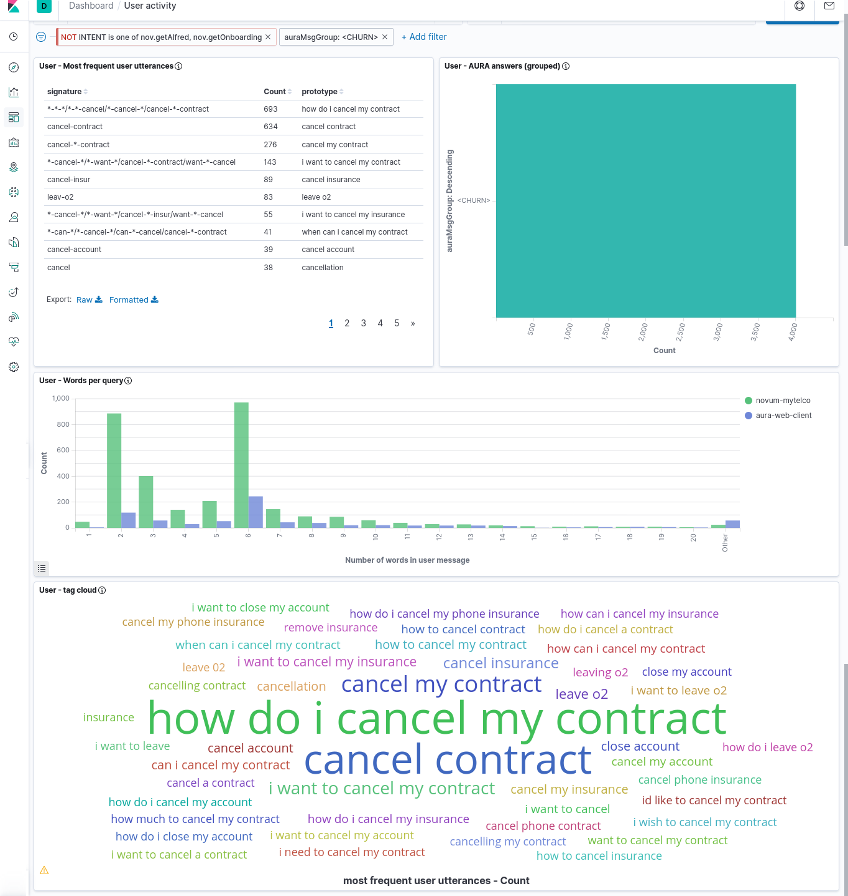
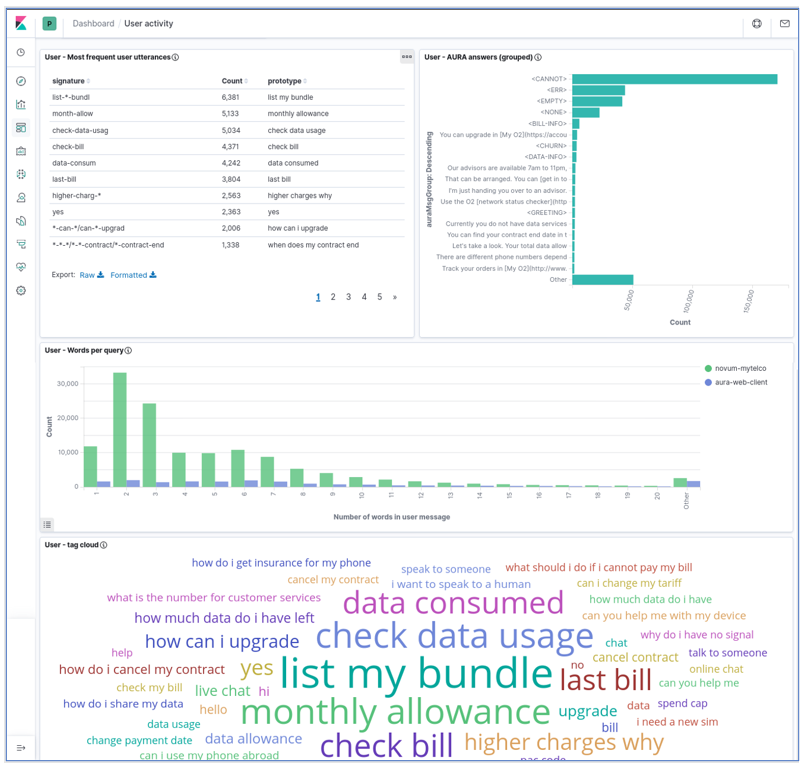
User dashboard
The user dashboard contains the four visualizations:
- Most Frequent User Utterances: list of the most frequent user’s sentences (in the time interval and filter active at the moment). It uses the
usrMsgSigfield to group together very similar utterances. - Aura Answer Groups: list of the most frequent answers that Aura generates, grouped by the semantic categories in
AuraMsgGroupfield. - Words per query: distribution of sizes for the user messages, measured as number of words in the utterance and segmented by channel.
- Tag cloud: set of most frequent user utterances, as a tag cloud in which the font size represents the utterance frequency. The
MESSAGE_USR_NORMfield is used for its representation, so it contains normalized utterances.
The next screenshots show the dashboard with all these visualizations (it is a large dashboard, so typically it needs scrolling to visualize all its components).
Note that those four visualizations are linked as they correspond to the same subset of the data (as given by filters and time interval) but they are NOT linked at the individual item level (i.e., a given most frequent user utterance in the left table does not correspond to any specific Aura answer in the right bar graph).
Instead, the dashboard can be manipulated by selecting one specific item in any of the visualization and this will create a filter for the others. For instance, as the following image shows, if we select <CHURN> in the Aura answer group visualization, we can see in the others the user utterances that led Aura to generate that answer (i.e., an answer about contract cancelation).