Categories:
Kubernetes nodes dashboard
Information provided by Kubernetes nodes dashboard
Introduction
Kubernetes nodes dashboard monitors nodes general system status.
The available metrics are defined in the following sections.
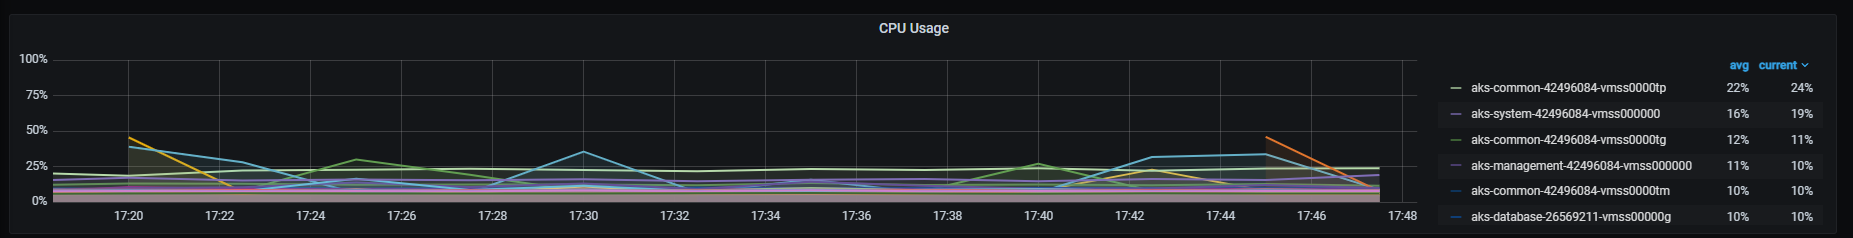
CPU usage
CPU usage percent rate, aggregated by one minute.
Metrics:
sum (rate (container_cpu_usage_seconds_total{id="/",kubernetes_io_hostname=~"^.*$",agentpool=~".*"}[1m])) by (kubernetes_io_hostname) / sum (machine_cpu_cores{kubernetes_io_hostname=~"^.*$",agentpool=~".*"}) by (kubernetes_io_hostname) * 100
Graph visual
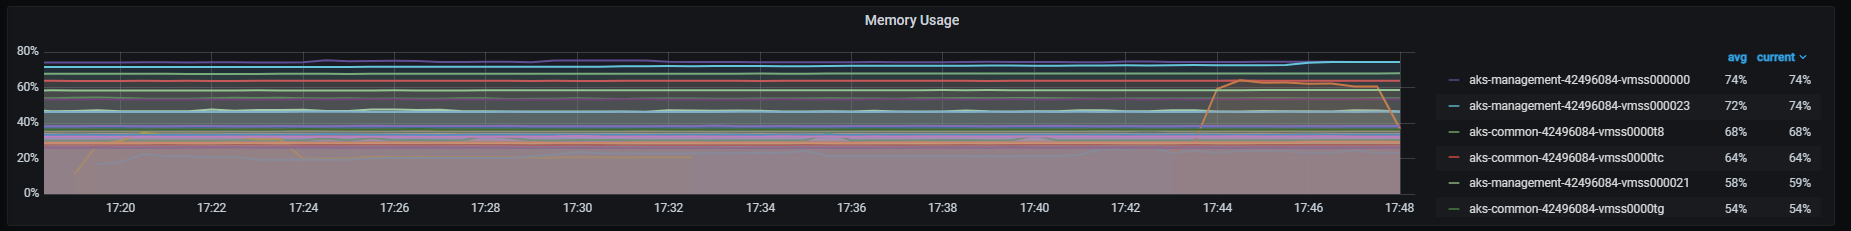
Memory usage
Memory usage percentage.
Metrics:
sum (container_memory_working_set_bytes{id="/", kubernetes_io_hostname=~"^.*$",agentpool=~".*"}) by (kubernetes_io_hostname) / sum (machine_memory_bytes{kubernetes_io_hostname=~"^.*$",agentpool=~".*"}) by (kubernetes_io_hostname) * 100
Graph visual
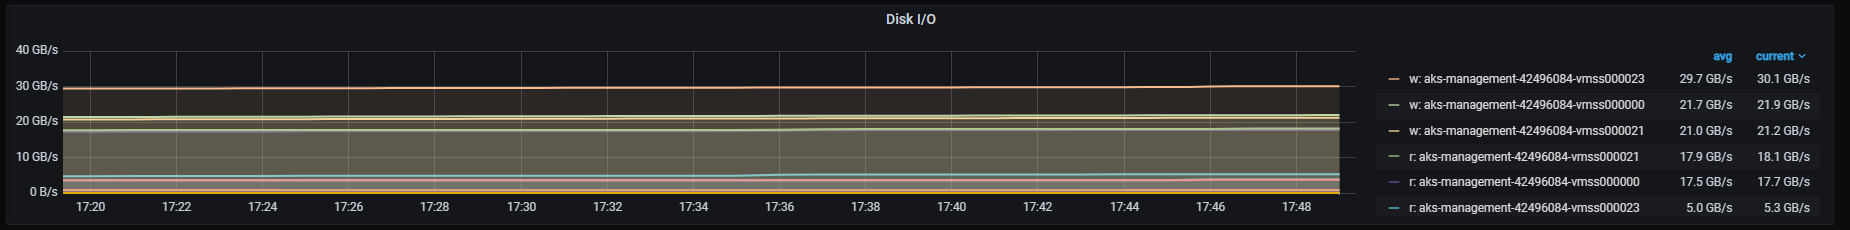
Disk I/O
Disk read/written data in bytes.
Metrics:
It includes two metrics:
- Read bytes
sum (container_fs_reads_bytes_total{id="/", kubernetes_io_hostname=~"^.*$",agentpool=~".*"}) by (kubernetes_io_hostname)
- Written bytes
sum (container_fs_writes_bytes_total{id="/", kubernetes_io_hostname=~"^.*$",agentpool=~".*"}) by (kubernetes_io_hostname)
Graph visual
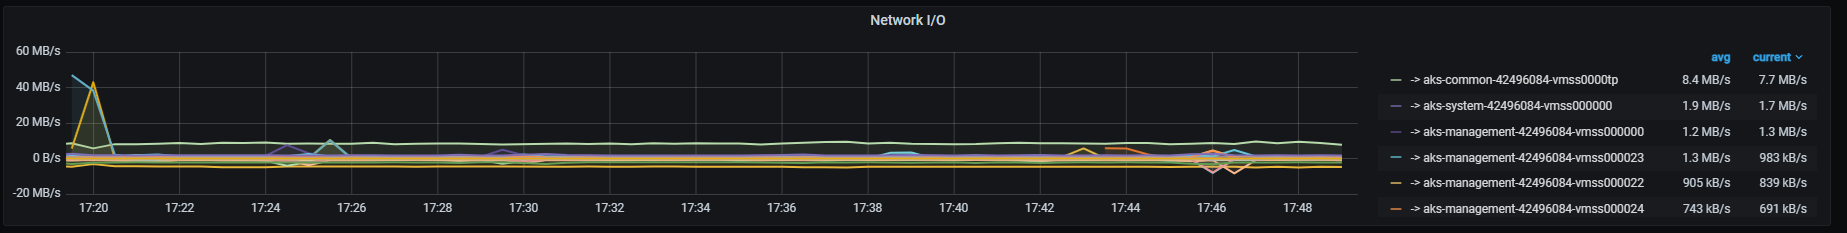
Network I/O
Network received/sent data in bytes, aggregated by one minute.
Metrics:
It includes two metrics:
- Received bytes
sum (rate (container_network_receive_bytes_total{id="/",kubernetes_io_hostname=~"^.*$",agentpool=~".*"}[1m])) by (kubernetes_io_hostname)
- Sent bytes
- sum (rate (container_network_transmit_bytes_total{id="/",kubernetes_io_hostname=~"^.*$",agentpool=~".*"}[1m])) by (kubernetes_io_hostname)
Graph visual
Last modified January 15, 2025: feat: Documentation Assistant and ATRIA for Linkin Park release #AURA-26619 [RTM] (409958c0)