Categories:
NLP provisioning dashboard
Information provided by NLP provisioning dashboard
Panels
Expected Killed Alive
Number of expected, killed and alive provisioning processes.
The queries used to get the panel information are:
nlp_provisioning_expected_alive_processes
nlp_provisioning_killed_processes
nlp_provisioning_alive_processes
An example of this panel is shown below:

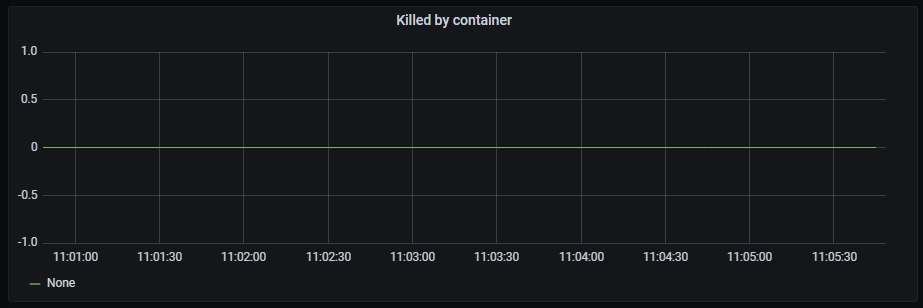
Killed by container
Time series with the killed processes by container.
The x-axis shows the time series and the y-axis shows the number of killed processes by container.
The queries used to get the panel information are:
nlp_provisioning_container_killed_count_total
An example of this panel is shown below:
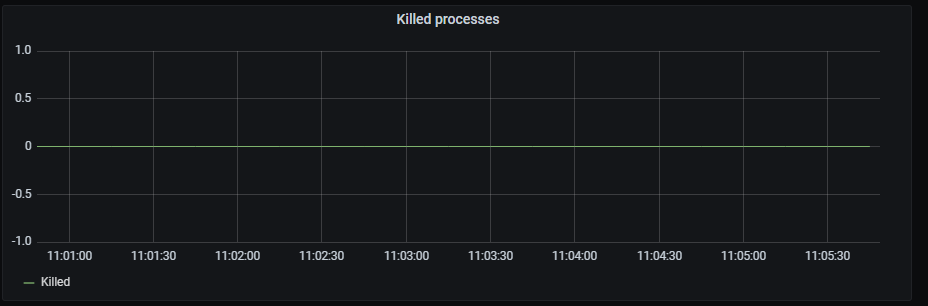
Killed processes
Time series with the total killed processes.
The x-axis shows the time series and the y-axis shows the number of killed processes.
The queries used to get the panel information are:
nlp_provisioning_killed_processes
An example of this panel is shown below:
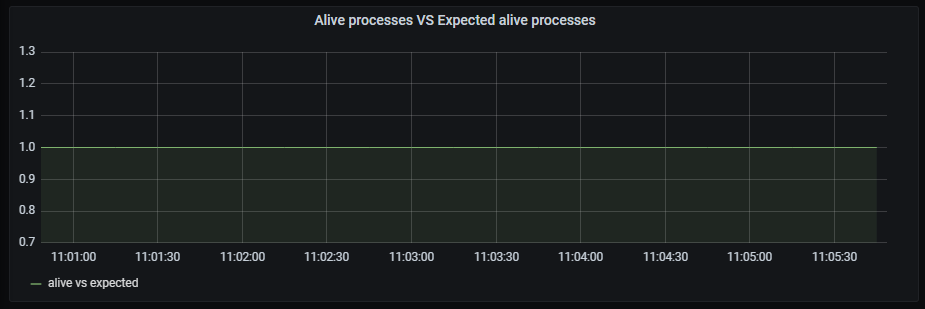
Alive processes VS Expected alive processes
Time series with the ratio between alive processes and expected alive processes.
The x-axis shows the time series and the y-axis shows the ratio between alive and expected
The queries used to get the panel information are:
nlp_provisioning_alive_processes/ nlp_provisioning_expected_alive_processes
An example of this panel is shown below:
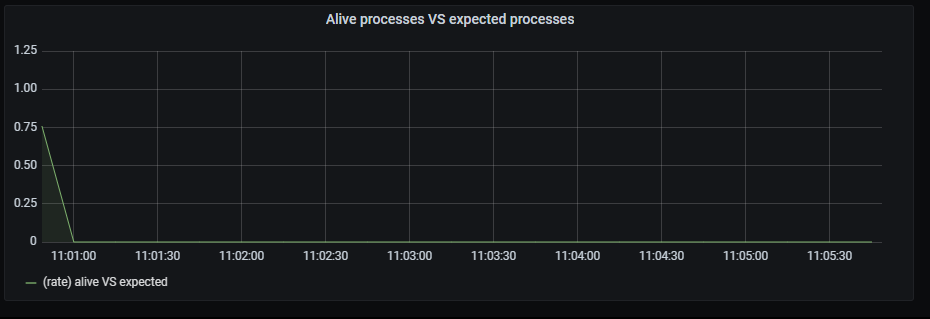
Alive processes VS expected processes
Time series with the ratio between alive processes rate aggregated by 15 minutes and expected alive processes rate aggregated by 15 minutes.
The x-axis shows the time series and the y-axis shows the ratio between alive/expected processes
The queries used to get the panel information are:
sum by (exported_job) (rate(nlp_provisioning_alive_processes{exported_job="nlp_provisioning_job"}[15m])) /
sum by (exported_job) (rate(nlp_provisioning_expected_alive_processes{exported_job="nlp_provisioning_job"}[15m]))
An example of this panel is shown below: