Categories:
Aura bot latencies dashboard
Information provided by Aura bot latencies dashboard
Introduction
Aura bot latencies dashboard monitors outbound and inbound latencies on the request and responses handled directly by aura-bot.
The available metrics are defined in the following sections, corresponding to request errors and latency for requests, Microsoft APIs, Kernel APIs, Cognitive APIs, aura-services APIs and other APIs.
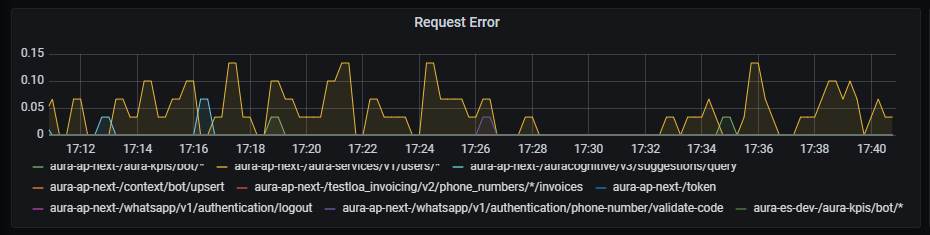
Request error
Request error graph shows the number of errors rate, aggregated by one minute.
Graph metrics
sum by (kubernetes_namespace,path)(rate(outgoing_request_duration_seconds_count{app="aura-bot",status=~"4..|500"}[1m]))
Graph visual
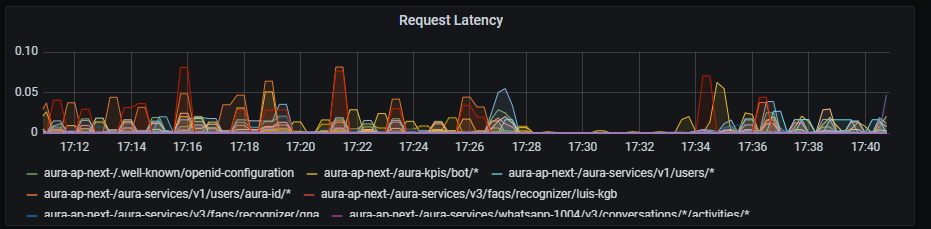
Request latency
Request latency graph shows latency rate for outgoing traffic, aggregated by one minute.
Graph metrics
sum by (path,kubernetes_namespace)(rate(outgoing_request_duration_seconds_sum{app="aura-bot"}[1m]))
Graph visual
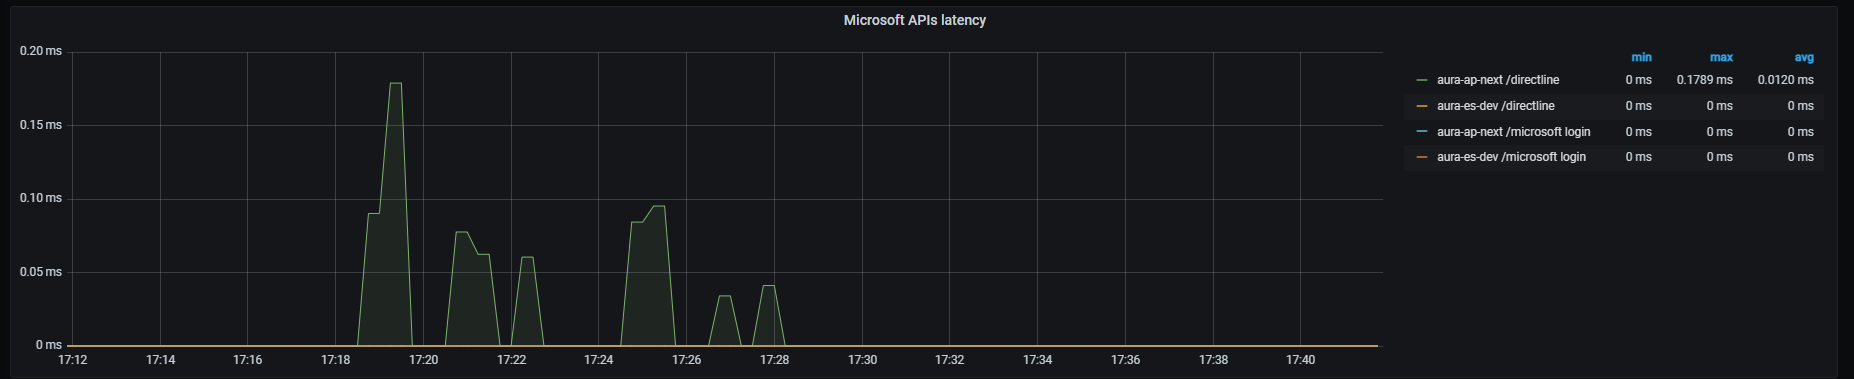
Microsoft APIs latency
Microsoft APIs latency graph shows mean latency rate for the different Microsoft APIs used.
Graph metrics
Currently, there are three monitored Microsoft endpoints:
- Direct Line endpoint
sum by (path,kubernetes_namespace)(rate(outgoing_request_duration_seconds_sum{app="aura-bot",host=~"directline.botframework.com"}[1m]))/
sum by (path,kubernetes_namespace)(rate(outgoing_request_duration_seconds_count{app="aura-bot",host=~"directline.botframework.com"}[1m]))
- Microsoft auth endpoint
sum by (path,kubernetes_namespace)(rate(outgoing_request_duration_seconds_sum{app="aura-bot",host=~"login.microsoftonline.com"}[1m]))/
sum by (path,kubernetes_namespace)(rate(outgoing_request_duration_seconds_count{app="aura-bot",host=~"login.microsoftonline.com"}[1m]))
- Blob storage endpoint
sum (label_replace(outgoing_request_duration_seconds_sum{app="aura-bot",host=~"aura.*blob.core.windows.net",path=~"/aura-temporary-resources/.*"},"path_set","$1","path","/aura-temporary-resources/.*")) by (path_set,kubernetes_namespace) /
sum (label_replace(outgoing_request_duration_seconds_count{app="aura-bot",host=~"aura.*blob.core.windows.net",path=~"/aura-temporary-resources/.*"},"path_set","$1","path","/aura-temporary-resources/.*")) by (path_set,kubernetes_namespace)
Graph visual
Kernel APIs latency
Kernel APIs latency graph shows mean latency rate for the different Kernel APIs used.
Graph metrics
Currently, there are four monitored Kernel endpoints (more can be added if necessary for a given environment):
- Kernel auth endpoint
sum by (kubernetes_namespace,path)(rate(outgoing_request_duration_seconds_sum{app="aura-bot",host=~"auth.*"}[1m]))/
sum by (kubernetes_namespace,path)(rate(outgoing_request_duration_seconds_count{app="aura-bot",host=~"auth.*"}[1m]))
- Kernel subscribed products endpoint
sum by (kubernetes_namespace,path)(rate(outgoing_request_duration_seconds_sum{app="aura-bot",host=~"api.*",path=~"/subscribed_products/.*"}[1m]))/
sum by (kubernetes_namespace,path)(rate(outgoing_request_duration_seconds_count{app="aura-bot",host=~"api.*",path=~"/subscribed_products/.*"}[1m]))
- Kernel user profile endpoint
sum by (kubernetes_namespace,path)(rate(outgoing_request_duration_seconds_sum{app="aura-bot",host=~"api.*",path=~"/userprofile/.*"}[1m]))/
sum by (kubernetes_namespace,path)(rate(outgoing_request_duration_seconds_count{app="aura-bot",host=~"api.*",path=~"/userprofile/.*"}[1m]))
- Kernel invoicing enpoint
sum by (kubernetes_namespace,path)(rate(outgoing_request_duration_seconds_sum{app="aura-bot",host=~"api.*",path=~"/invoicing/.*"}[1m]))/
sum by (kubernetes_namespace,path)(rate(outgoing_request_duration_seconds_count{app="aura-bot",host=~"api.*",path=~"/invoicing/.*"}[1m]))
Graph visual
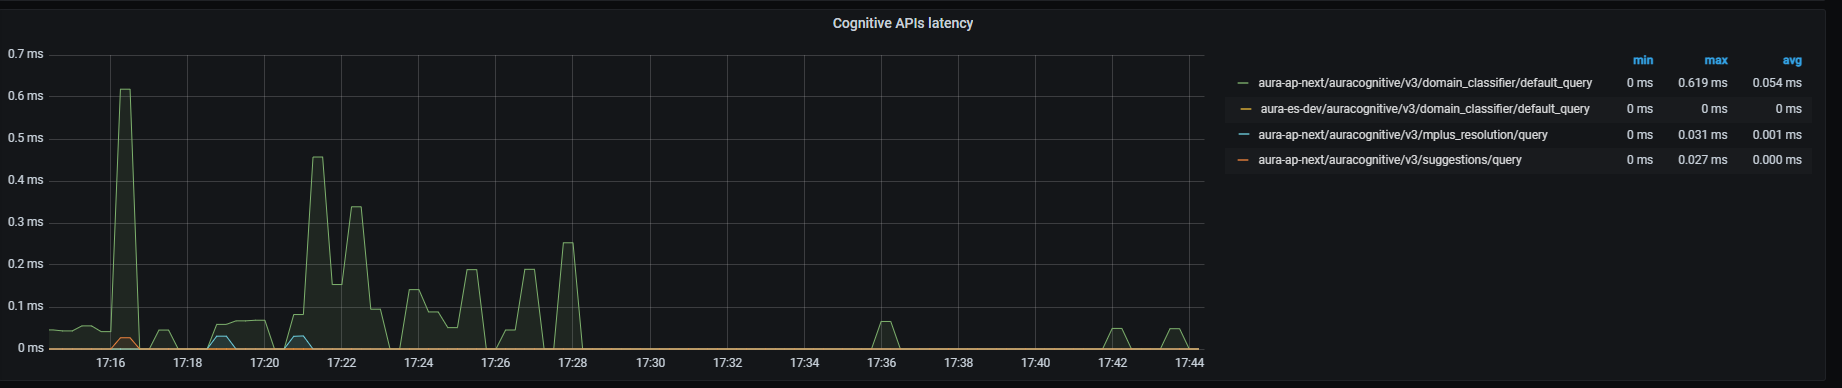
Cognitive APIs latency
Cognitive APIs latency graph shows mean latency rate for the different cognitive APIs used.
Graph metrics
Currently, there are three monitored Cognitive endpoints:
- Domain classifier endpoint
sum by (kubernetes_namespace,path)(rate(outgoing_request_duration_seconds_sum{app="aura-bot",host=~"api-.*",path=~"/auracognitive/v3/domain_classifier/.*"}[1m]))/
sum by (kubernetes_namespace,path)(rate(outgoing_request_duration_seconds_count{app="aura-bot",host=~"api-.*",path=~"/auracognitive/v3/domain_classifier/.*"}[1m]))
- Mplus resolution endpoint
sum by (kubernetes_namespace,path)(rate(outgoing_request_duration_seconds_sum{app="aura-bot",host=~"api-.*",path=~"/auracognitive/v3/mplus_resolution/.*"}[1m]))/
sum by (kubernetes_namespace,path)(rate(outgoing_request_duration_seconds_count{app="aura-bot",host=~"api-.*",path=~"/auracognitive/v3/mplus_resolution/.*"}[1m]))
- Suggestions endpoint
sum by (kubernetes_namespace,path)(rate(outgoing_request_duration_seconds_sum{app="aura-bot",host=~"api-.*",path=~"/auracognitive/v3/suggestions/.*"}[1m]))/
sum by (kubernetes_namespace,path)(rate(outgoing_request_duration_seconds_count{app="aura-bot",host=~"api-.*",path=~"/auracognitive/v3/suggestions/.*"}[1m]))
Graph visual
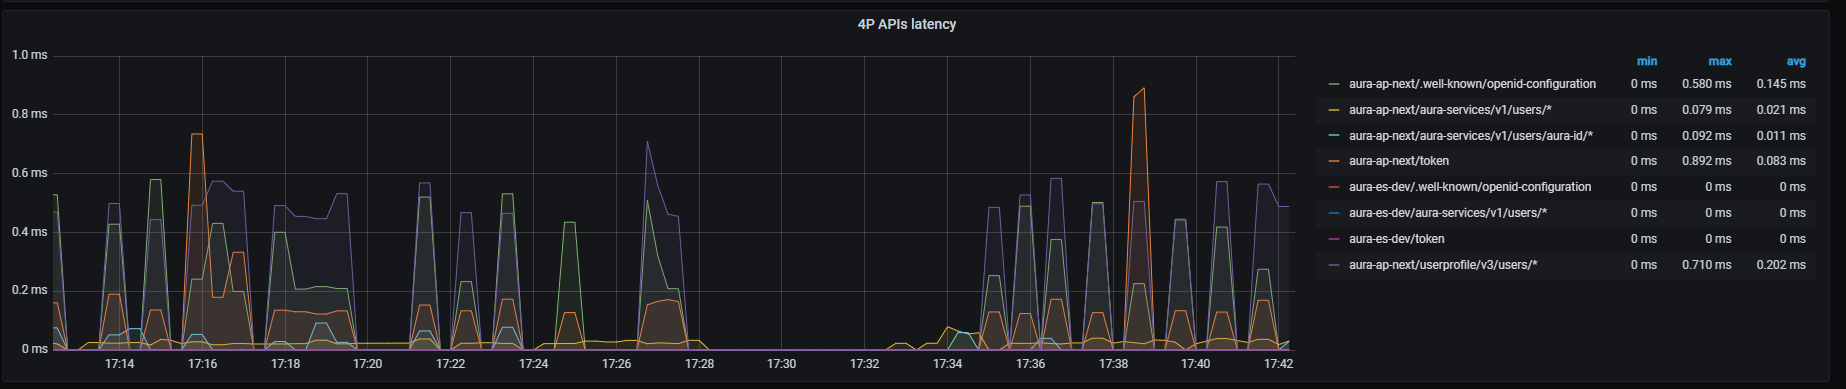
Aura-services APIs latency
Graph metrics
sum by (path,kubernetes_namespace)(rate(outgoing_request_duration_seconds_sum{app="aura-bot", path=~"/aura-services/.*"}[1m]))/
sum by (path,kubernetes_namespace)(rate(outgoing_request_duration_seconds_count{app="aura-bot", path=~"/aura-services/.*"}[1m]))
Graph visual
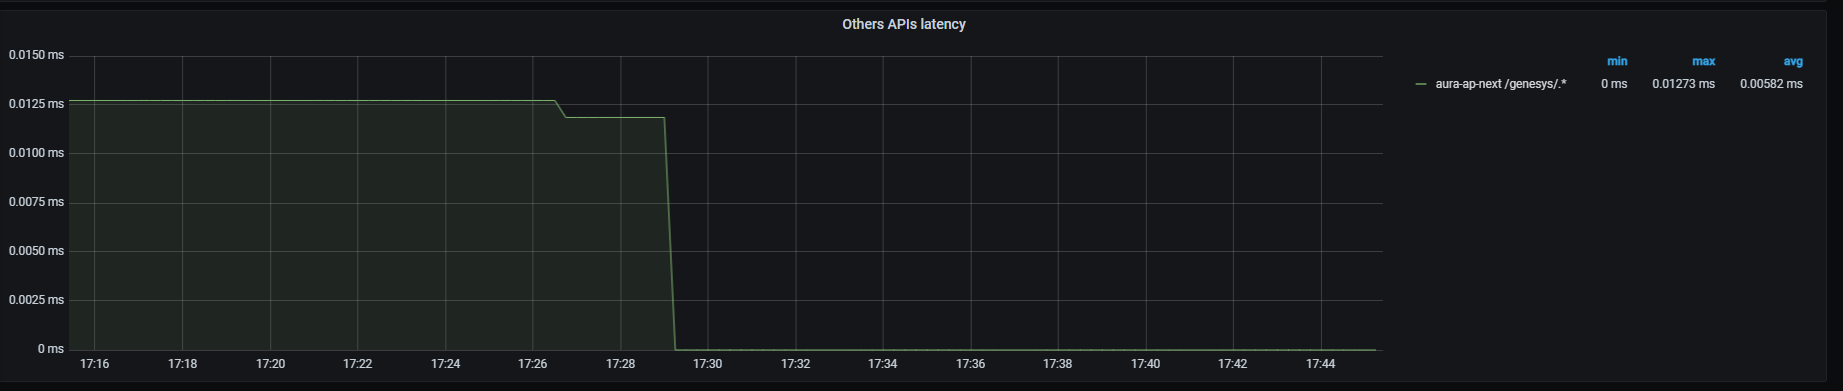
Other APIs latency
Other APIs latency graph shows mean latency rate for traffic directed to other APIs different from those above, aggregated by one minute.
Graph metrics
Currently, the only API monitored is Genesys API:
sum (label_replace(outgoing_request_duration_seconds_sum{app="aura-bot",path=~"/genesys/.*"},"path_set","$1","path","/genesys/.*")) by (path_set,kubernetes_namespace) / sum (label_replace(outgoing_request_duration_seconds_count{app="aura-bot",path=~"/genesys/.*"},"path_set","$1","path","/genesys/.*")) by (path_set,kubernetes_namespace)
Graph visual
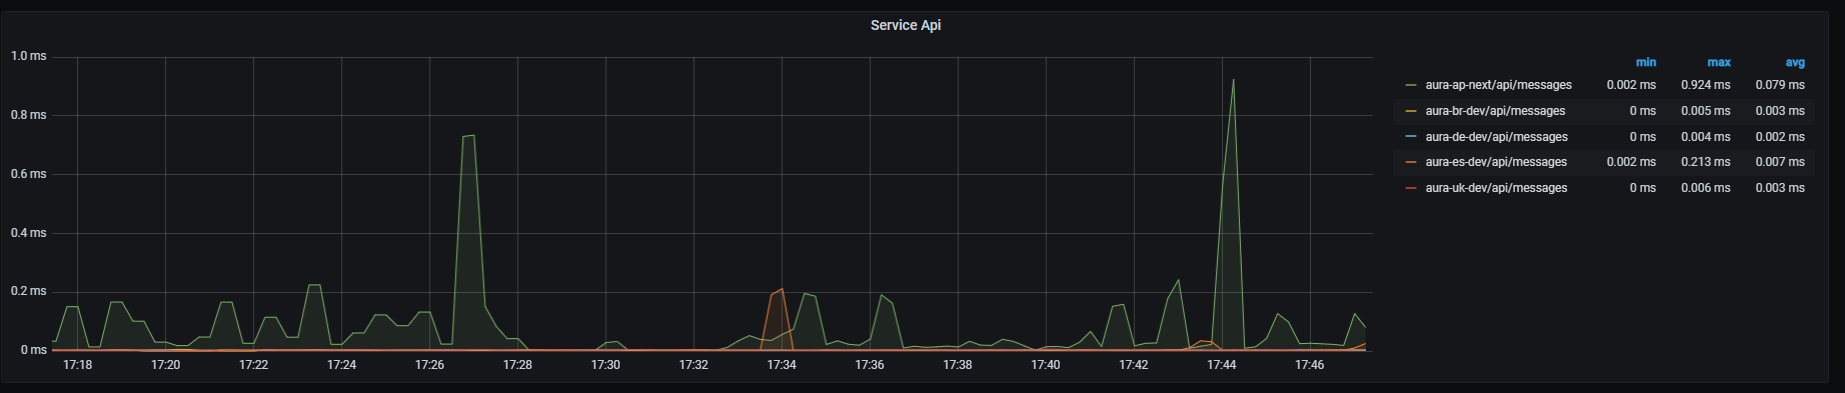
Service API
Service API graph shows mean latency rate for the main endpoint on aura-bridge, that receives requests from Direct Line and aura-bridge. Aggregated by one minute.
Graph metrics
sum by (path,kubernetes_namespace)(rate(http_request_duration_seconds_sum{path=~"/api/messages"}[1m]))/
sum by (path,kubernetes_namespace)(rate(http_request_duration_seconds_count{path=~"/api/messages"}[1m]))
Graph visual