Categories:
Prometheus stats dashboard
Information provided by Prometheus stats dashboard
Introduction
This is a dashboard to obtain a lot of information on how Prometheus performs.
To get the information about each pod, the dashboard counts on a filter with the following fields:
jobs: list of active jobs.instances: list of scrapeable instances.interval: possible time intervals.
Once selected, the following graphs are printed.
Panels
Pods CPU usage
Time series with CPU usage rate, aggregated by one minute. It also shows the current minimum, maximum and average cpu usage.
The x-axis shows the time series and the y-axis shows the cpu usage rate.
The queries used to get the panel information are:
sum(rate(container_cpu_usage_seconds_total{pod_name!="",pod_name=~"prometheus.*"}[1m])) by (pod_name)
An example of this panel is shown below:
Pods memory usage
Time series with memory usage. It also shows the current minimum, maximum and average memory usage.
The x-axis shows the time series and the y-axis shows the memory usage.
The queries used to get the panel information are:
sum (container_memory_working_set_bytes{pod_name!="",pod_name=~"prometheus.*"}) by (pod_name)
An example of this panel is shown below:
Pods network I/O
Time series with the network I/O average aggregated by one minute. It also shows the current minimum, maximum and average network I/O bytes.
The x-axis shows the time series and the y-axis shows the network I/O.
The queries used to get the panel information are:
sum (rate (container_network_receive_bytes_total{pod_name!="",pod_name=~"prometheus.*"}[1m])) by (pod_name)
- sum (rate (container_network_transmit_bytes_total{pod_name!="",pod_name=~"prometheus.*"}[1m])) by (pod_name)
An example of this panel is shown below:
Uptime
Percentage of uptime for the last hour.
The queries used to get the panel information are:
avg(avg_over_time(up{instance=~"(10\\.240\\.0\\.10:9093|10\\.240\\.3\\.161:9093|10\\.240\\.0\\.34:9114|10\\.240\\.0\\.253:8080|10\\.240\\.3\\.205:9090|10\\.240\\.3\\.236:9090|10\\.240\\.4\\.14:9090|10\\.240\\.4\\.156:9121|10\\.240\\.4\\.186:9121|10\\.240\\.4\\.223:9121)",job=~"kubernetes-service-endpoints"}[1h]) * 100)
An example of this panel is shown below:
Currently down
Currently down instances.
The queries used to get the panel information are:
up{instance=~"(10\\.240\\.0\\.5:9093|10\\.240\\.0\\.76:9093|10\\.240\\.0\\.26:9114|10\\.240\\.0\\.253:8080|10\\.240\\.0\\.94:9090|10\\.240\\.1\\.199:9090|10\\.240\\.2\\.4:9090|10\\.240\\.2\\.204:9121|10\\.240\\.2\\.245:9121|10\\.240\\.3\\.10:9121)",job=~"kubernetes-service-endpoints"} < 1
An example of this panel is shown below:
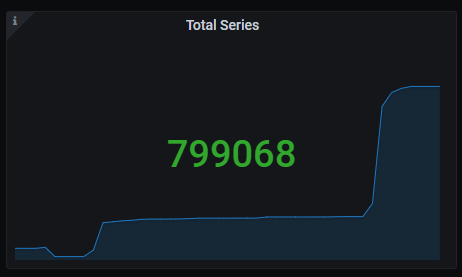
Total series
Total series count.
The queries used to get the panel information are:
sum(prometheus_tsdb_head_series{job=~"kubernetes-service-endpoints",instance=~"(10\\.240\\.0\\.5:9093|10\\.240\\.0\\.76:9093|10\\.240\\.0\\.26:9114|10\\.240\\.0\\.253:8080|10\\.240\\.0\\.94:9090|10\\.240\\.1\\.199:9090|10\\.240\\.2\\.4:9090|10\\.240\\.2\\.204:9121|10\\.240\\.2\\.245:9121|10\\.240\\.3\\.10:9121)"})
An example of this panel is shown below:
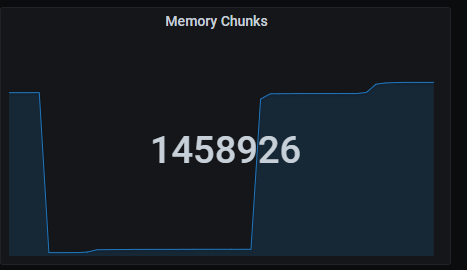
Total series
Memory chunks being used.
The queries used to get the panel information are:
sum(prometheus_tsdb_head_chunks{job=~"kubernetes-service-endpoints",instance=~"(10\\.240\\.0\\.5:9093|10\\.240\\.0\\.76:9093|10\\.240\\.0\\.26:9114|10\\.240\\.0\\.253:8080|10\\.240\\.0\\.94:9090|10\\.240\\.1\\.199:9090|10\\.240\\.2\\.4:9090|10\\.240\\.2\\.204:9121|10\\.240\\.2\\.245:9121|10\\.240\\.3\\.10:9121)"})
An example of this panel is shown below:
Quick numbers
Quick numbers section shows a series of Prometheus indicators.
Missed iterations
Number of missed iterations, aggregated by one hour.
The queries used to get the panel information are:
sum(sum_over_time(prometheus_evaluator_iterations_missed_total{job=~"kubernetes-service-endpoints",instance=~"(10\\.240\\.0\\.5:9093|10\\.240\\.0\\.76:9093|10\\.240\\.0\\.26:9114|10\\.240\\.0\\.253:8080|10\\.240\\.0\\.94:9090|10\\.240\\.1\\.199:9090|10\\.240\\.2\\.4:9090|10\\.240\\.2\\.204:9121|10\\.240\\.2\\.245:9121|10\\.240\\.3\\.10:9121)"}[1h]))
Skipped iterations
Number of skipped iterations, aggregated by one hour.
The queries used to get the panel information are:
sum(sum_over_time(prometheus_evaluator_iterations_skipped_total{job=~"kubernetes-service-endpoints",instance=~"(10\\.240\\.0\\.5:9093|10\\.240\\.0\\.76:9093|10\\.240\\.0\\.26:9114|10\\.240\\.0\\.253:8080|10\\.240\\.0\\.94:9090|10\\.240\\.1\\.199:9090|10\\.240\\.2\\.4:9090|10\\.240\\.2\\.204:9121|10\\.240\\.2\\.245:9121|10\\.240\\.3\\.10:9121)"}[1h]))
Tardy scrapes
Number of scrapes that elapsed more than expected, aggregated by one hour.
The queries used to get the panel information are:
sum(sum_over_time(prometheus_target_scrapes_exceeded_sample_limit_total{job=~"kubernetes-service-endpoints",instance=~"(10\\.240\\.0\\.5:9093|10\\.240\\.0\\.76:9093|10\\.240\\.0\\.26:9114|10\\.240\\.0\\.253:8080|10\\.240\\.0\\.94:9090|10\\.240\\.1\\.199:9090|10\\.240\\.2\\.4:9090|10\\.240\\.2\\.204:9121|10\\.240\\.2\\.245:9121|10\\.240\\.3\\.10:9121)"}[1h]))
Reload failures
Number of reload failures, aggregated by one hour.
The queries used to get the panel information are:
sum(sum_over_time(prometheus_tsdb_reloads_failures_total{job=~"kubernetes-service-endpoints",instance=~"(10\\.240\\.0\\.5:9093|10\\.240\\.0\\.76:9093|10\\.240\\.0\\.26:9114|10\\.240\\.0\\.253:8080|10\\.240\\.0\\.94:9090|10\\.240\\.1\\.199:9090|10\\.240\\.2\\.4:9090|10\\.240\\.2\\.204:9121|10\\.240\\.2\\.245:9121|10\\.240\\.3\\.10:9121)"}[1h]))
Skipped scrapes
Number of uncompleted scrapes due to multiple reasons, aggregated by one hour.
The queries used to get the panel information are:
sum(sum_over_time(prometheus_target_scrapes_exceeded_sample_limit_total{job=~"kubernetes-service-endpoints",instance=~"(10\\.240\\.0\\.5:9093|10\\.240\\.0\\.76:9093|10\\.240\\.0\\.26:9114|10\\.240\\.0\\.253:8080|10\\.240\\.0\\.94:9090|10\\.240\\.1\\.199:9090|10\\.240\\.2\\.4:9090|10\\.240\\.2\\.204:9121|10\\.240\\.2\\.245:9121|10\\.240\\.3\\.10:9121)"}[1h])) +
sum(sum_over_time(prometheus_target_scrapes_sample_duplicate_timestamp_total{job=~"kubernetes-service-endpoints",instance=~"(10\\.240\\.0\\.5:9093|10\\.240\\.0\\.76:9093|10\\.240\\.0\\.26:9114|10\\.240\\.0\\.253:8080|10\\.240\\.0\\.94:9090|10\\.240\\.1\\.199:9090|10\\.240\\.2\\.4:9090|10\\.240\\.2\\.204:9121|10\\.240\\.2\\.245:9121|10\\.240\\.3\\.10:9121)"}[1h])) +
sum(sum_over_time(prometheus_target_scrapes_sample_out_of_bounds_total{job=~"kubernetes-service-endpoints",instance=~"(10\\.240\\.0\\.5:9093|10\\.240\\.0\\.76:9093|10\\.240\\.0\\.26:9114|10\\.240\\.0\\.253:8080|10\\.240\\.0\\.94:9090|10\\.240\\.1\\.199:9090|10\\.240\\.2\\.4:9090|10\\.240\\.2\\.204:9121|10\\.240\\.2\\.245:9121|10\\.240\\.3\\.10:9121)"}[1h])) +
sum(sum_over_time(prometheus_target_scrapes_sample_out_of_order_total{job=~"kubernetes-service-endpoints",instance=~"(10\\.240\\.0\\.5:9093|10\\.240\\.0\\.76:9093|10\\.240\\.0\\.26:9114|10\\.240\\.0\\.253:8080|10\\.240\\.0\\.94:9090|10\\.240\\.1\\.199:9090|10\\.240\\.2\\.4:9090|10\\.240\\.2\\.204:9121|10\\.240\\.2\\.245:9121|10\\.240\\.3\\.10:9121)"}[1h]))
An example of this panel is shown below:

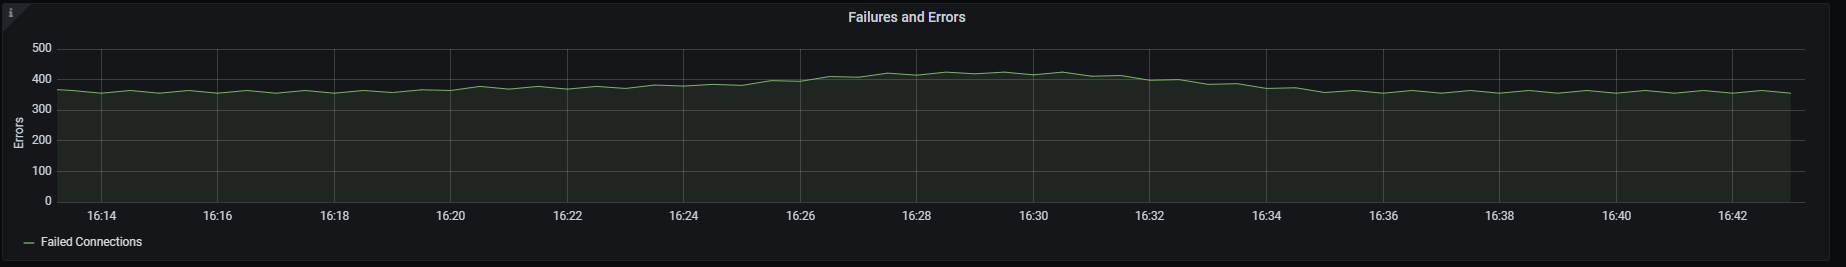
Failures and errors
Time series with the number of several different errors and failures, aggregated by five minutes.
The x-axis shows the time series and the y-axis shows a series of different errors and failures:
- Dialer connection errors.
- Evaluator iterations missed.
- Evaluator iterations skipped.
- Evaluation failures.
- Azure refresh failures.
- Consul rpc failures.
- Dns lookup failures.
- Ec2 refresh failures.
- Gce refresh failures.
- Marathon refresh failures.
- Openstack refresh failures.
- Triton refresh failures.
- Scrapes exceeded sample limit.
- Scrapes sample duplicate timestamp.
- Scrapes sample out of bounds.
- Treecache zookeeper failures.
- Tsdb compactions failed.
- Tsdb head series not found.
- Tsdb reloads failures.
The queries used to get the panel information are:
sum(increase(net_conntrack_dialer_conn_failed_total{instance=~"(10\\.240\\.0\\.5:9093|10\\.240\\.0\\.76:9093|10\\.240\\.0\\.26:9114|10\\.240\\.0\\.253:8080|10\\.240\\.0\\.94:9090|10\\.240\\.1\\.199:9090|10\\.240\\.2\\.4:9090|10\\.240\\.2\\.204:9121|10\\.240\\.2\\.245:9121|10\\.240\\.3\\.10:9121)"}[5m])) > 0
sum(increase(prometheus_evaluator_iterations_missed_total{instance=~"(10\\.240\\.0\\.5:9093|10\\.240\\.0\\.76:9093|10\\.240\\.0\\.26:9114|10\\.240\\.0\\.253:8080|10\\.240\\.0\\.94:9090|10\\.240\\.1\\.199:9090|10\\.240\\.2\\.4:9090|10\\.240\\.2\\.204:9121|10\\.240\\.2\\.245:9121|10\\.240\\.3\\.10:9121)"}[5m])) > 0
sum(increase(prometheus_evaluator_iterations_skipped_total{instance=~"(10\\.240\\.0\\.5:9093|10\\.240\\.0\\.76:9093|10\\.240\\.0\\.26:9114|10\\.240\\.0\\.253:8080|10\\.240\\.0\\.94:9090|10\\.240\\.1\\.199:9090|10\\.240\\.2\\.4:9090|10\\.240\\.2\\.204:9121|10\\.240\\.2\\.245:9121|10\\.240\\.3\\.10:9121)"}[5m])) > 0
sum(increase(prometheus_rule_evaluation_failures_total{instance=~"(10\\.240\\.0\\.5:9093|10\\.240\\.0\\.76:9093|10\\.240\\.0\\.26:9114|10\\.240\\.0\\.253:8080|10\\.240\\.0\\.94:9090|10\\.240\\.1\\.199:9090|10\\.240\\.2\\.4:9090|10\\.240\\.2\\.204:9121|10\\.240\\.2\\.245:9121|10\\.240\\.3\\.10:9121)"}[5m])) > 0
sum(increase(prometheus_sd_azure_refresh_failures_total{instance=~"(10\\.240\\.0\\.5:9093|10\\.240\\.0\\.76:9093|10\\.240\\.0\\.26:9114|10\\.240\\.0\\.253:8080|10\\.240\\.0\\.94:9090|10\\.240\\.1\\.199:9090|10\\.240\\.2\\.4:9090|10\\.240\\.2\\.204:9121|10\\.240\\.2\\.245:9121|10\\.240\\.3\\.10:9121)"}[5m])) > 0
sum(increase(prometheus_sd_consul_rpc_failures_total{instance=~"(10\\.240\\.0\\.5:9093|10\\.240\\.0\\.76:9093|10\\.240\\.0\\.26:9114|10\\.240\\.0\\.253:8080|10\\.240\\.0\\.94:9090|10\\.240\\.1\\.199:9090|10\\.240\\.2\\.4:9090|10\\.240\\.2\\.204:9121|10\\.240\\.2\\.245:9121|10\\.240\\.3\\.10:9121)"}[5m])) > 0
sum(increase(prometheus_sd_dns_lookup_failures_total{instance=~"(10\\.240\\.0\\.5:9093|10\\.240\\.0\\.76:9093|10\\.240\\.0\\.26:9114|10\\.240\\.0\\.253:8080|10\\.240\\.0\\.94:9090|10\\.240\\.1\\.199:9090|10\\.240\\.2\\.4:9090|10\\.240\\.2\\.204:9121|10\\.240\\.2\\.245:9121|10\\.240\\.3\\.10:9121)"}[5m])) > 0
sum(increase(prometheus_sd_ec2_refresh_failures_total{instance=~"(10\\.240\\.0\\.5:9093|10\\.240\\.0\\.76:9093|10\\.240\\.0\\.26:9114|10\\.240\\.0\\.253:8080|10\\.240\\.0\\.94:9090|10\\.240\\.1\\.199:9090|10\\.240\\.2\\.4:9090|10\\.240\\.2\\.204:9121|10\\.240\\.2\\.245:9121|10\\.240\\.3\\.10:9121)"}[5m])) > 0
sum(increase(prometheus_sd_gce_refresh_failures_total{instance=~"(10\\.240\\.0\\.5:9093|10\\.240\\.0\\.76:9093|10\\.240\\.0\\.26:9114|10\\.240\\.0\\.253:8080|10\\.240\\.0\\.94:9090|10\\.240\\.1\\.199:9090|10\\.240\\.2\\.4:9090|10\\.240\\.2\\.204:9121|10\\.240\\.2\\.245:9121|10\\.240\\.3\\.10:9121)"}[5m])) > 0
sum(increase(prometheus_sd_marathon_refresh_failures_total{instance=~"(10\\.240\\.0\\.5:9093|10\\.240\\.0\\.76:9093|10\\.240\\.0\\.26:9114|10\\.240\\.0\\.253:8080|10\\.240\\.0\\.94:9090|10\\.240\\.1\\.199:9090|10\\.240\\.2\\.4:9090|10\\.240\\.2\\.204:9121|10\\.240\\.2\\.245:9121|10\\.240\\.3\\.10:9121)"}[5m])) > 0
sum(increase(prometheus_sd_openstack_refresh_failures_total{instance=~"(10\\.240\\.0\\.5:9093|10\\.240\\.0\\.76:9093|10\\.240\\.0\\.26:9114|10\\.240\\.0\\.253:8080|10\\.240\\.0\\.94:9090|10\\.240\\.1\\.199:9090|10\\.240\\.2\\.4:9090|10\\.240\\.2\\.204:9121|10\\.240\\.2\\.245:9121|10\\.240\\.3\\.10:9121)"}[5m])) > 0
sum(increase(prometheus_sd_triton_refresh_failures_total{instance=~"(10\\.240\\.0\\.5:9093|10\\.240\\.0\\.76:9093|10\\.240\\.0\\.26:9114|10\\.240\\.0\\.253:8080|10\\.240\\.0\\.94:9090|10\\.240\\.1\\.199:9090|10\\.240\\.2\\.4:9090|10\\.240\\.2\\.204:9121|10\\.240\\.2\\.245:9121|10\\.240\\.3\\.10:9121)"}[5m])) > 0
sum(increase(prometheus_target_scrapes_exceeded_sample_limit_total{instance=~"(10\\.240\\.0\\.5:9093|10\\.240\\.0\\.76:9093|10\\.240\\.0\\.26:9114|10\\.240\\.0\\.253:8080|10\\.240\\.0\\.94:9090|10\\.240\\.1\\.199:9090|10\\.240\\.2\\.4:9090|10\\.240\\.2\\.204:9121|10\\.240\\.2\\.245:9121|10\\.240\\.3\\.10:9121)"}[5m])) > 0
sum(increase(prometheus_target_scrapes_sample_duplicate_timestamp_total{instance=~"(10\\.240\\.0\\.5:9093|10\\.240\\.0\\.76:9093|10\\.240\\.0\\.26:9114|10\\.240\\.0\\.253:8080|10\\.240\\.0\\.94:9090|10\\.240\\.1\\.199:9090|10\\.240\\.2\\.4:9090|10\\.240\\.2\\.204:9121|10\\.240\\.2\\.245:9121|10\\.240\\.3\\.10:9121)"}[5m])) > 0
sum(increase(prometheus_target_scrapes_sample_out_of_bounds_total{instance=~"(10\\.240\\.0\\.5:9093|10\\.240\\.0\\.76:9093|10\\.240\\.0\\.26:9114|10\\.240\\.0\\.253:8080|10\\.240\\.0\\.94:9090|10\\.240\\.1\\.199:9090|10\\.240\\.2\\.4:9090|10\\.240\\.2\\.204:9121|10\\.240\\.2\\.245:9121|10\\.240\\.3\\.10:9121)"}[5m])) > 0
sum(increase(prometheus_target_scrapes_sample_out_of_order_total{instance=~"(10\\.240\\.0\\.5:9093|10\\.240\\.0\\.76:9093|10\\.240\\.0\\.26:9114|10\\.240\\.0\\.253:8080|10\\.240\\.0\\.94:9090|10\\.240\\.1\\.199:9090|10\\.240\\.2\\.4:9090|10\\.240\\.2\\.204:9121|10\\.240\\.2\\.245:9121|10\\.240\\.3\\.10:9121)"}[5m])) > 0
sum(increase(prometheus_treecache_zookeeper_failures_total{instance=~"(10\\.240\\.0\\.5:9093|10\\.240\\.0\\.76:9093|10\\.240\\.0\\.26:9114|10\\.240\\.0\\.253:8080|10\\.240\\.0\\.94:9090|10\\.240\\.1\\.199:9090|10\\.240\\.2\\.4:9090|10\\.240\\.2\\.204:9121|10\\.240\\.2\\.245:9121|10\\.240\\.3\\.10:9121)"}[5m])) > 0
sum(increase(prometheus_tsdb_compactions_failed_total{instance=~"(10\\.240\\.0\\.5:9093|10\\.240\\.0\\.76:9093|10\\.240\\.0\\.26:9114|10\\.240\\.0\\.253:8080|10\\.240\\.0\\.94:9090|10\\.240\\.1\\.199:9090|10\\.240\\.2\\.4:9090|10\\.240\\.2\\.204:9121|10\\.240\\.2\\.245:9121|10\\.240\\.3\\.10:9121)"}[5m])) > 0
sum(increase(prometheus_tsdb_head_series_not_found{instance=~"(10\\.240\\.0\\.5:9093|10\\.240\\.0\\.76:9093|10\\.240\\.0\\.26:9114|10\\.240\\.0\\.253:8080|10\\.240\\.0\\.94:9090|10\\.240\\.1\\.199:9090|10\\.240\\.2\\.4:9090|10\\.240\\.2\\.204:9121|10\\.240\\.2\\.245:9121|10\\.240\\.3\\.10:9121)"}[5m])) > 0
sum(increase(prometheus_tsdb_reloads_failures_total{instance=~"(10\\.240\\.0\\.5:9093|10\\.240\\.0\\.76:9093|10\\.240\\.0\\.26:9114|10\\.240\\.0\\.253:8080|10\\.240\\.0\\.94:9090|10\\.240\\.1\\.199:9090|10\\.240\\.2\\.4:9090|10\\.240\\.2\\.204:9121|10\\.240\\.2\\.245:9121|10\\.240\\.3\\.10:9121)"}[5m])) > 0
An example of how this panel looks like:
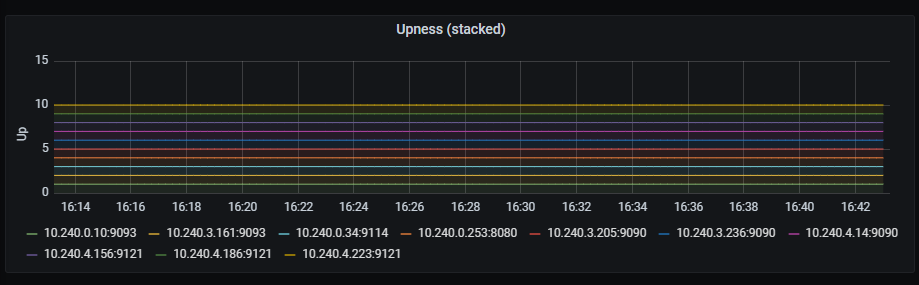
Upness (stacked)
Time series with a time bound representation of services upness. Those values are shown stacked.
The x-axis shows the time series and the y-axis shows the upness state of the different services.
The queries used to get the panel information are:
up{instance=~"(10\\.240\\.0\\.5:9093|10\\.240\\.0\\.76:9093|10\\.240\\.0\\.26:9114|10\\.240\\.0\\.253:8080|10\\.240\\.0\\.94:9090|10\\.240\\.1\\.199:9090|10\\.240\\.2\\.4:9090|10\\.240\\.2\\.204:9121|10\\.240\\.2\\.245:9121|10\\.240\\.3\\.10:9121)",job=~"kubernetes-service-endpoints"}
An example of this panel is shown below:
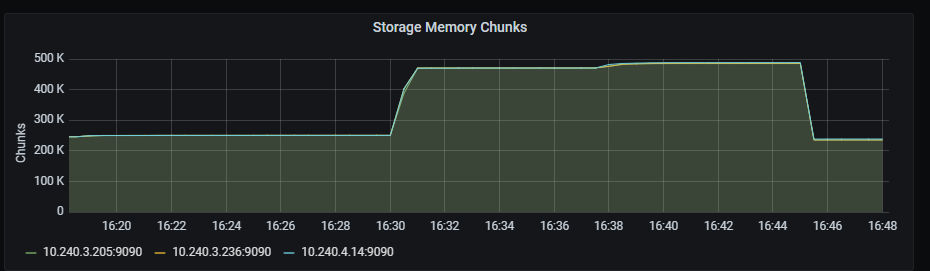
Storage memory chunks
Time series with the number of memory chunks used.
The x-axis shows the time series and the y-axis shows the number of memory chunks.
The queries used to get the panel information are:
prometheus_tsdb_head_chunks{job=~"kubernetes-service-endpoints",instance=~"(10\\.240\\.0\\.5:9093|10\\.240\\.0\\.76:9093|10\\.240\\.0\\.26:9114|10\\.240\\.0\\.253:8080|10\\.240\\.0\\.94:9090|10\\.240\\.1\\.199:9090|10\\.240\\.2\\.4:9090|10\\.240\\.2\\.204:9121|10\\.240\\.2\\.245:9121|10\\.240\\.3\\.10:9121)"}
An example of this panel is shown below:
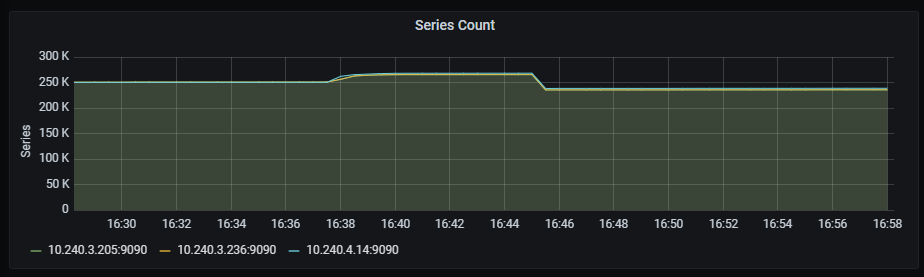
Series count
Time series with the number of tsdb series.
The x-axis shows the time series and the y-axis shows the number of series.
The queries used to get the panel information are:
prometheus_tsdb_head_series{job=~"kubernetes-service-endpoints",instance=~"(10\\.240\\.0\\.5:9093|10\\.240\\.0\\.76:9093|10\\.240\\.0\\.26:9114|10\\.240\\.0\\.253:8080|10\\.240\\.0\\.94:9090|10\\.240\\.1\\.199:9090|10\\.240\\.2\\.4:9090|10\\.240\\.2\\.204:9121|10\\.240\\.2\\.245:9121|10\\.240\\.3\\.10:9121)"}
An example of this panel is shown below:
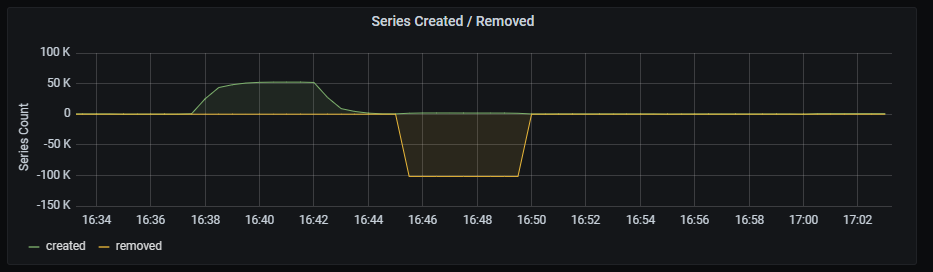
Series created/removed
Time series with the number of tsdb series created/removed.
The x-axis shows the time series and the y-axis shows the number of series created/removed, aggregated by 5 minutes.
The queries used to get the panel information are:
sum( increase(prometheus_tsdb_head_series_created_total{instance=~"(10\\.240\\.0\\.5:9093|10\\.240\\.0\\.76:9093|10\\.240\\.0\\.26:9114|10\\.240\\.0\\.253:8080|10\\.240\\.0\\.94:9090|10\\.240\\.1\\.199:9090|10\\.240\\.2\\.4:9090|10\\.240\\.2\\.204:9121|10\\.240\\.2\\.245:9121|10\\.240\\.3\\.10:9121)"}[5m]) )
sum( increase(prometheus_tsdb_head_series_removed_total{instance=~"(10\\.240\\.0\\.5:9093|10\\.240\\.0\\.76:9093|10\\.240\\.0\\.26:9114|10\\.240\\.0\\.253:8080|10\\.240\\.0\\.94:9090|10\\.240\\.1\\.199:9090|10\\.240\\.2\\.4:9090|10\\.240\\.2\\.204:9121|10\\.240\\.2\\.245:9121|10\\.240\\.3\\.10:9121)"}[5m]) )
An example of this panel is shown below:
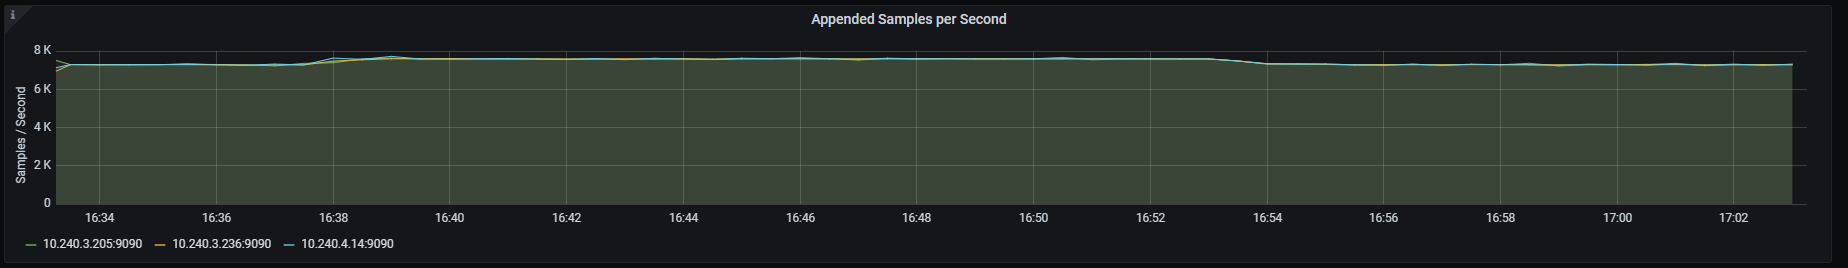
Appended samples per second
Time series with the number of metrics per second stored by Prometheus.
The x-axis shows the time series and the y-axis shows the number of metrics per second stored by Prometheus.
The queries used to get the panel information are:
rate(prometheus_tsdb_head_samples_appended_total{job=~"kubernetes-service-endpoints",instance=~"(10\\.240\\.0\\.5:9093|10\\.240\\.0\\.76:9093|10\\.240\\.0\\.26:9114|10\\.240\\.0\\.253:8080|10\\.240\\.0\\.94:9090|10\\.240\\.1\\.199:9090|10\\.240\\.2\\.4:9090|10\\.240\\.2\\.204:9121|10\\.240\\.2\\.245:9121|10\\.240\\.3\\.10:9121)"}[1m])
An example of this panel is shown below:
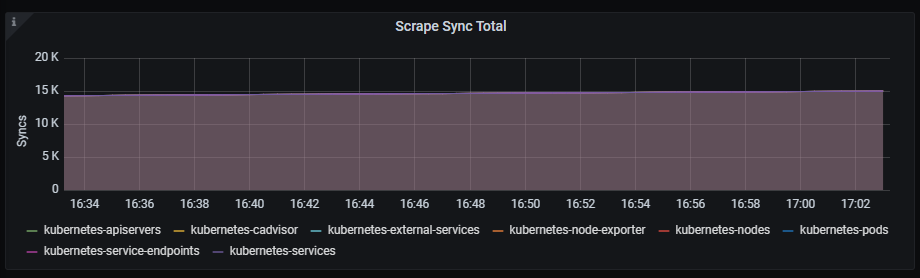
Scrape Sync total
Time series with the total number of syncs that were executed on a scrape pool.
The x-axis shows the time series and the y-axis shows the total number of syncs that were executed on a scrape pool.
The queries used to get the panel information are:
sum(prometheus_target_scrape_pool_sync_total{job=~"kubernetes-service-endpoints",instance=~"(10\\.240\\.0\\.5:9093|10\\.240\\.0\\.76:9093|10\\.240\\.0\\.26:9114|10\\.240\\.0\\.253:8080|10\\.240\\.0\\.94:9090|10\\.240\\.1\\.199:9090|10\\.240\\.2\\.4:9090|10\\.240\\.2\\.204:9121|10\\.240\\.2\\.245:9121|10\\.240\\.3\\.10:9121)"}) by (scrape_job)
An example of this panel is shown below:
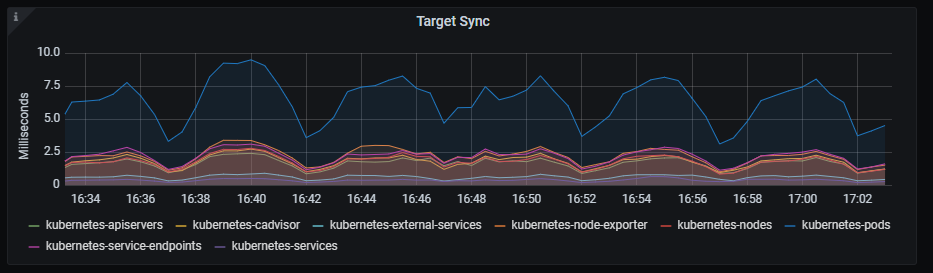
Target sync
Time series with the interval to sync the scrape pool.
The x-axis shows the time series and the y-axis shows the interval to sync the scrape pool.
The queries used to get the panel information are:
sum(rate(prometheus_target_sync_length_seconds_sum{job=~"kubernetes-service-endpoints",instance=~"(10\\.240\\.0\\.5:9093|10\\.240\\.0\\.76:9093|10\\.240\\.0\\.26:9114|10\\.240\\.0\\.253:8080|10\\.240\\.0\\.94:9090|10\\.240\\.1\\.199:9090|10\\.240\\.2\\.4:9090|10\\.240\\.2\\.204:9121|10\\.240\\.2\\.245:9121|10\\.240\\.3\\.10:9121)"}[2m])) by (scrape_job) * 1000
An example of this panel is shown below:
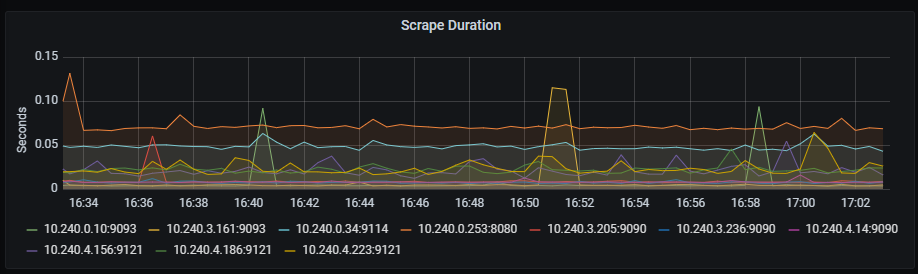
Scrape duration
Time series with the scrape duration in seconds.
The x-axis shows the time series and the y-axis shows the scrape duration in seconds.
The queries used to get the panel information are:
scrape_duration_seconds{instance=~"(10\\.240\\.0\\.5:9093|10\\.240\\.0\\.76:9093|10\\.240\\.0\\.26:9114|10\\.240\\.0\\.253:8080|10\\.240\\.0\\.94:9090|10\\.240\\.1\\.199:9090|10\\.240\\.2\\.4:9090|10\\.240\\.2\\.204:9121|10\\.240\\.2\\.245:9121|10\\.240\\.3\\.10:9121)"}
An example of this panel is shown below:
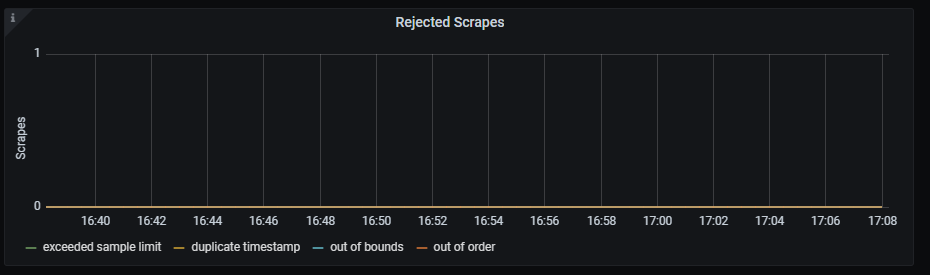
Rejected scrapes
Time series with the rejected scrapes.
The x-axis shows the time series and the y-axis shows the rejected scrapes for several reasons:
- Total number of scrapes that hit the sample limit and were rejected.
- Total number of scrapes samples duplicated.
- Total number of scrapes samples out of bounds.
- Total number of scrapes samples out of order.
The queries used to get the panel information are:
sum(prometheus_target_scrapes_exceeded_sample_limit_total{job=~"kubernetes-service-endpoints",instance=~"(10\\.240\\.0\\.5:9093|10\\.240\\.0\\.76:9093|10\\.240\\.0\\.26:9114|10\\.240\\.0\\.253:8080|10\\.240\\.0\\.94:9090|10\\.240\\.1\\.199:9090|10\\.240\\.2\\.4:9090|10\\.240\\.2\\.204:9121|10\\.240\\.2\\.245:9121|10\\.240\\.3\\.10:9121)"})
sum(prometheus_target_scrapes_sample_duplicate_timestamp_total{job=~"kubernetes-service-endpoints",instance=~"(10\\.240\\.0\\.5:9093|10\\.240\\.0\\.76:9093|10\\.240\\.0\\.26:9114|10\\.240\\.0\\.253:8080|10\\.240\\.0\\.94:9090|10\\.240\\.1\\.199:9090|10\\.240\\.2\\.4:9090|10\\.240\\.2\\.204:9121|10\\.240\\.2\\.245:9121|10\\.240\\.3\\.10:9121)"})
sum(prometheus_target_scrapes_sample_out_of_bounds_total{job=~"kubernetes-service-endpoints",instance=~"(10\\.240\\.0\\.5:9093|10\\.240\\.0\\.76:9093|10\\.240\\.0\\.26:9114|10\\.240\\.0\\.253:8080|10\\.240\\.0\\.94:9090|10\\.240\\.1\\.199:9090|10\\.240\\.2\\.4:9090|10\\.240\\.2\\.204:9121|10\\.240\\.2\\.245:9121|10\\.240\\.3\\.10:9121)"})
sum(prometheus_target_scrapes_sample_out_of_order_total{job=~"kubernetes-service-endpoints",instance=~"(10\\.240\\.0\\.5:9093|10\\.240\\.0\\.76:9093|10\\.240\\.0\\.26:9114|10\\.240\\.0\\.253:8080|10\\.240\\.0\\.94:9090|10\\.240\\.1\\.199:9090|10\\.240\\.2\\.4:9090|10\\.240\\.2\\.204:9121|10\\.240\\.2\\.245:9121|10\\.240\\.3\\.10:9121)"})
An example of this panel is shown below:
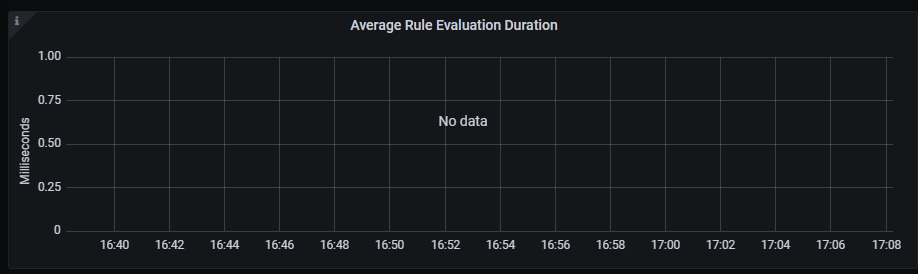
Average rule evaluation duration
Time series with the average duration of rule group evaluations, aggregated by five minutes.
The x-axis shows the time series and the y-axis shows the average duration of rule group evaluations.
The queries used to get the panel information are:
1000 * rate(prometheus_evaluator_duration_seconds_sum{job=~"kubernetes-service-endpoints", instance=~"(10\\.240\\.0\\.5:9093|10\\.240\\.0\\.76:9093|10\\.240\\.0\\.26:9114|10\\.240\\.0\\.253:8080|10\\.240\\.0\\.94:9090|10\\.240\\.1\\.199:9090|10\\.240\\.2\\.4:9090|10\\.240\\.2\\.204:9121|10\\.240\\.2\\.245:9121|10\\.240\\.3\\.10:9121)"}[5m]) /
rate(prometheus_evaluator_duration_seconds_count{job=~"kubernetes-service-endpoints", instance=~"(10\\.240\\.0\\.5:9093|10\\.240\\.0\\.76:9093|10\\.240\\.0\\.26:9114|10\\.240\\.0\\.253:8080|10\\.240\\.0\\.94:9090|10\\.240\\.1\\.199:9090|10\\.240\\.2\\.4:9090|10\\.240\\.2\\.204:9121|10\\.240\\.2\\.245:9121|10\\.240\\.3\\.10:9121)"}[5m])
An example of this panel is shown below:
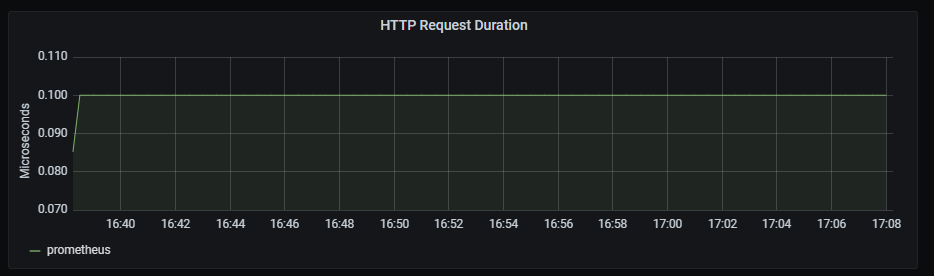
HTTP request duration
Time series with the HTTP request duration, aggregated by one minute.
The x-axis shows the time series and the y-axis shows the http request duration.
The queries used to get the panel information are:
sum(rate(http_request_duration_microseconds_count{job=~"kubernetes-service-endpoints",instance=~"(10\\.240\\.0\\.5:9093|10\\.240\\.0\\.76:9093|10\\.240\\.0\\.26:9114|10\\.240\\.0\\.253:8080|10\\.240\\.0\\.94:9090|10\\.240\\.1\\.199:9090|10\\.240\\.2\\.4:9090|10\\.240\\.2\\.204:9121|10\\.240\\.2\\.245:9121|10\\.240\\.3\\.10:9121)"}[1m])) by (handler) > 0
An example of this panel is shown below:
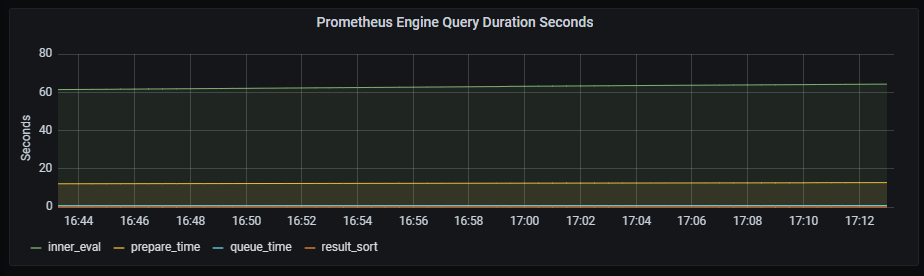
Prometheus engine query duration seconds
Time series with the engine query duration in seconds.
The x-axis shows the time series and the y-axis shows the engine query duration.
The queries used to get the panel information are:
sum(prometheus_engine_query_duration_seconds_sum{job=~"kubernetes-service-endpoints",instance=~"(10\\.240\\.0\\.5:9093|10\\.240\\.0\\.76:9093|10\\.240\\.0\\.26:9114|10\\.240\\.0\\.253:8080|10\\.240\\.0\\.94:9090|10\\.240\\.1\\.199:9090|10\\.240\\.2\\.4:9090|10\\.240\\.2\\.204:9121|10\\.240\\.2\\.245:9121|10\\.240\\.3\\.10:9121)"}) by (slice)
An example of this panel is shown below:
Rule evaluator iterations
Time series with the number of scheduled rule group evaluations, whether executed, missed or skipped.
The x-axis shows the time series and the y-axis shows the number of scheduled rule group evaluations.
The queries used to get the panel information are:
sum(rate(prometheus_evaluator_iterations_total{job=~"kubernetes-service-endpoints", instance=~"(10\\.240\\.0\\.5:9093|10\\.240\\.0\\.76:9093|10\\.240\\.0\\.26:9114|10\\.240\\.0\\.253:8080|10\\.240\\.0\\.94:9090|10\\.240\\.1\\.199:9090|10\\.240\\.2\\.4:9090|10\\.240\\.2\\.204:9121|10\\.240\\.2\\.245:9121|10\\.240\\.3\\.10:9121)"}[5m]))
sum(rate(prometheus_evaluator_iterations_missed_total{job=~"kubernetes-service-endpoints", instance=~"(10\\.240\\.0\\.5:9093|10\\.240\\.0\\.76:9093|10\\.240\\.0\\.26:9114|10\\.240\\.0\\.253:8080|10\\.240\\.0\\.94:9090|10\\.240\\.1\\.199:9090|10\\.240\\.2\\.4:9090|10\\.240\\.2\\.204:9121|10\\.240\\.2\\.245:9121|10\\.240\\.3\\.10:9121)"}[5m]))
sum(rate(prometheus_evaluator_iterations_skipped_total{job=~"kubernetes-service-endpoints", instance=~"(10\\.240\\.0\\.5:9093|10\\.240\\.0\\.76:9093|10\\.240\\.0\\.26:9114|10\\.240\\.0\\.253:8080|10\\.240\\.0\\.94:9090|10\\.240\\.1\\.199:9090|10\\.240\\.2\\.4:9090|10\\.240\\.2\\.204:9121|10\\.240\\.2\\.245:9121|10\\.240\\.3\\.10:9121)"}[5m]))
An example of this panel is shown below:
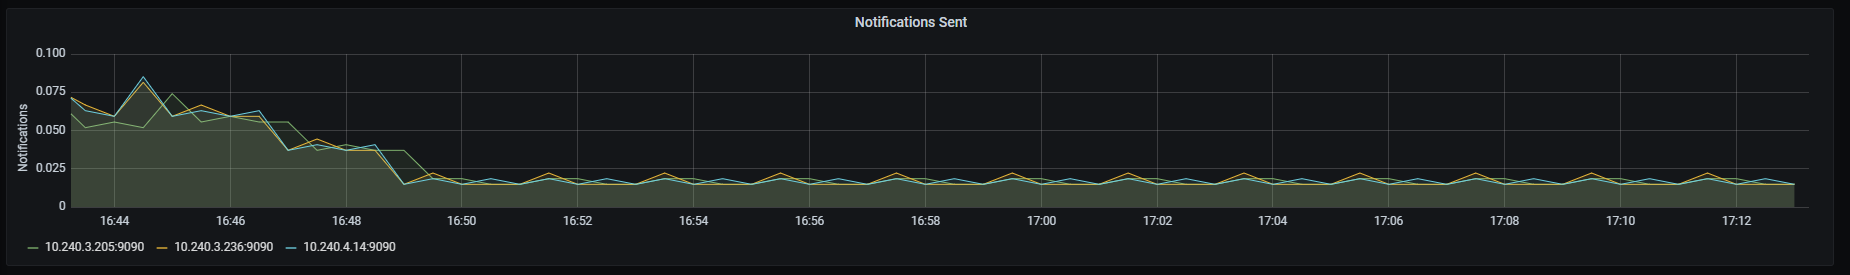
Notifications sent
Time series with the rate of sent notifications, aggregated by 5 minutes.
The x-axis shows the time series and the y-axis shows the rate of sent notifications.
The queries used to get the panel information are:
rate(prometheus_notifications_sent_total[5m])
An example of this panel is shown below:
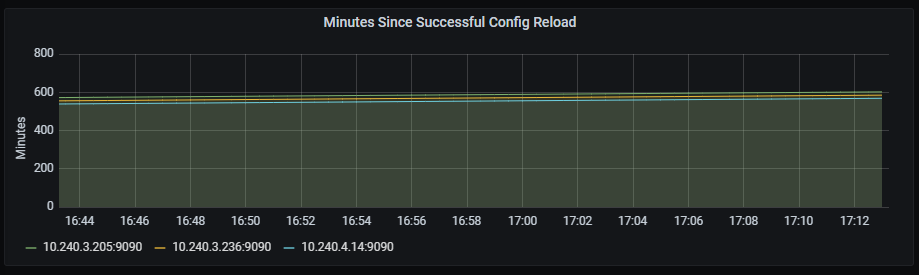
Minutes since successful config reload
Time series with the number of minutes since the last successful config reload.
The x-axis shows the time series and the y-axis shows the number of minutes since the last successful reload.
The queries used to get the panel information are:
(time() - prometheus_config_last_reload_success_timestamp_seconds{job=~"kubernetes-service-endpoints",instance=~"(10\\.240\\.0\\.5:9093|10\\.240\\.0\\.76:9093|10\\.240\\.0\\.26:9114|10\\.240\\.0\\.253:8080|10\\.240\\.0\\.94:9090|10\\.240\\.1\\.199:9090|10\\.240\\.2\\.4:9090|10\\.240\\.2\\.204:9121|10\\.240\\.2\\.245:9121|10\\.240\\.3\\.10:9121)"}) / 60
An example of this panel is shown below:
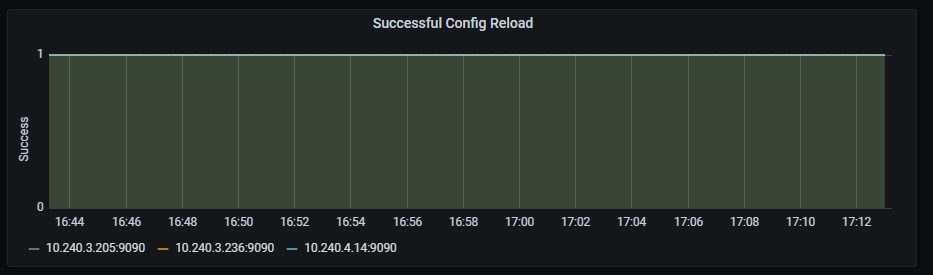
Successful config reload
Time series with the last successful reload.
The x-axis shows the time series and the y-axis shows the last successful reload.
The queries used to get the panel information are:
prometheus_config_last_reload_successful{job=~"kubernetes-service-endpoints",instance=~"(10\\.240\\.0\\.5:9093|10\\.240\\.0\\.76:9093|10\\.240\\.0\\.26:9114|10\\.240\\.0\\.253:8080|10\\.240\\.0\\.94:9090|10\\.240\\.1\\.199:9090|10\\.240\\.2\\.4:9090|10\\.240\\.2\\.204:9121|10\\.240\\.2\\.245:9121|10\\.240\\.3\\.10:9121)"}
An example of this panel is shown below:
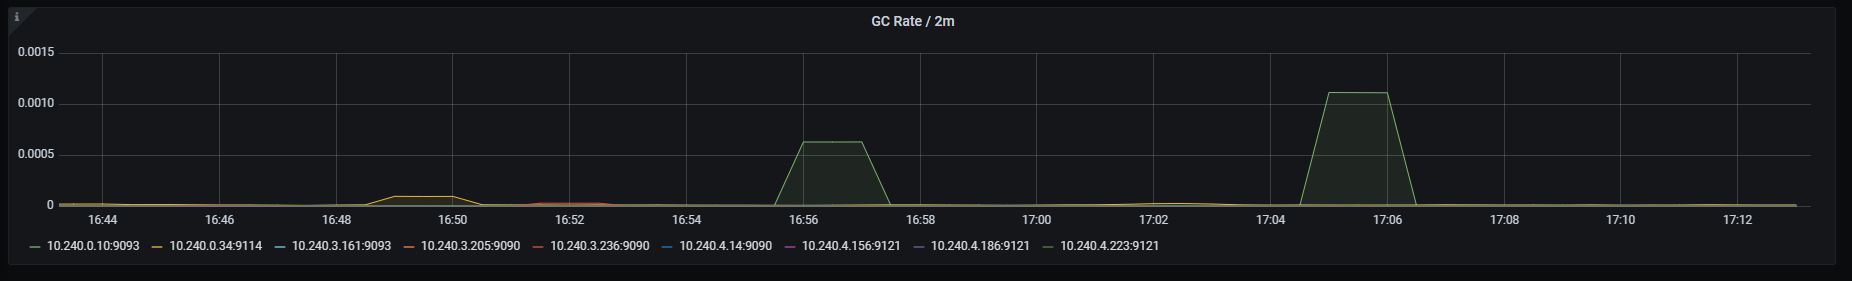
GC rate
Time series with the GC invocation durations rate, aggregated by two minutes.
The x-axis shows the time series and the y-axis shows the GC invocation durations rate.
The queries used to get the panel information are:
sum(rate(go_gc_duration_seconds_sum{instance=~"(10\\.240\\.0\\.5:9093|10\\.240\\.0\\.76:9093|10\\.240\\.0\\.26:9114|10\\.240\\.0\\.253:8080|10\\.240\\.0\\.94:9090|10\\.240\\.1\\.199:9090|10\\.240\\.2\\.4:9090|10\\.240\\.2\\.204:9121|10\\.240\\.2\\.245:9121|10\\.240\\.3\\.10:9121)",job=~"kubernetes-service-endpoints"}[2m])) by (instance)
An example of this panel is shown below: