Categories:
Fluent bit dashboard
Information provided by Fluent bit dashboard
Introduction
Fluent bit dashboard monitors system metrics related to fluent bit.
The available metrics are defined in the following sections.
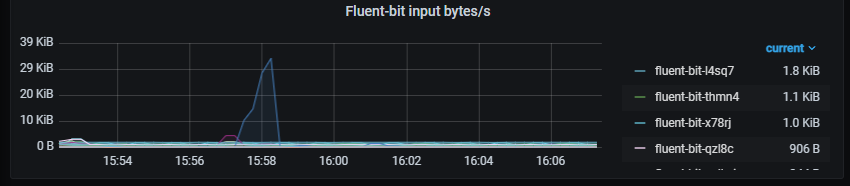
Input bytes
Input bytes rate, aggregated by one minute.
Metrics:
rate(fluentbit_input_bytes_total[1m])
Graph visual
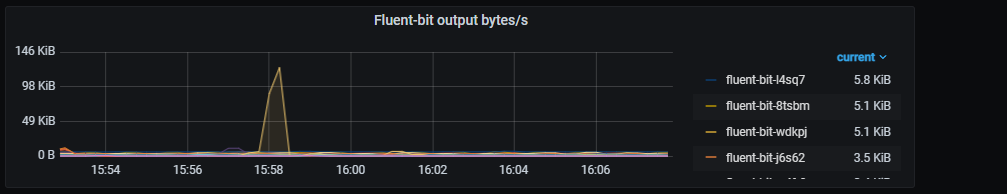
Output bytes
Output bytes rate, aggregated by one minute.
Metrics:
rate(fluentbit_output_proc_bytes_total[1m])
Graph visual
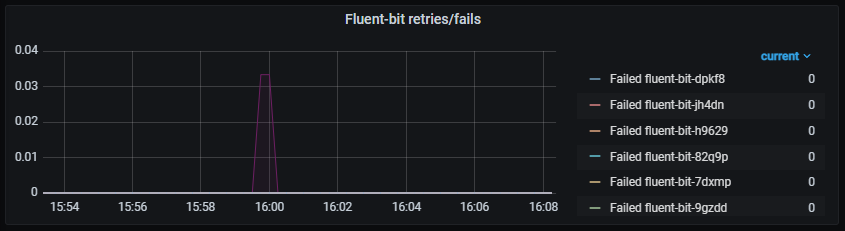
Retries/fails
Rate of retries and fails, aggregated by one minute
Metrics:
It includes two metrics:
- Retries rate
rate(fluentbit_output_retries_total[1m])
- Fails rate
rate(fluentbit_output_retries_failed_total[1m])
Graph visual
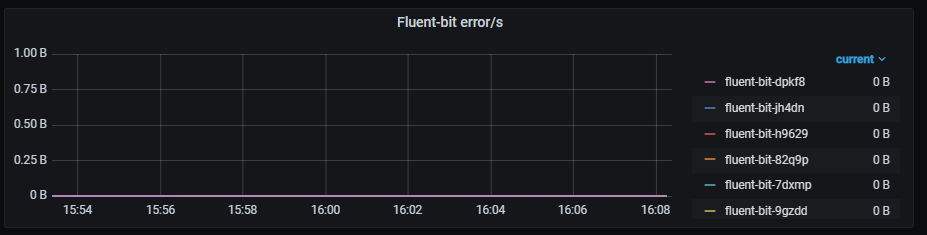
Errors
Rate of output errors, aggregated by one minute.
Metrics:
rate(fluentbit_output_errors_total[1m])
Graph visual
Last modified January 15, 2025: feat: Documentation Assistant and ATRIA for Linkin Park release #AURA-26619 [RTM] (409958c0)