Categories:
Alertmanager dashboard
Information provided by Alertmanager dashboards
Panels
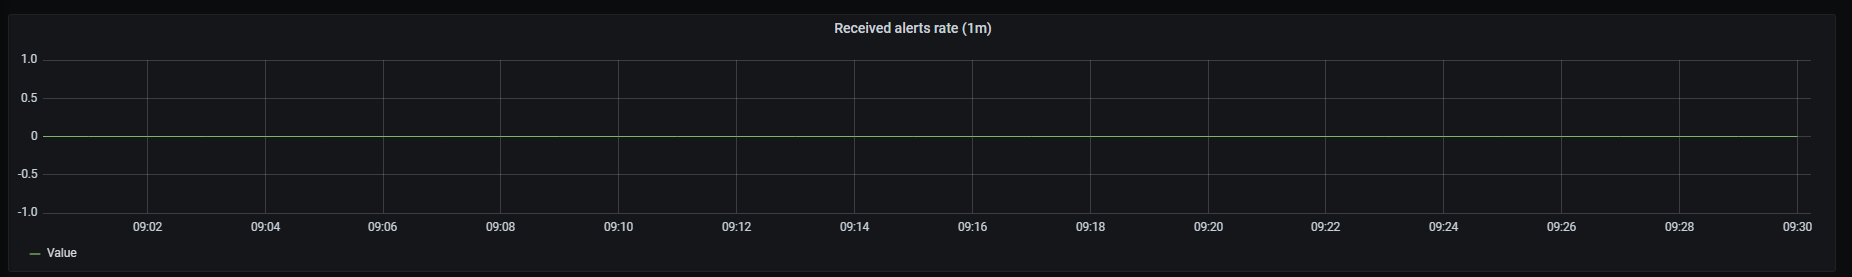
Received alerts rate
It shows a time series with the received alerts rate aggregated by one minute.
The x-axis shows the time series and the y-axis shows received alerts rate.
The queries used to get the panel information are:
sum(rate(prometheus_notifications_alertmanagers_discovered[1m])) by(status)
An example of this panel is shown below:
The available metrics are defined in the following sections.
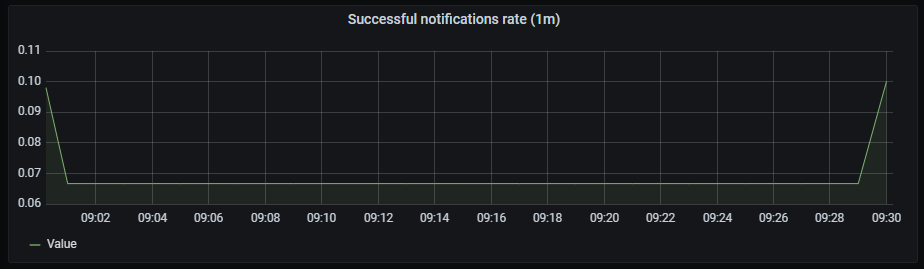
Successful notification rate
It shows a time series with the successful notifications rate aggregated by one minute.
The x-axis shows the time series and the y-axis shows the successful notifications rate.
The queries used to get the panel information are:
sum(rate(prometheus_notifications_sent_total[1m])) by(integration)
An example of this panel is shown below:
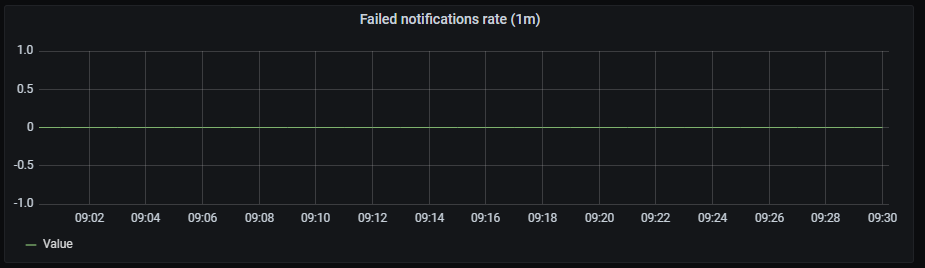
Failed notifications rate
It shows a time series with the failed notifications rate aggregated by one minute.
The x-axis shows the time series and the y-axis shows the failed notifications rate.
The queries used to get panel information are:
sum(rate(prometheus_notifications_errors_total[1m])) by(integration)
An example of this panel is shown below:
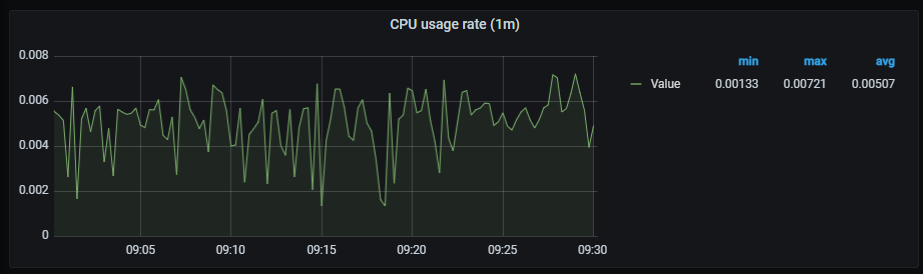
CPU usage rate
It shows a time series with the CPU usage rate aggregated by one minute. It also shows the current minimum, maximum and average cpu consumption of alertmanager.
The x-axis shows the time series and the y-axis shows the CPU usage rate.
The queries used to get panel information are:
sum(rate(container_cpu_usage_seconds_total{container="alertmanager"}[1m])) by (pod_name)
An example of this panel is shown below:
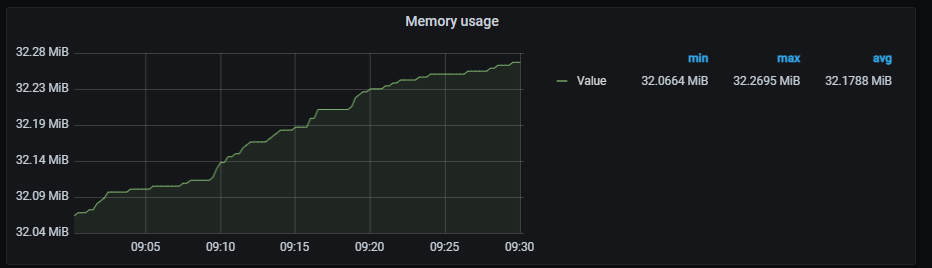
Memory usage
It shows a time series with the memory usage. It also shows the current minimum, maximum and average memory consumption of alertmanager.
The x-axis shows the time series and the y-axis shows the memory usage.
The queries used to get panel information are:
sum (container_memory_working_set_bytes{container="alertmanager"}) by (pod_name)
An example of this panel is shown below:
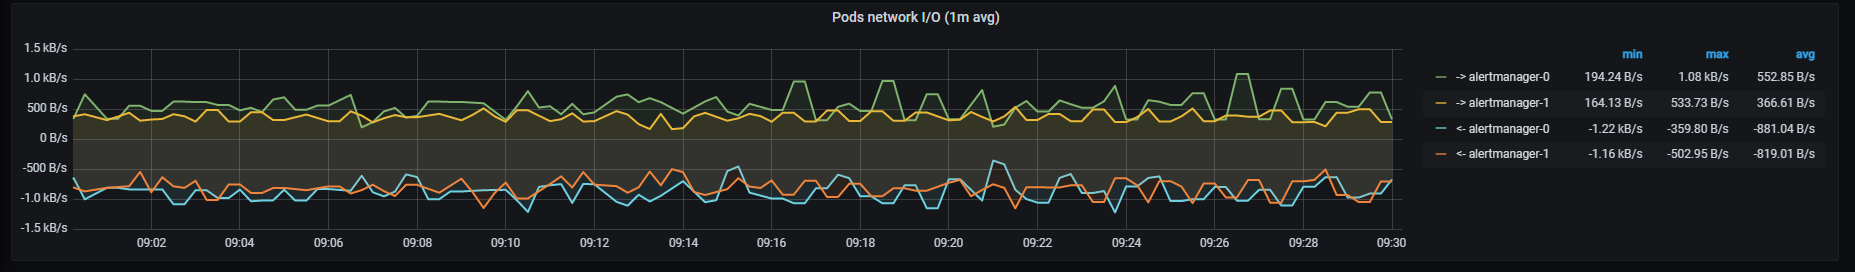
Pods network I/O
It shows a time series with the network I/O average aggregated by one minute. It also shows the current minimum, maximum and average network I/O.
The x-axis shows the time series and the y-axis shows the network usage.
The queries used to get panel information are:
sum (rate (container_network_receive_bytes_total{pod!="",pod=~"alertmanager.*"}[1m])) by (pod)
- sum (rate (container_network_transmit_bytes_total{pod!="",pod=~"alertmanager.*"}[1m])) by (pod)
An example of this panel is shown below: