Categories:
Kubernetes storage monitoring dashboard
Information provided by Kubernetes storage monitoring dashboard
Introduction
Kubernetes storage monitoring dashboard monitors storage related metrics.
The available metrics are defined in the following sections.
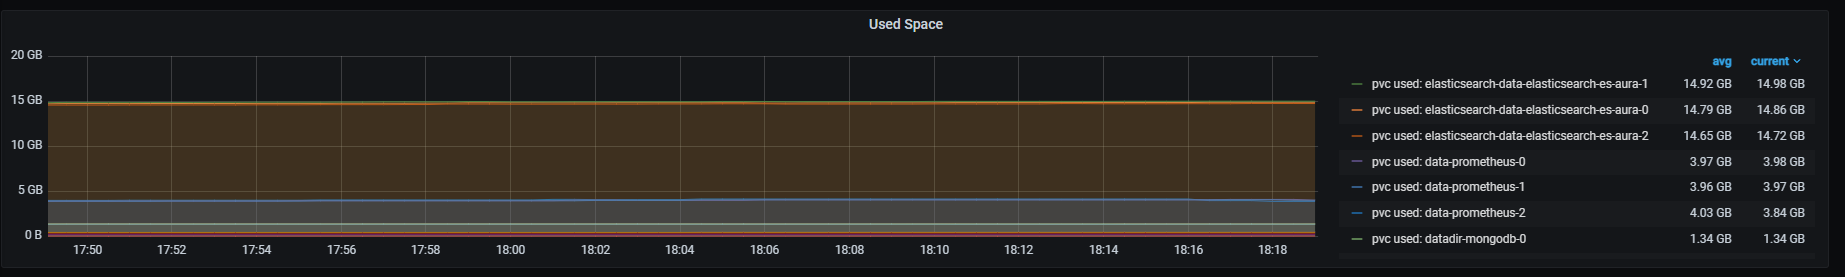
Used space
Kubelets volumes and container filesystems data usage in bytes.
Metrics:
It includes two metrics:
- Kubelet volumes used bytes
kubelet_volume_stats_used_bytes{kubernetes_io_hostname=~"^.*$",agentpool=~".*"}
- Container filesystem usage in bytes
container_fs_usage_bytes{image!="",kubernetes_io_hostname=~"^.*$",agentpool=~".*"}
Graph visual
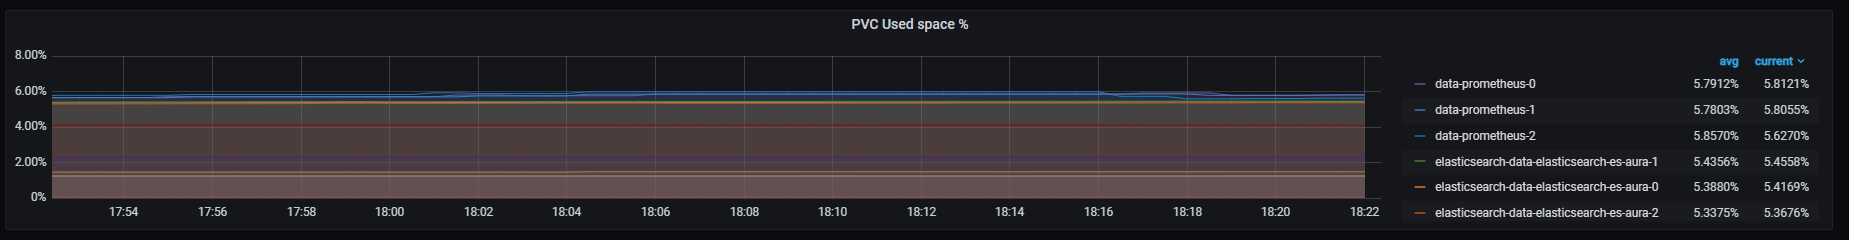
PVC used space %
PersistentVolumeClaim used space percent.
Metrics:
(kubelet_volume_stats_used_bytes{kubernetes_io_hostname=~"^.*$",agentpool=~".*",persistentvolumeclaim=~"(data-prometheus-0|data-prometheus-1|data-prometheus-2|datadir-mongodb-0|datadir-mongodb-1|datadir-mongodb-2|elasticsearch-data-elasticsearch-es-aura-0|elasticsearch-data-elasticsearch-es-aura-1|elasticsearch-data-elasticsearch-es-aura-2|grafana-grafana-0|redis-data-redis-0|redis-data-redis-1|redis-data-redis-2|store-thanos-store-gateway-0|store-thanos-store-gateway-1)"} / kubelet_volume_stats_capacity_bytes{kubernetes_io_hostname=~"^.*$",agentpool=~".*",persistentvolumeclaim=~"(data-prometheus-0|data-prometheus-1|data-prometheus-2|datadir-mongodb-0|datadir-mongodb-1|datadir-mongodb-2|elasticsearch-data-elasticsearch-es-aura-0|elasticsearch-data-elasticsearch-es-aura-1|elasticsearch-data-elasticsearch-es-aura-2|grafana-grafana-0|redis-data-redis-0|redis-data-redis-1|redis-data-redis-2|store-thanos-store-gateway-0|store-thanos-store-gateway-1)"})
Graph visual
Local used space %
Containers assigned space usage percentage.
Metrics:
(container_fs_usage_bytes{image!="",kubernetes_io_hostname=~"^.*$",agentpool=~".*"} / container_fs_limit_bytes{image!="",kubernetes_io_hostname=~"^.*$",agentpool=~".*"})
Graph visual
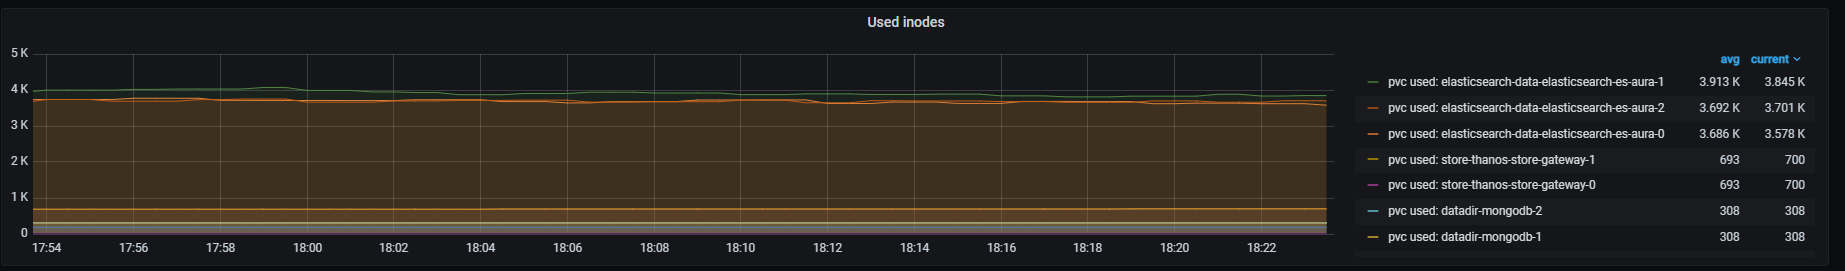
Used inodes
Kubelet PersistentVolumeClaim volumes total used inodes.
Metrics:
kubelet_volume_stats_inodes_used{kubernetes_io_hostname=~"^.*$",agentpool=~".*",persistentvolumeclaim=~"(data-prometheus-0|data-prometheus-1|data-prometheus-2|datadir-mongodb-0|datadir-mongodb-1|datadir-mongodb-2|elasticsearch-data-elasticsearch-es-aura-0|elasticsearch-data-elasticsearch-es-aura-1|elasticsearch-data-elasticsearch-es-aura-2|grafana-grafana-0|redis-data-redis-0|redis-data-redis-1|redis-data-redis-2|store-thanos-store-gateway-0|store-thanos-store-gateway-1)"}
Graph visual
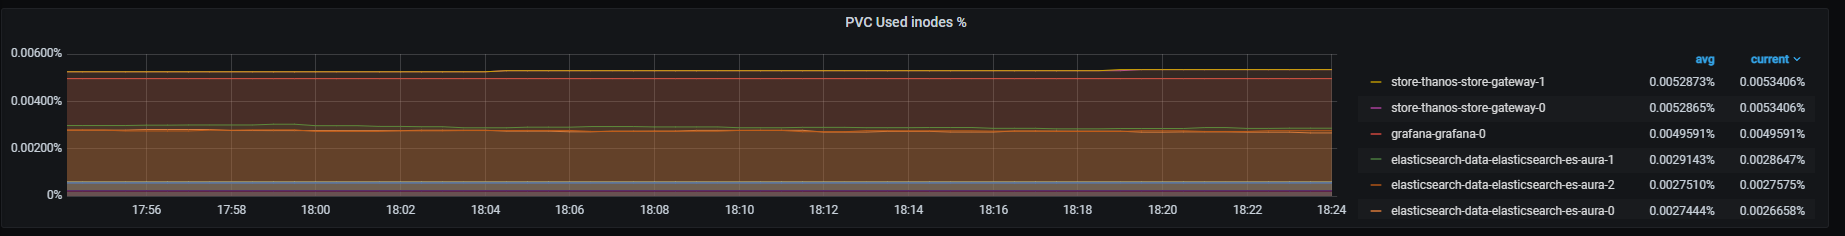
PVC used inodes %
Kubelet PersistentVolumeClaim volumes inodes usage percentage.
Metrics:
(kubelet_volume_stats_inodes_used{kubernetes_io_hostname=~"^.*$",agentpool=~".*",persistentvolumeclaim=~"(data-prometheus-0|data-prometheus-1|data-prometheus-2|datadir-mongodb-0|datadir-mongodb-1|datadir-mongodb-2|elasticsearch-data-elasticsearch-es-aura-0|elasticsearch-data-elasticsearch-es-aura-1|elasticsearch-data-elasticsearch-es-aura-2|grafana-grafana-0|redis-data-redis-0|redis-data-redis-1|redis-data-redis-2|store-thanos-store-gateway-0|store-thanos-store-gateway-1)"} / kubelet_volume_stats_inodes{kubernetes_io_hostname=~"^.*$",agentpool=~".*",persistentvolumeclaim=~"(data-prometheus-0|data-prometheus-1|data-prometheus-2|datadir-mongodb-0|datadir-mongodb-1|datadir-mongodb-2|elasticsearch-data-elasticsearch-es-aura-0|elasticsearch-data-elasticsearch-es-aura-1|elasticsearch-data-elasticsearch-es-aura-2|grafana-grafana-0|redis-data-redis-0|redis-data-redis-1|redis-data-redis-2|store-thanos-store-gateway-0|store-thanos-store-gateway-1)"})
Graph visual
Last modified January 15, 2025: feat: Documentation Assistant and ATRIA for Linkin Park release #AURA-26619 [RTM] (409958c0)