Categories:
Kubernetes cluster monitoring dashboard
Information provided by Kubernetes cluster monitoring dashboard
Introduction
Kubernetes cluster monitoring dashboard monitors multiple systems and networks related data from Kubernetes clusters.
The available metrics are defined in the following sections.
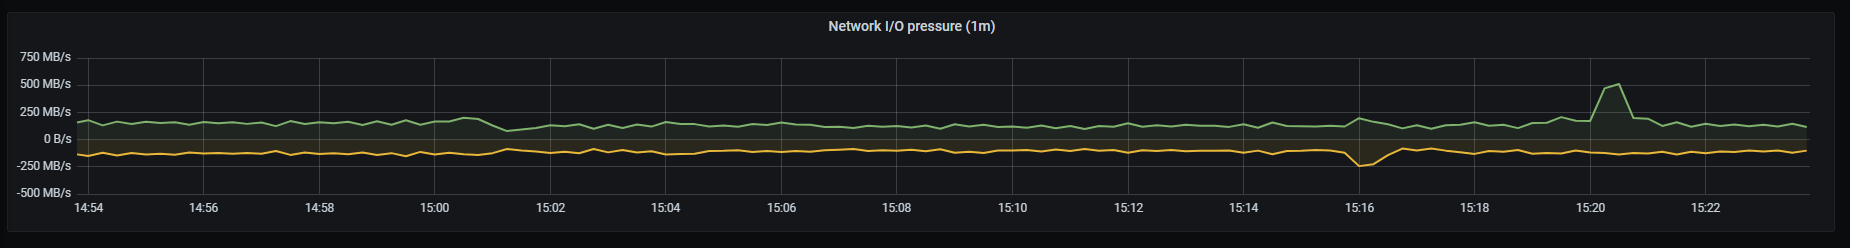
Network I/O pressure graph
Rate of total received/sent data on all cluster containers, in bytes and aggregated by one minute.
Metrics:
It includes two metrics:
- Received bytes
sum (rate (container_network_receive_bytes_total{kubernetes_io_hostname=~"^.*$",agentpool=~".*"}[1m]))
- Sent bytes (negative value)
- sum (rate (container_network_transmit_bytes_total{kubernetes_io_hostname=~"^.*$",agentpool=~".*"}[1m]))
Graph visual
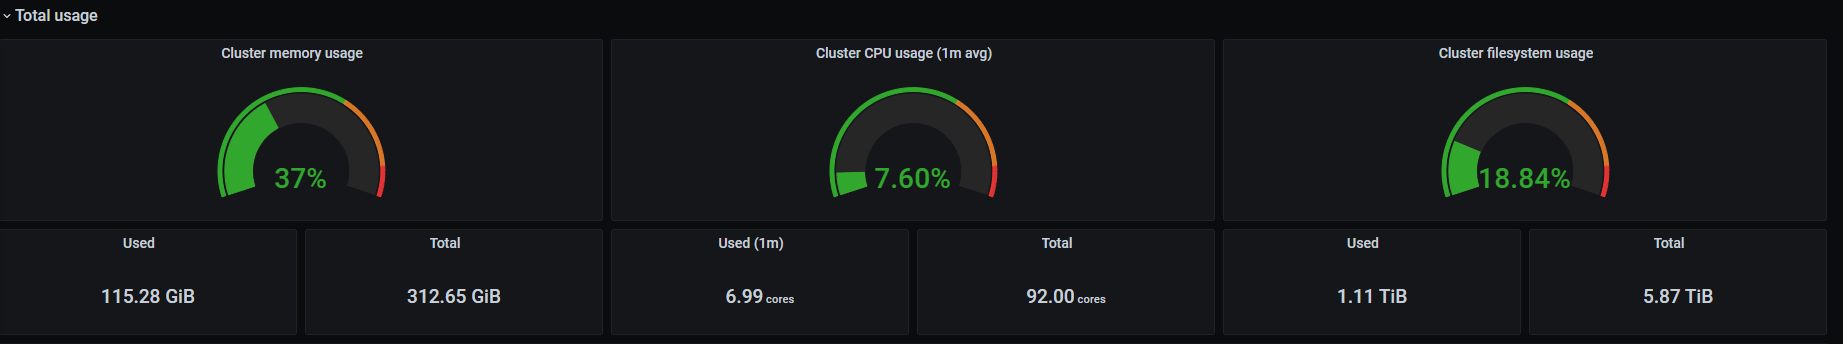
Total usage
Graphs with different system parameters usage.
Cluster memory usage
It is composed by three graphs:
- Memory usage, showing percentage of used memory
- Used, showing used memory
- Total, showing total memory
Metrics:
It includes three metrics:
- Memory usage percentage
sum (container_memory_working_set_bytes{id="/",kubernetes_io_hostname=~"^.*$",agentpool=~".*"}) /
sum (machine_memory_bytes{kubernetes_io_hostname=~"^.*$",agentpool=~".*"}) * 100
- Used memory
sum (container_memory_working_set_bytes{id="/",kubernetes_io_hostname=~"^.*$",agentpool=~".*"})
- Total cluster memory
sum (machine_memory_bytes{kubernetes_io_hostname=~"^.*$",agentpool=~".*"})
Cluster CPU usage
It is composed by three graphs:
- CPU usage, showing percentage of used CPU cores, aggregated by one minute
- Used, showing used CPU cores, aggregated by one minute
- Total, showing total CPU cores
Metrics:
It includes three metrics:
- CPU usage percentage
sum (rate (container_cpu_usage_seconds_total{id="/",kubernetes_io_hostname=~"^.*$",agentpool=~".*"}[1m])) /
sum (machine_cpu_cores{kubernetes_io_hostname=~"^.*$",agentpool=~".*"}) * 100
- Used CPUs
sum (rate (container_cpu_usage_seconds_total{id="/",kubernetes_io_hostname=~"^.*$",agentpool=~".*"}[1m]))
- Total cluster CPUs
sum (machine_cpu_cores{kubernetes_io_hostname=~"^.*$",agentpool=~".*"})
Cluster filesystem usage
It is composed by three graphs:
- Filesystem usage, showing percentage of used filesystem space
- Used, showing used filesystem space
- Total, showing total filesystem space
Metrics:
It includes three metrics:
- Filesystem usage
sum (container_fs_usage_bytes{device=~"^/dev/.*$",id="/",kubernetes_io_hostname=~"^.*$",agentpool=~".*"}) /
sum (container_fs_limit_bytes{device=~"^/dev/.*$",id="/",kubernetes_io_hostname=~"^.*$",agentpool=~".*"}) * 100
- Used
sum (container_fs_usage_bytes{device=~"^/dev/.*$",id="/",kubernetes_io_hostname=~"^.*$",agentpool=~".*"})
- Total
sum (container_fs_limit_bytes{device=~"^/dev/.*$",id="/",kubernetes_io_hostname=~"^.*$",agentpool=~".*"})
Graph visual
Pods CPU usage
CPU usage rate, classified by pod and aggregated by one minute.
Metrics:
sum (rate (container_cpu_usage_seconds_total{image!="",name=~"^k8s_.*",kubernetes_io_hostname=~"^.*$",agentpool=~".*"}[1m])) by (pod_name)
Graph visual
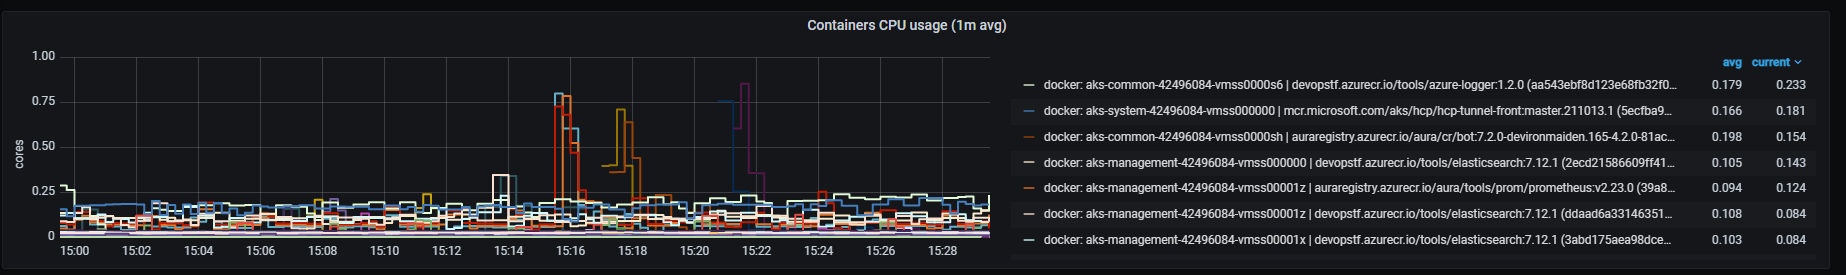
Containers CPU usage
CPU usage rate, classified by container and aggregated by one minute.
Metrics:
It includes two metrics:
- Containers with “k8s_”
sum (rate (container_cpu_usage_seconds_total{image!="",name=~"^k8s_.*",kubernetes_io_hostname=~"^.*$",agentpool=~".*"}[1m])) by (pod_name)
- Containers without “k8s_”
sum (rate (container_cpu_usage_seconds_total{image!="",name!~"^k8s_.*",kubernetes_io_hostname=~"^.*$",agentpool=~".*"}[1m])) by (kubernetes_io_hostname, name, image)
Graph visual
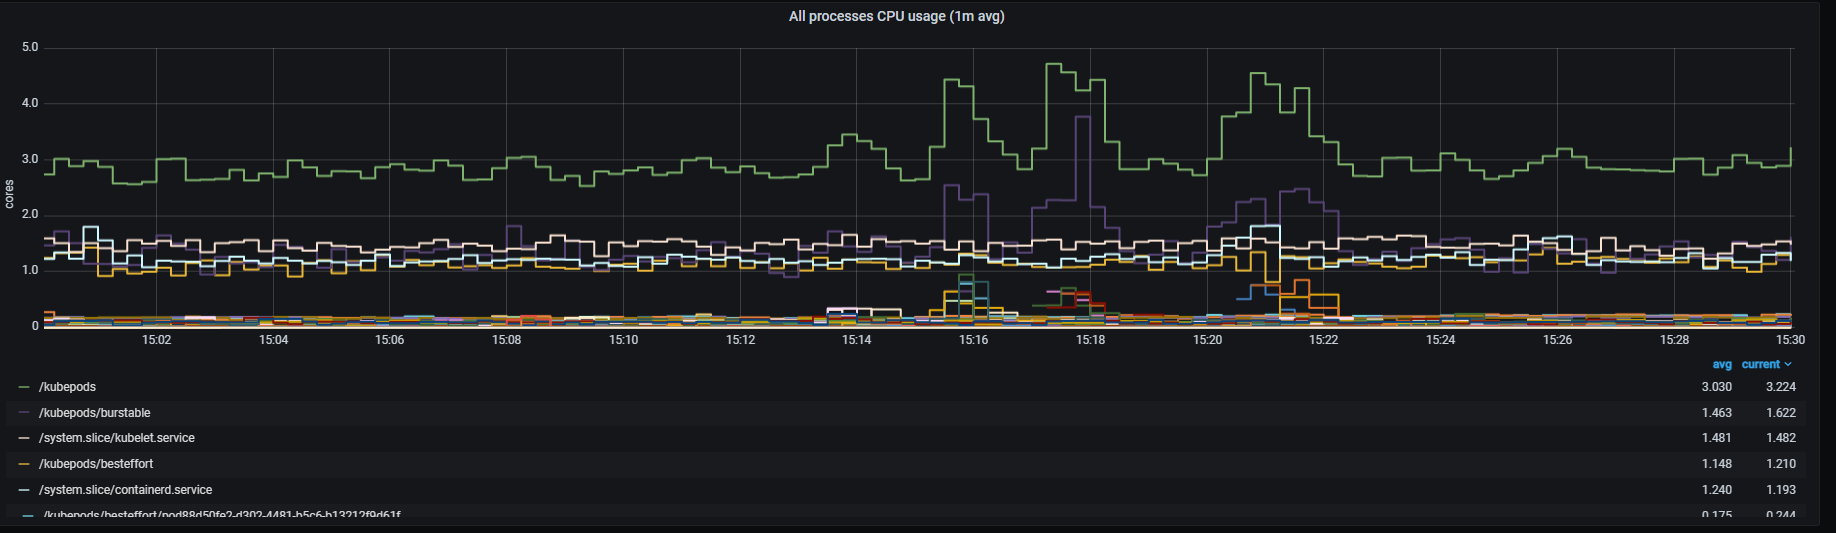
All processes CPU usage
Total CPU usage rate, aggregated by one minute.
Metrics:
sum (rate (container_cpu_usage_seconds_total{id!="/",kubernetes_io_hostname=~"^.*$",agentpool=~".*"}[1m])) by (id)
Graph visual
Pods memory usage
Memory usage, classified by pod.
Metrics:
sum (container_memory_working_set_bytes{image!="",name=~"^k8s_.*",kubernetes_io_hostname=~"^.*$",agentpool=~".*"}) by (pod_name)
Graph visual
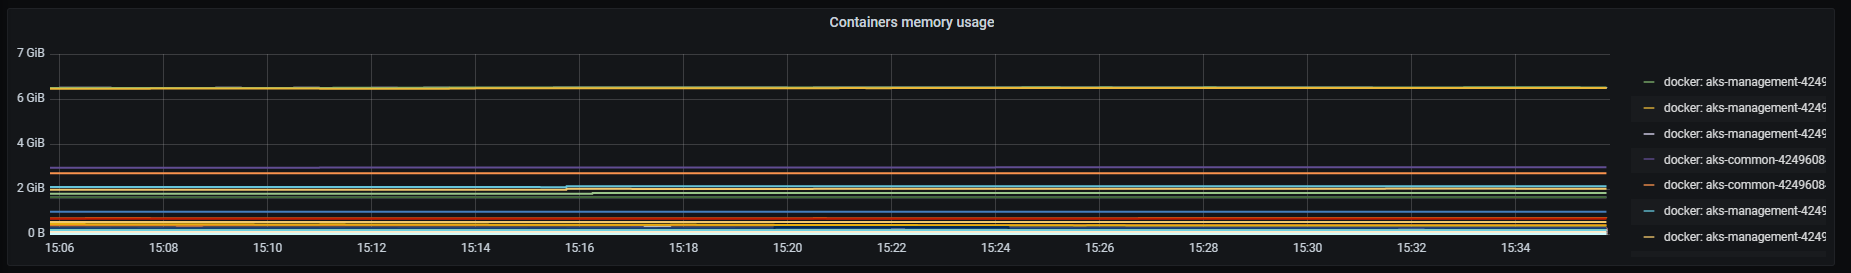
Containers memory usage
Memory usage, classified by container.
Metrics:
It includes two metrics:
- Containers with “k8s_”
sum (container_memory_working_set_bytes{image!="",name=~"^k8s_.*",container_name!="POD",kubernetes_io_hostname=~"^.*$",agentpool=~".*"}) by (container_name, pod_name)
- Containers without “k8s_”
sum (container_memory_working_set_bytes{image!="",name!~"^k8s_.*",kubernetes_io_hostname=~"^.*$",agentpool=~".*"}) by (kubernetes_io_hostname, name, image)
Graph visual
All processes memory usage
Total memory usage rate.
Metrics:
sum (container_memory_working_set_bytes{pod_name!="",kubernetes_io_hostname=~"^.*$",agentpool=~".*"}) by (pod_name)
Graph visual
Pods network I/O
Total network received/sent usage rate, classified by pod and aggregated by one minute.
Metrics:
- Received bytes
sum (rate (container_network_receive_bytes_total{image!="",name=~"^k8s_.*",kubernetes_io_hostname=~"^.*$",agentpool=~".*"}[1m])) by (pod_name)
- Sent bytes
- sum (rate (container_network_transmit_bytes_total{image!="",name=~"^k8s_.*",kubernetes_io_hostname=~"^.*$",agentpool=~".*"}[1m])) by (pod_name)
Graph visual
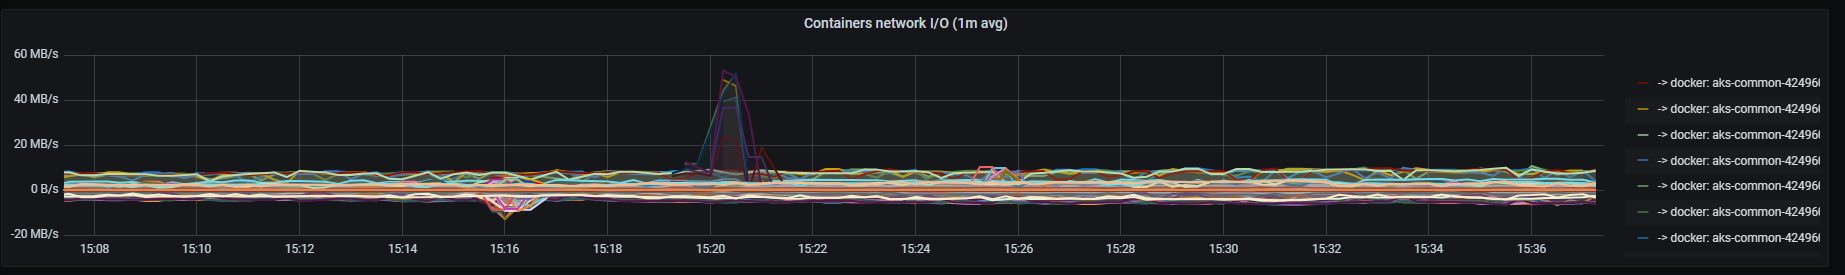
Containers network I/O
Total network received/sent usage rate, classified by container and aggregated by one minute.
Metrics:
- Received bytes, containers with “k8s_”
sum (rate (container_network_receive_bytes_total{image!="",name=~"^k8s_.*",kubernetes_io_hostname=~"^.*$",agentpool=~".*"}[1m])) by (container_name, pod_name)
- Sent bytes, containers with “k8s_”
- sum (rate (container_network_transmit_bytes_total{image!="",name=~"^k8s_.*",kubernetes_io_hostname=~"^.*$",agentpool=~".*"}[1m])) by (container_name, pod_name)
- Received bytes, containers without “k8s_”
sum (rate (container_network_receive_bytes_total{image!="",name!~"^k8s_.*",kubernetes_io_hostname=~"^.*$",agentpool=~".*"}[1m])) by (kubernetes_io_hostname, name, image)
- Sent bytes, containers without “k8s_”
- sum (rate (container_network_transmit_bytes_total{image!="",name!~"^k8s_.*",kubernetes_io_hostname=~"^.*$",agentpool=~".*"}[1m])) by (kubernetes_io_hostname, name, image)
Graph visual
All processes network I/O
Total network received/sent usage rate, aggregated by one minute.
Metrics:
- Received bytes
sum (rate (container_network_receive_bytes_total{pod_name!="",kubernetes_io_hostname=~"^.*$",agentpool=~".*"}[1m])) by (pod_name)
- Sent bytes
- sum (rate (container_network_transmit_bytes_total{pod_name!="",kubernetes_io_hostname=~"^.*$",agentpool=~".*"}[1m])) by (pod_name)
Graph visual
Pods disk I/O
Total disk reads/writes rate, classified by pod and aggregated by one minute.
Metrics:
- Read bytes, pods without device
sum(rate(container_fs_reads_bytes_total{image!="",name=~"^k8s_.*",kubernetes_io_hostname=~"^.*$",agentpool=~".*", device!=""}[1m])) by (pod_name)
- Written bytes, pods without device
sum(rate(container_fs_writes_bytes_total{image!="",name=~"^k8s_.*",kubernetes_io_hostname=~"^.*$",agentpool=~".*", device!=""}[1m])) by (pod_name)
- Read bytes, pods with device
sum(rate(container_fs_reads_bytes_total{image!="",name=~"^k8s_.*",kubernetes_io_hostname=~"^.*$",agentpool=~".*", device=""}[1m])) by (pod_name)
- Written bytes, pods with device
sum(rate(container_fs_writes_bytes_total{image!="",name=~"^k8s_.*",kubernetes_io_hostname=~"^.*$",agentpool=~".*", device=""}[1m])) by (pod_name)
Graph visual
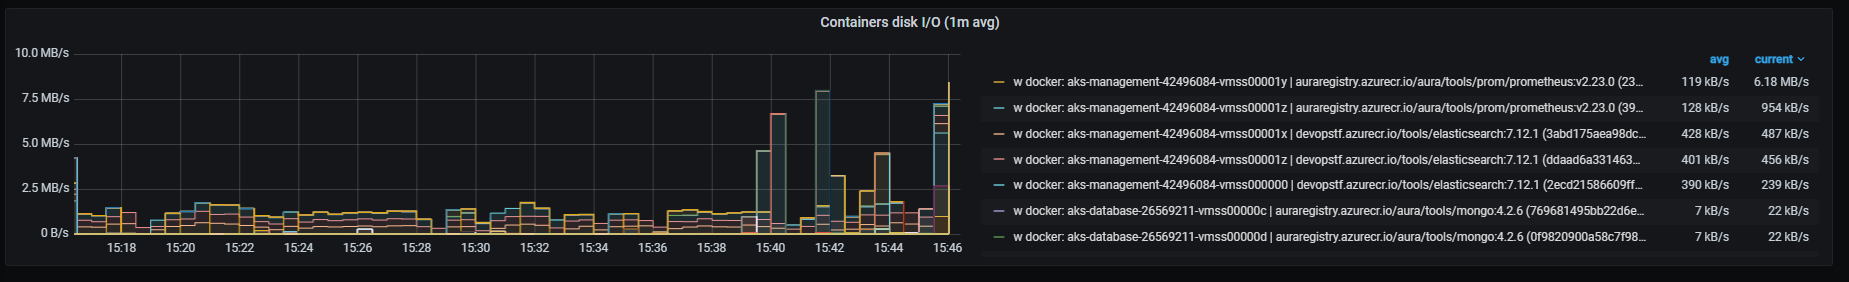
Containers disk I/O
Total disk reads/writes rate, classified by container and aggregated by one minute.
Metrics:
- Read bytes, containers without device
sum(rate(container_fs_reads_bytes_total{image!="",name=~"^k8s_.*",kubernetes_io_hostname=~"^.*$",agentpool=~".*", device!=""}[1m])) by (container_name, pod_name)
- Written bytes, containers without device
sum(rate(container_fs_writes_bytes_total{image!="",name=~"^k8s_.*",kubernetes_io_hostname=~"^.*$",agentpool=~".*", device!=""}[1m])) by (container_name, pod_name)
- Read bytes, containers with device
sum(rate(container_fs_reads_bytes_total{image!="",name=~"^k8s_.*",kubernetes_io_hostname=~"^.*$",agentpool=~".*", device=""}[1m])) by (container_name, pod_name)
- Written bytes, containers with device
sum(rate(container_fs_writes_bytes_total{image!="",name=~"^k8s_.*",kubernetes_io_hostname=~"^.*$",agentpool=~".*", device=""}[1m])) by (container_name, pod_name)
- Read bytes, containers without “k8s_”
sum(rate(container_fs_reads_bytes_total{image!="",name!~"^k8s_.*",kubernetes_io_hostname=~"^.*$",agentpool=~".*"}[1m])) by (kubernetes_io_hostname, name, image)
- Written bytes, containerswithout “k8s_”
sum(rate(container_fs_writes_bytes_total{image!="",name!~"^k8s_.*",kubernetes_io_hostname=~"^.*$",agentpool=~".*"}[1m])) by (kubernetes_io_hostname, name, image)
Graph visual