Categories:
Basic monitoring queries
Learn how to get information for the evaluation of Aura system performance through basic queries
Introduction
The current document shows the guidelines for making queries to Grafana and Kibana in order to retrieve basic information from the system.
Number of TPS per component
Request rate in Grafana
- Access Grafana of the environment.
- Select “Aura HTTP inbounds” dashboard.
- Select the time period for the query.
- Select the service of your choice, as can be seen in the following picture:
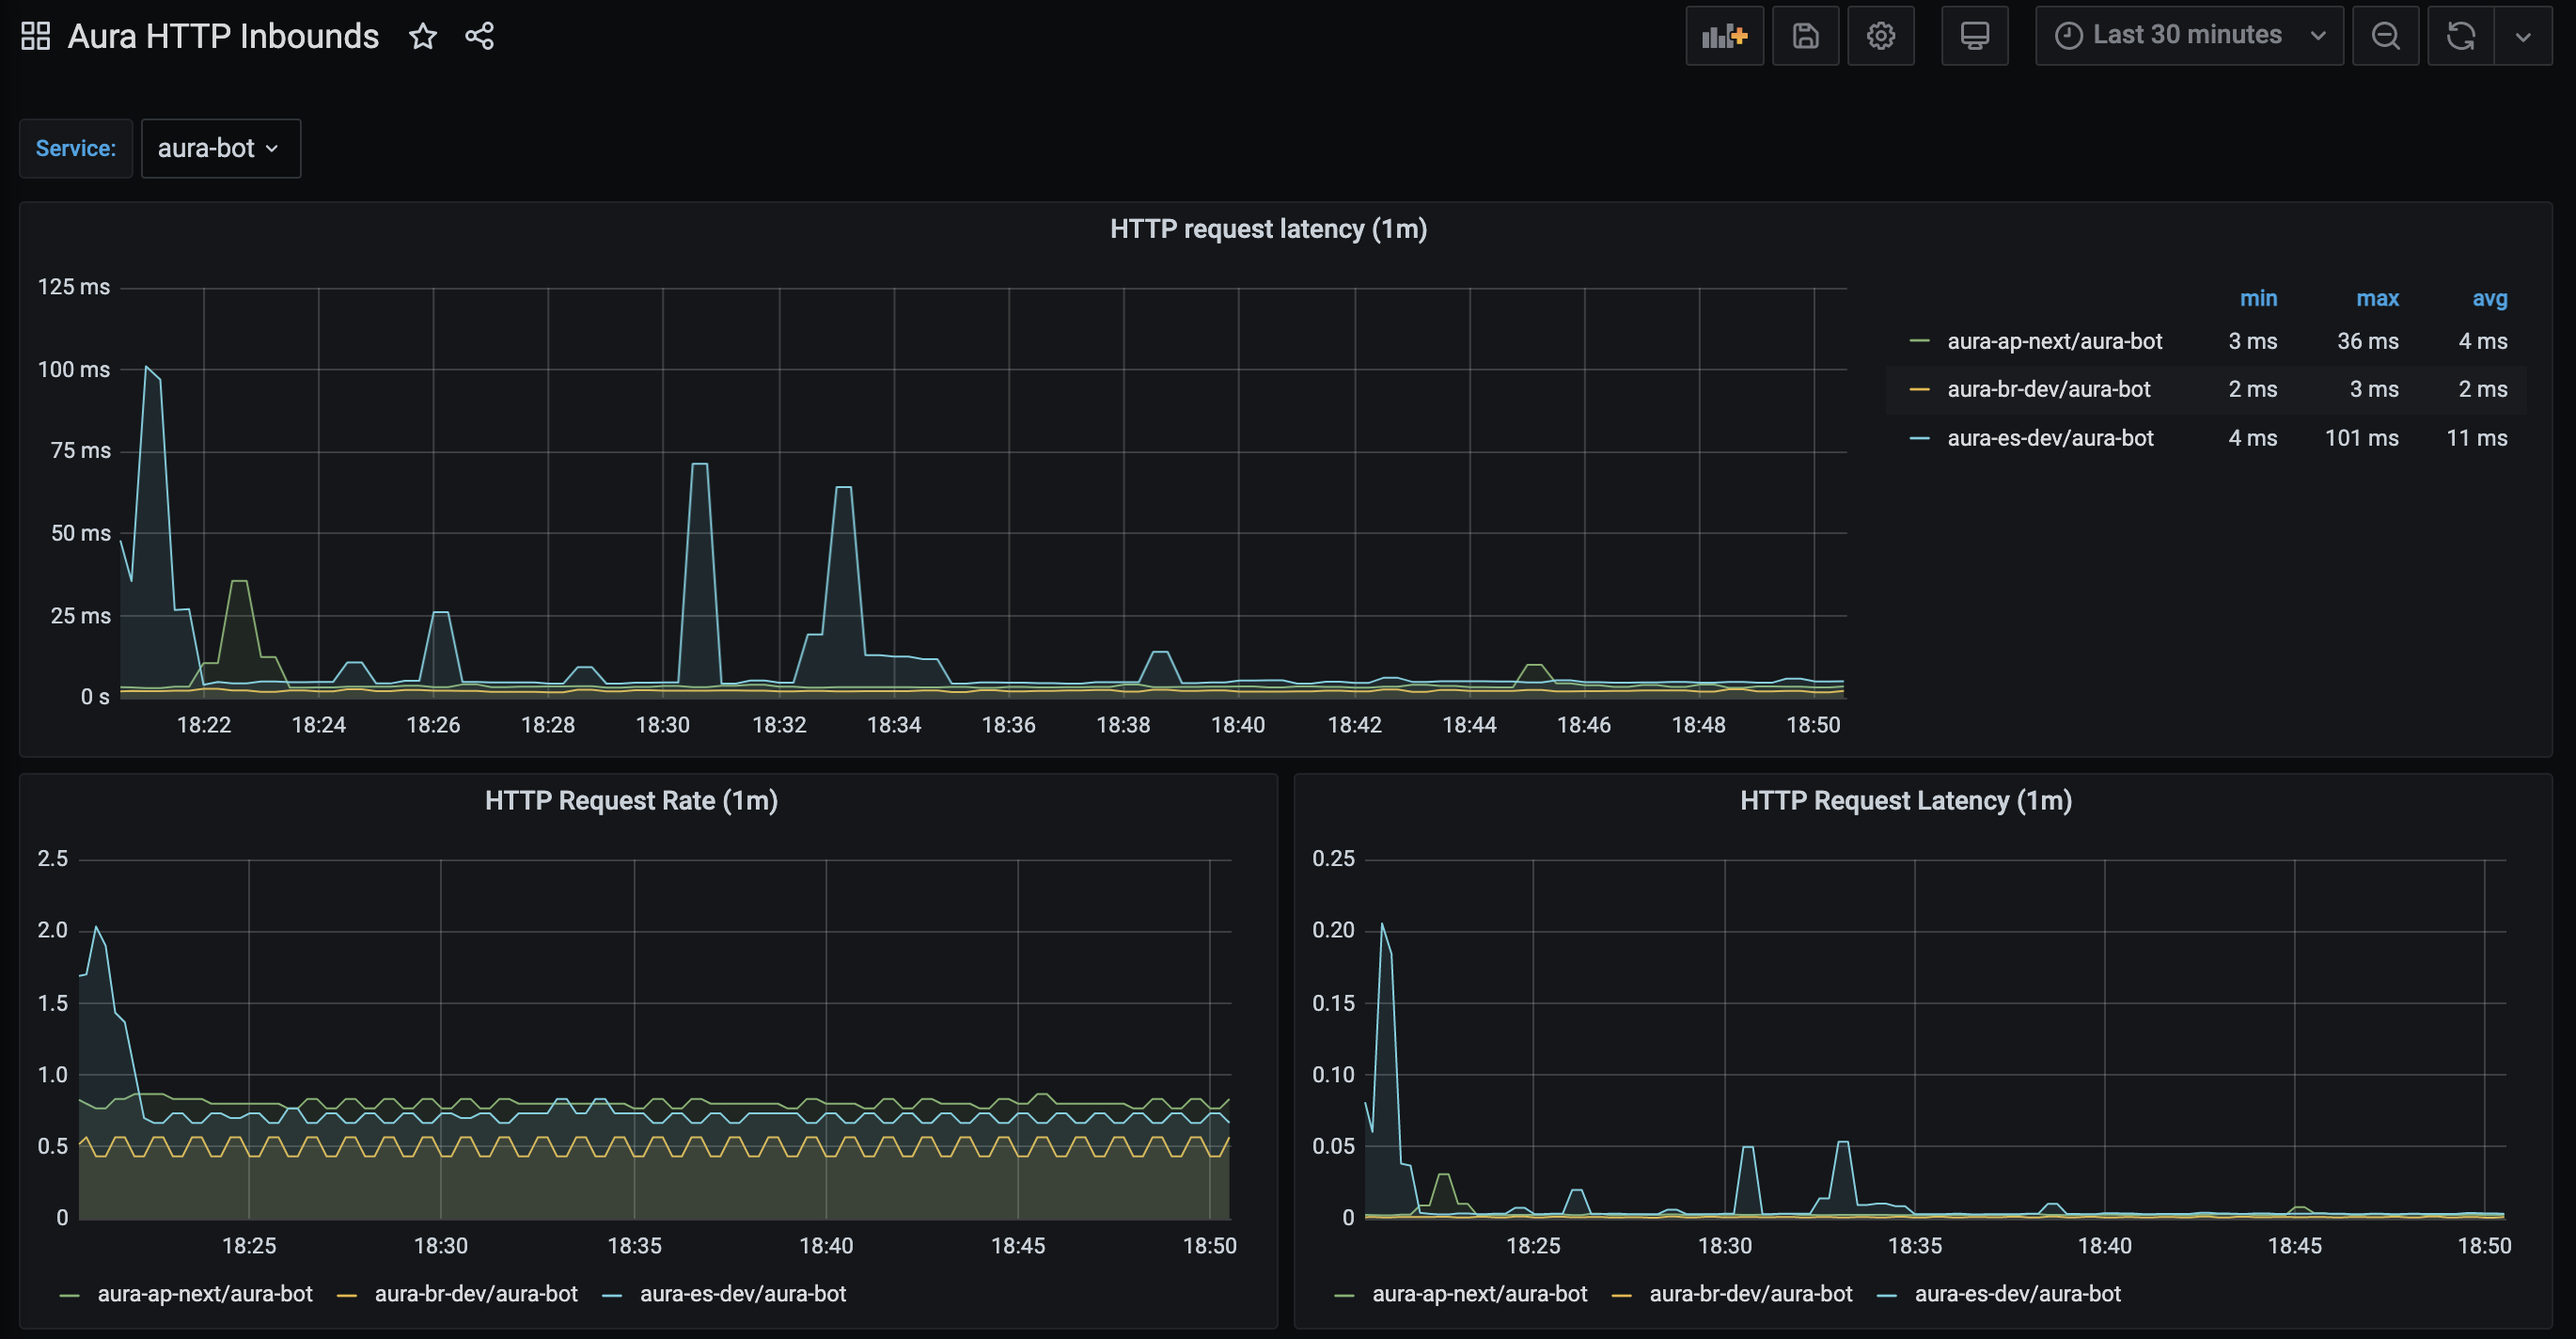
The panel named “HTTP Request Rate” shows the total number of requests being processed by a service.
This panel is based on the Prometheus aura-bot stored metric called http_request_duration_seconds aggregated in buckets of one minute.
It shows in the y-axis the number of requests in the service and in the x-axis the time period.
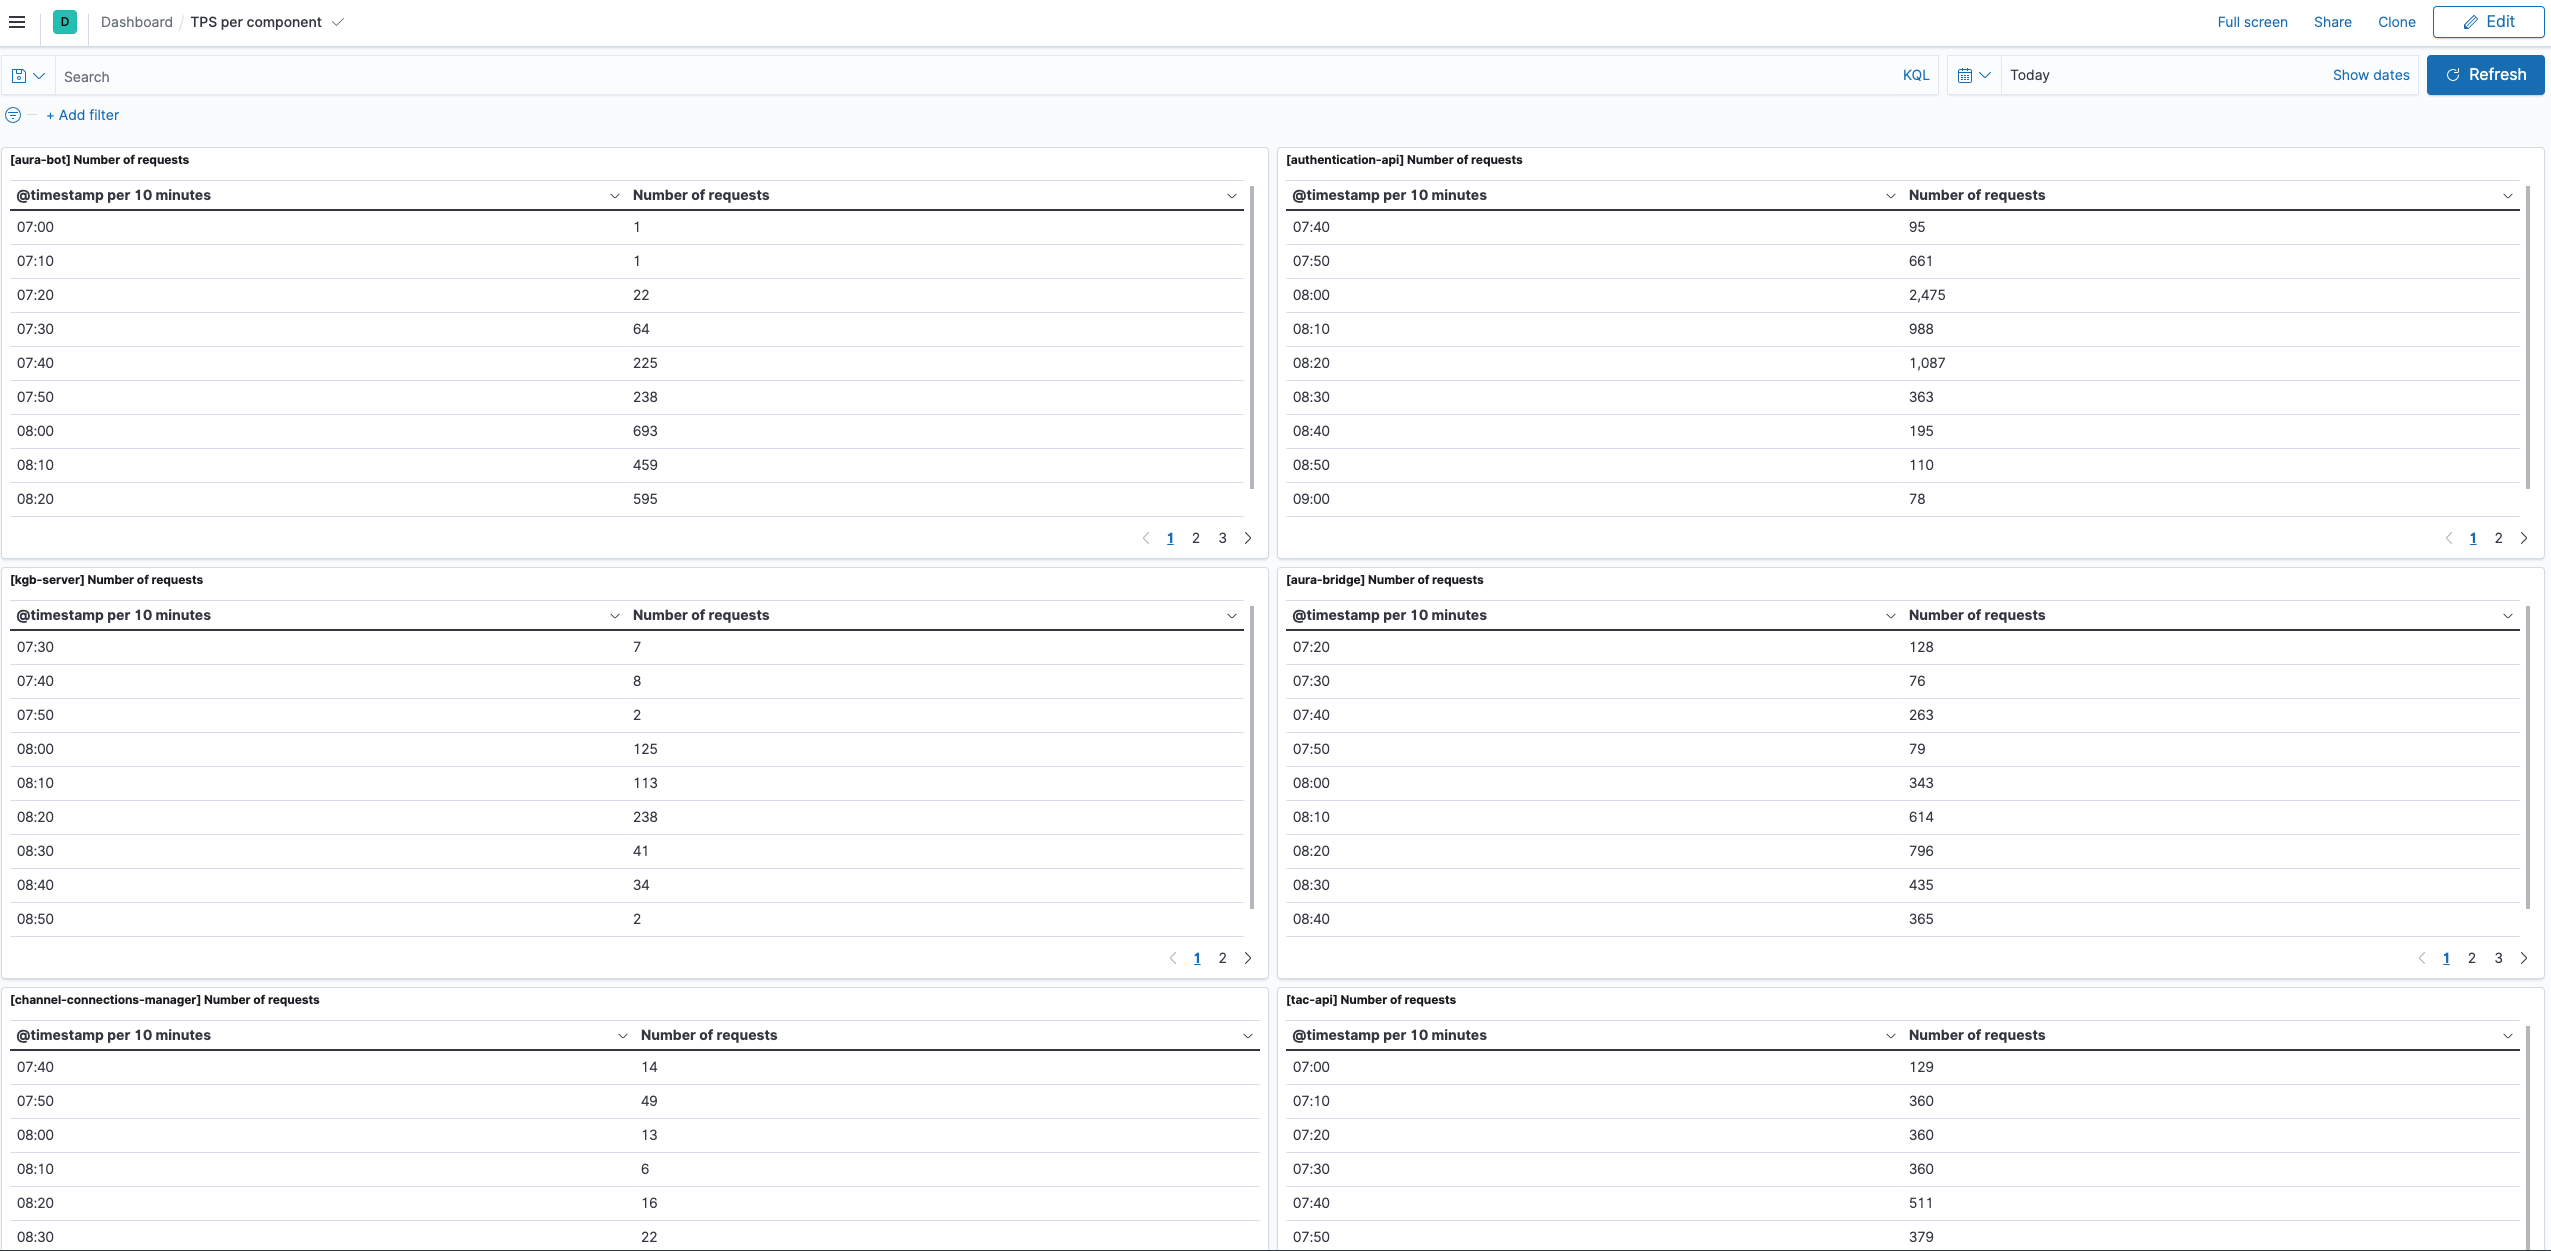
Request rate in Kibana
Add a new dashboard with the following data:
-
Select the time interval for the filter
-
Query (overwrite your-env with the environment of your choice):
-
aura-bot:
- Public endpoints but healthcheck:
msg: "Response returned" and kubernetes.labels.app : "aura-bot" and kubernetes.namespace_name: "your-env" and not path: "/ping". - For all the endpoints of the service:
msg: "Response returned" and kubernetes.labels.app : "aura-bot" and kubernetes.namespace_name: "your-env".
- Public endpoints but healthcheck:
-
aura-authentication-api:
- Public endpoints but healthcheck:
msg: "Response returned" and kubernetes.labels.app : "authentication-api" and kubernetes.namespace_name: "your-env" and not path: "/ping". - For all the endpoints of the service:
msg: "Response returned" and kubernetes.labels.app : "authentication-api" and kubernetes.namespace_name: "your-env".
- Public endpoints but healthcheck:
-
aura-bridge:
- Public endpoints but healthcheck:
msg: "Response returned" and kubernetes.labels.app : "aura-bridge" and kubernetes.namespace_name: "your-env" and not path: "/ping". - For all the endpoints of the service:
msg: "Response returned" and kubernetes.labels.app : "aura-bridge" and kubernetes.namespace_name: "your-env".
- Public endpoints but healthcheck:
-
tac-api:
- Public endpoints but healthcheck:
msg: "Response with status" and kubernetes.labels.app : "tac" and kubernetes.namespace_name: "your-env" and not path: "/ping". - For all the endpoints of the service:
msg: "msg: "Response with status" and kubernetes.labels.app : "tac" and kubernetes.namespace_name: "your-env".
- Public endpoints but healthcheck:
-
aura-nlp:
- Public endpoints but healthcheck:
msg: "HTTP request" and kubernetes.labels.app : "nlp" and kubernetes.namespace_name: "your-env" and not path: "/ping". - For all the endpoints of the service:
msg: "msg: "msg: "HTTP request" and kubernetes.labels.app : "nlp" and kubernetes.namespace_name: "your-env".
- Public endpoints but healthcheck:
-
aura-context:
- Public endpoints but healthcheck:
msg: "HTTP request" and kubernetes.labels.app : "context" and kubernetes.namespace_name: "your-env" and not path: "/ping". - For all the endpoints of the service:
msg: "msg: "msg: "HTTP request" and kubernetes.labels.app : "context" and kubernetes.namespace_name: "your-env".
- Public endpoints but healthcheck:
-
-
Index: aurak8s-service
-
Data:
- Metric: Unique Count
- Field: corr.keyword
- Custom label: Number of requests
- Metric: Unique Count
-
Buckets: split rows
- Aggregation: Date histogram
- Field: @timestamp
- Minimum interval: minute
Update the dashboard and name it, in order to have it available.
A basic example of this dashboard with a panel per component is delivered with Aura, so it can be imported in the Kibana of the environment using Kibana import objects API.
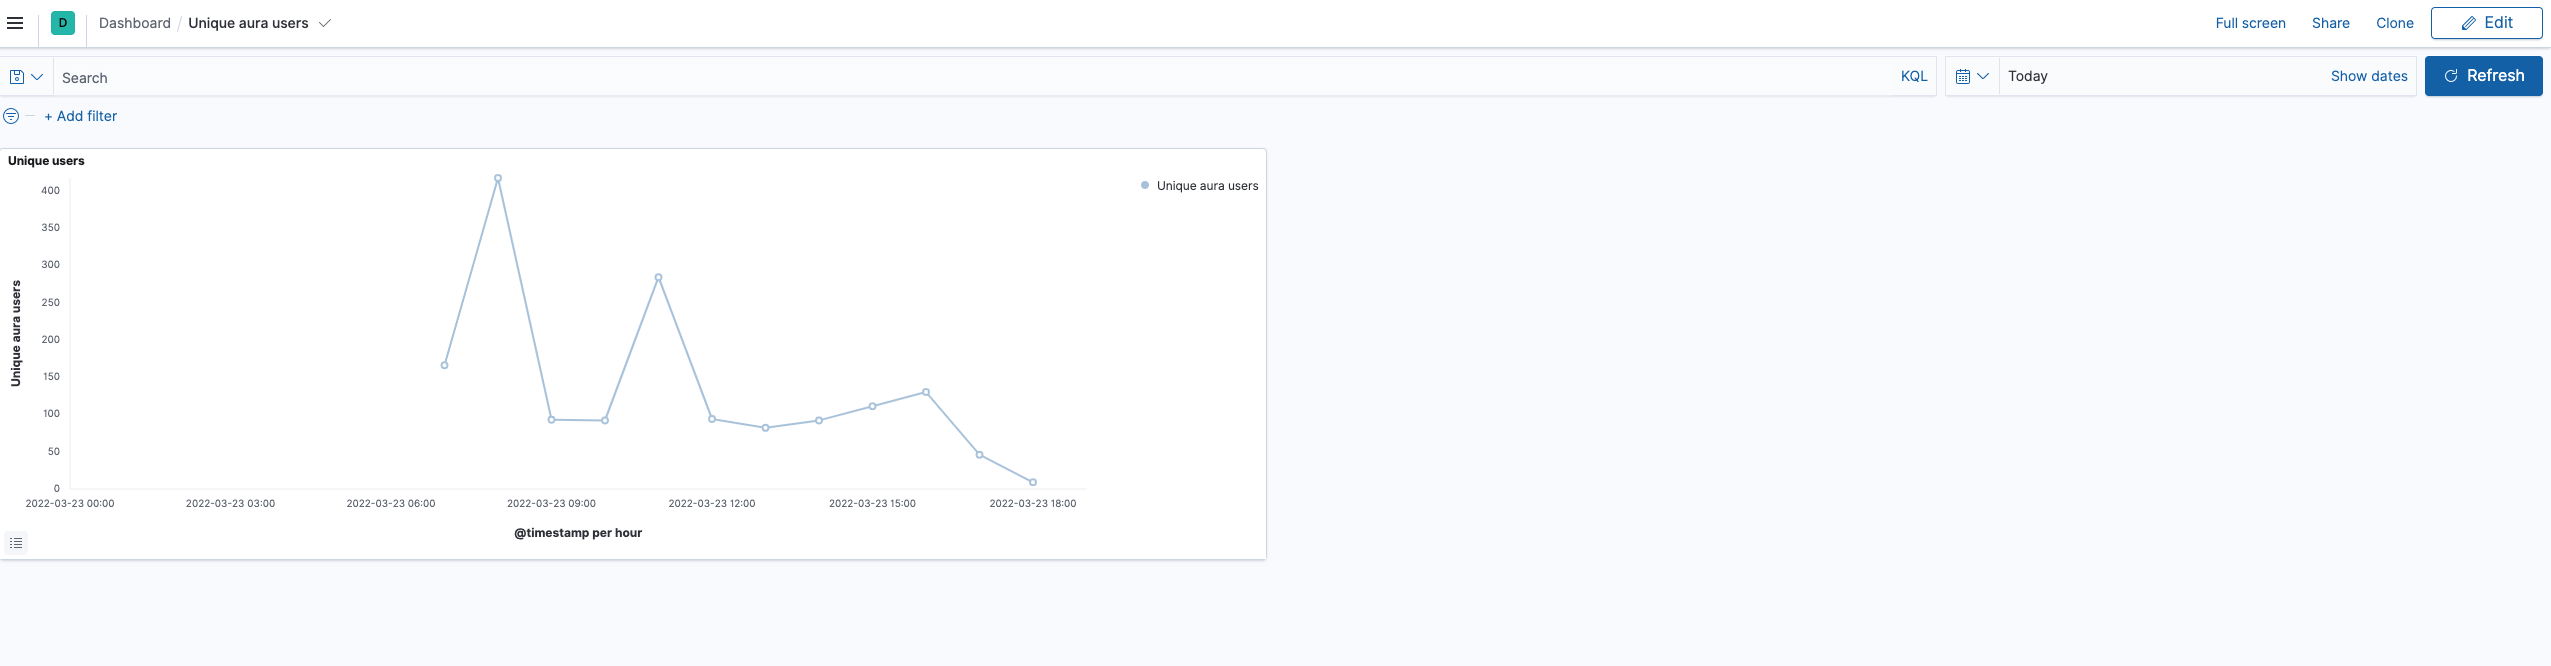
Number of unique users in Aura
In this case, the only way of getting the number of unique users accessing to Aura is querying the operational logs, in Kibana.
Add a new dashboard in Kibana with the following data:
- Select the time interval for the filter
- Query (overwrite your-env with the environment of your choice):
app.keyword : "aura-bot" and kubernetes.namespace_name.keyword : "your-env" - Index: aurak8s-service
- Data:
- Metric: Unique Count
- Field: auraId.keyword
- Custom label: Number of unique aura users
- Buckets: split rows
- Aggregation: Date histogram
- Field: @timestamp
- Minimum interval: 1h
Update the dashboard and name it, to have it available.
A basic example of this dashboard with a panel per component is delivered with Aura, so it can be imported in the Kibana of the environment using kibana import objects API.