Categories:
Pod resources dashboard
Information provided by Pod resources dashboard
Introduction
This is a unique dashboard to obtain the most basic information about how the environment pods behavior is.
To get the information about each pod, the dashboard counts on a filter with the following fields:
namespace: list of all the available namespaces of your deployment.pod: list of pods running in the selected namespace.container: list of containers running in the selected pod.DS_PROMETHEUS: Prometheus data source to be used. By default,Prometheus.
Once selected, the following graphs are printed, with the data of the pod.
Panels
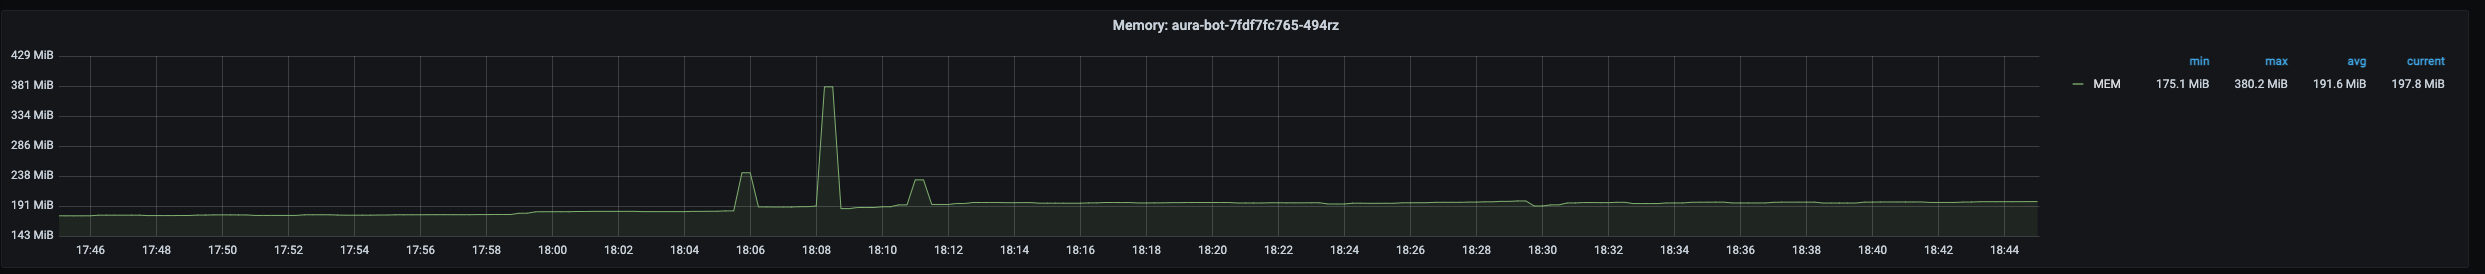
Pod memory
Pod memory panel shows a time series with the current memory consumption in the selected pod. It also shows the current, maximum, minimum and average memory consumption of the Pod.
The x-axis shows the time series and the y-axis shows the amount of memory consumed by the pod.
The queries used to get the panel information are:
sum(kube_pod_container_resource_requests_memory_bytes{namespace="aura-<env>",pod="aura-bot-<id>"})
sum(kube_pod_container_resource_limits_memory_bytes{namespace="aura-<env>",pod="aura-bot-<id>"})
sum(container_memory_working_set_bytes{namespace="aura-<dev>",container!="POD",container!="",pod!="", pod="aura-bot-<id>"})
An example of this panel is shown below:
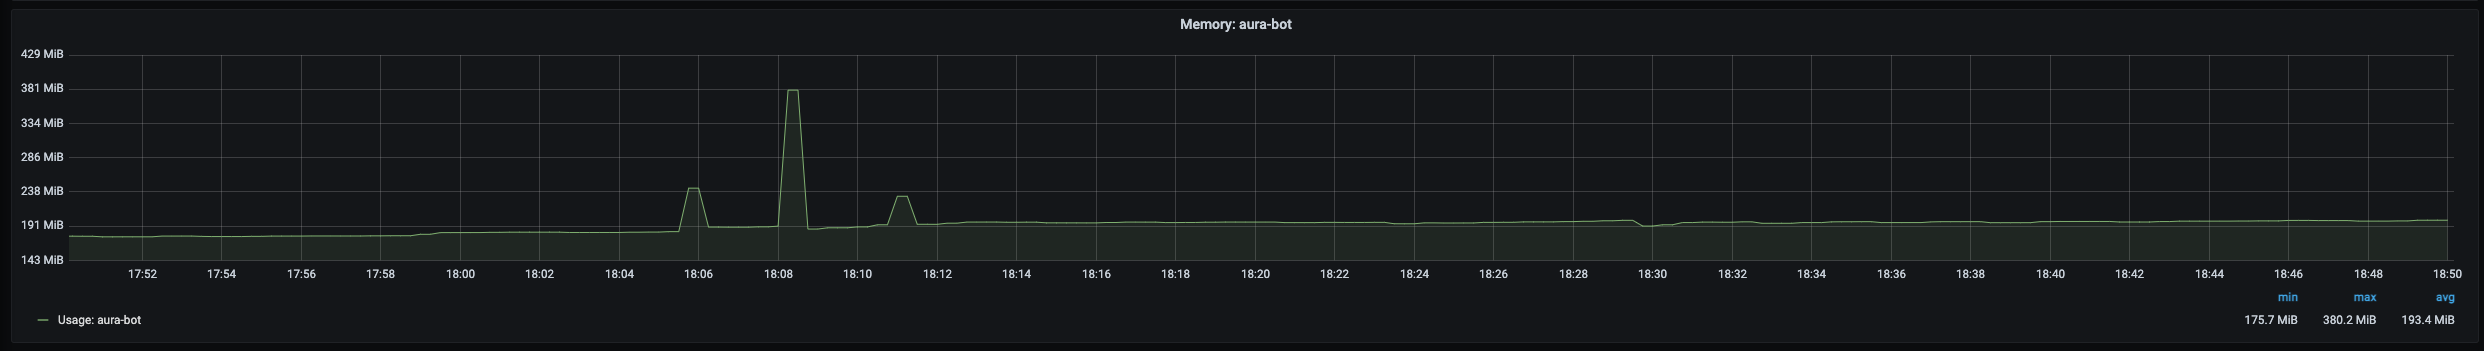
Container memory
Container memory panel shows a time series with the current memory consumption the selected container. It also shows the current, maximum, minimum and average memory consumption of the container.
The x-axis shows the time series and the y-axis shows the amount of memory consumed by the container.
The queries used to get the panel information are:
sum(kube_pod_container_resource_requests_memory_bytes{namespace="aura-<env>",pod="aura-bot-<id>",container="aura-bot"})
sum(kube_pod_container_resource_limits_memory_bytes{namespace="aura-<env>",pod="aura-bot-<id>",container="aura-bot"})
sum(container_memory_working_set_bytes{namespace="aura-<dev>",container!="POD",container!="",pod!="", pod="aura-bot-<id>",container="aura-bot"}) by (container)
An example of this panel is shown below:
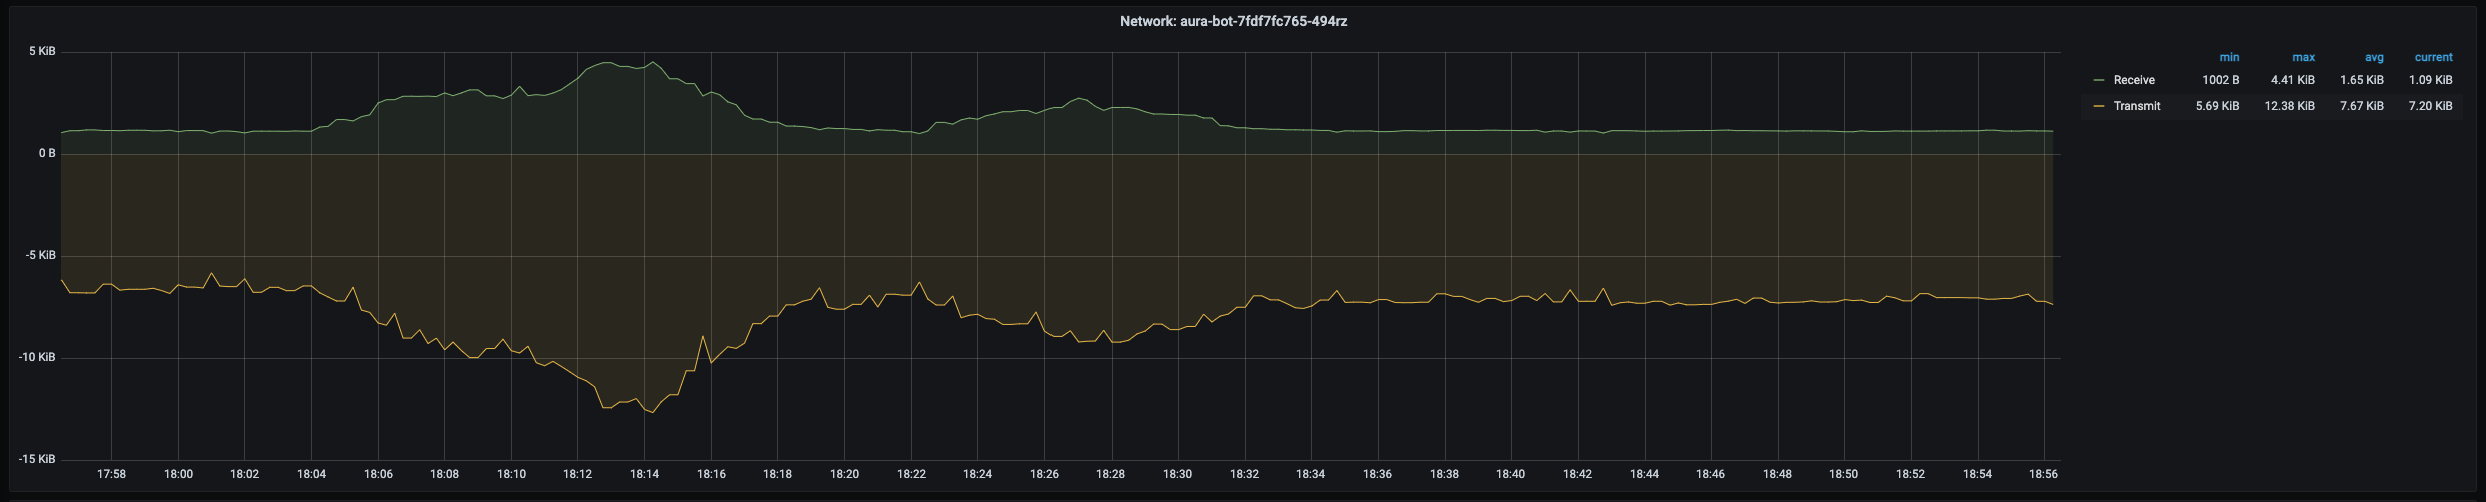
Pod network
Pod network panel shows a time series with the current I/O network consumption of the selected pod. It also shows the current, maximum, minimum and average network consumption of the pod.
The x-axis shows the time series and the y-axis shows the amount of bytes consumed by the pod.
The queries used to get the panel information are:
sum(rate(container_network_receive_bytes_total{namespace="aura-<env>",pod="aura-bot-<id>"}[5m]))
sum(rate(container_network_transmit_bytes_total{namespace="aura-<env>",pod="aura-bot-<id>"}[5m]))
An example of this panel is shown below:
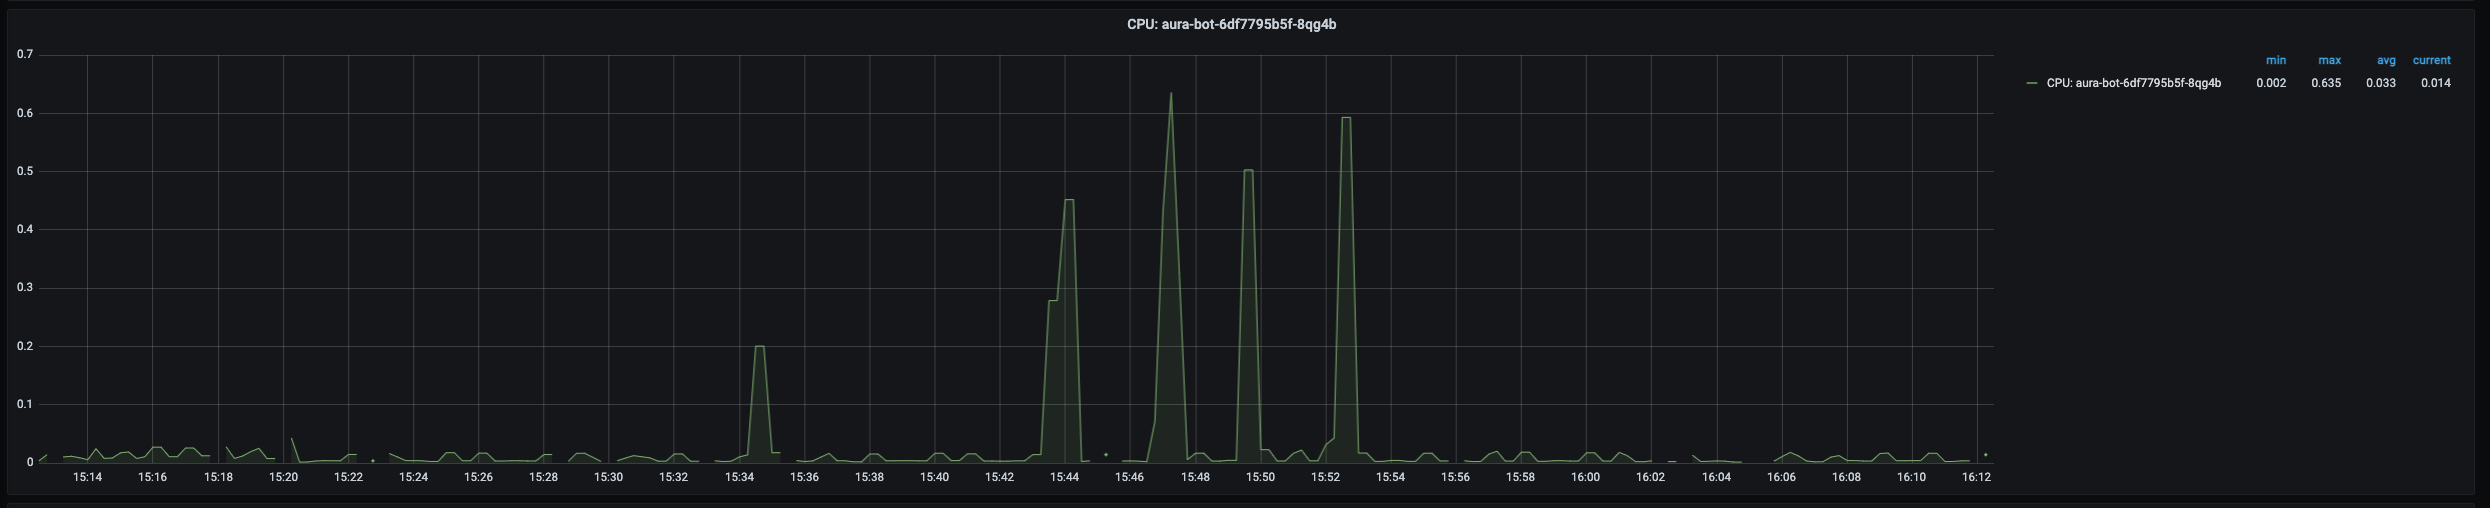
Pod CPU
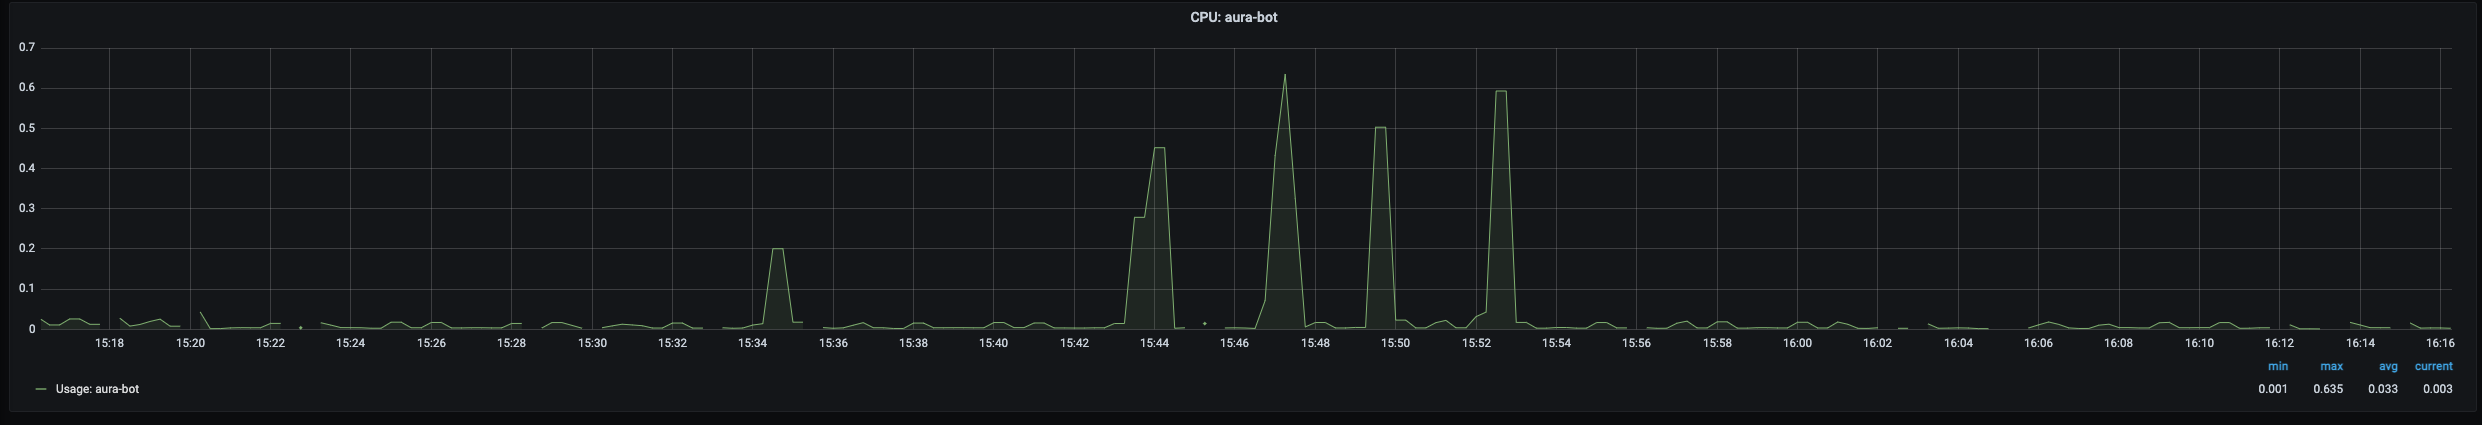
Pod CPU panel shows a time series with the current CPU consumption of the selected pod. It also shows the current, maximum, minimum and average CPU consumption of the pod.
The x-axis shows the time series and the y-axis shows the percentage of CPU used by the pod.
The queries used to get the panel information are:
sum(kube_pod_container_resource_requests_cpu_cores{namespace="aura-<env>",pod="aura-bot-<id>"})
sum(kube_pod_container_resource_limits_cpu_cores{namespace="aura-<env>",pod="aura-bot-<id>"})
sum(rate(container_cpu_usage_seconds_total{namespace="aura-<env>",container!="POD",container!="",pod!="", pod="aura-bot-<id>"}[1m]))
An example of this panel is shown below:
Container CPU
Container CPU panel shows a time series with the current CPU usage of the selected container within the pod. It also shows the current, maximum, minimum and average CPU usage of the container.
The x-axis shows the time series and the y-axis shows the percentage of CPU used by the container.
The queries used to get the panel information are:
sum(kube_pod_container_resource_requests_cpu_cores{namespace="aura-<env>",pod="aura-bot-<id>",container="aura-bot"})
sum(kube_pod_container_resource_limits_cpu_cores{namespace="aura-<env>",pod="aura-bot-<id>",container="aura-bot"})
sum(rate(container_cpu_usage_seconds_total{namespace="aura-<env>",container!="POD",container!="",pod!="", pod="aura-bot-<id>",container="aura-bot"}[1m]))
An example of this panel is shown below:
Container disk
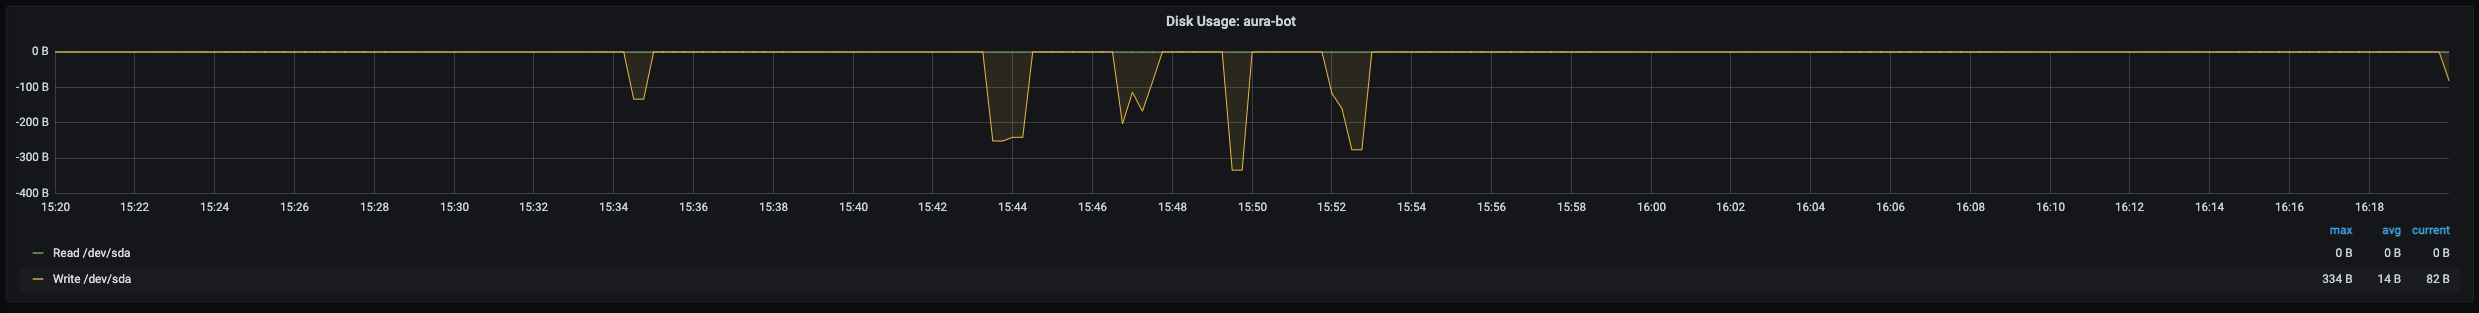
Container Disk panel shows a time series with the current disk usage of the selected container within the pod. It also shows the current, maximum, minimum and average disk usage of the container.
The x-axis shows the time series and the y-axis shows the amount of disk used by the container.
The queries used to get the panel information are:
sum(rate(container_fs_reads_bytes_total{namespace="aura-<env>",pod="aura-bot-<id>",container="aura-bot"}[1m])) by (container,device)
sum(rate(container_fs_writes_bytes_total{namespace="aura-<env>",pod="aura-bot-<id>",container="aura-bot"}[1m])) by (container,device)
An example of this panel is shown below:
Pod network errors
Pods network errors panel shows a time series with the percentage of errors in network access of the pod. It also shows the current, maximum, minimum and average number of errors of the pod, related to errors while receiving and transmitting data to the network.
The x-axis shows the time series and the y-axis shows the percentage of errors of the pod network accesses.
The queries used to get the panel information are:
sum(rate(container_network_receive_packets_total{namespace="aura-<env>",pod="aura-bot-<id>"}[5m])) / sum(rate(container_network_receive_errors_total{namespace="aura-<env>",pod="aura-bot-<id>"}[5m])) * 100
sum(rate(container_network_receive_packets_total{namespace="aura-<env>",pod="aura-bot-<id>"}[5m])) / sum(rate(container_network_receive_packets_dropped_total{namespace="aura-<env>",pod="aura-bot-<id>"}[5m])) * 100
sum(rate(container_network_transmit_packets_total{namespace="aura-<env>",pod="aura-bot-<id>"}[5m])) / sum(rate(container_network_transmit_errors_total{namespace="aura-<env>",pod="aura-bot-<id>"}[5m])) * 100
sum(rate(container_network_transmit_packets_total{namespace="aura-<env>",pod="aura-bot-<id>"}[5m])) / sum(rate(container_network_receive_packets_dropped_total{namespace="aura-<env>",pod="aura-bot-<id>"}[5m])) * 100
Pod status
This section consists of 5 panels: ready, created, number of restarts, last terminated reason, waiting reason and the description of the image running in the container.
Ready
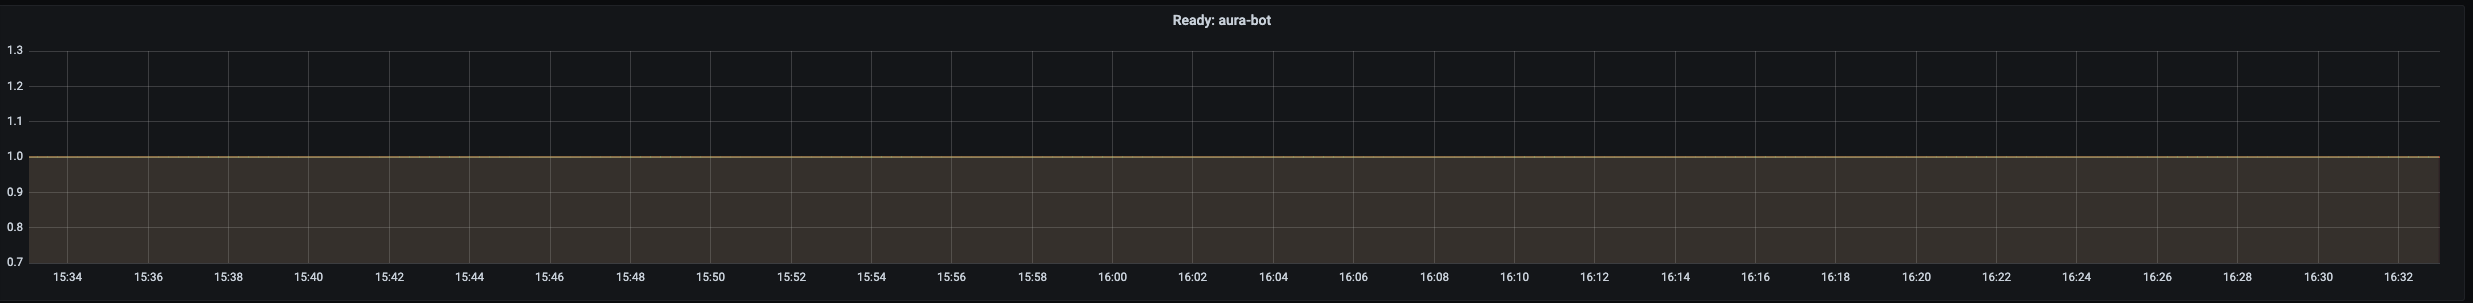
Ready panel shows a time series with heartbeat of the container. If there are no errors, it should be a flat line in 1.0.
The x-axis shows the time series and the y-axis shows the answer of the heartbeat of the container: 1 is a correct answer.
The queries used to get the panel information are:
kube_pod_container_status_ready{namespace="aura-<env>",pod="aura-bot-<id>",container="aura-bot"}
An example of this panel is shown below:
Pod created
Pod created panel shows the timestamp when the selected pod was created.
The queries used to get the panel information are:
kube_pod_created{namespace="aura-<env>",pod="aura-bot-<id>"} * 1000
An example of this panel is shown below:

Last terminated reason
This panel shows the reason why the pod entered the terminated status.
Last waiting reason
This panel shows the reason why the pod entered the waiting status.
Info
Info panel shows the images running in the containers of the selected pod.
The queries used to get the panel information are:
kube_pod_container_info{namespace="aura-<env>",pod="aura-bot-<id>"}
An example of this panel is shown below:
