This is the multi-page printable view of this section.
Click here to print.
Return to the regular view of this page.
Queries
Queries
Description of the different types of queries that can be done in order to retrieve metrics from the system
With the goal of retrieving from Aura specific information regarding the generated logs and metrics, we can make queries to the system.
These queries are classified into two categories:
1 - Basic monitoring queries
Basic monitoring queries
Learn how to get information for the evaluation of Aura system performance through basic queries
Introduction
The current document shows the guidelines for making queries to Grafana and Kibana in order to retrieve basic information from the system.
Number of TPS per component
Request rate in Grafana
- Access Grafana of the environment.
- Select “Aura HTTP inbounds” dashboard.
- Select the time period for the query.
- Select the service of your choice, as can be seen in the following picture:
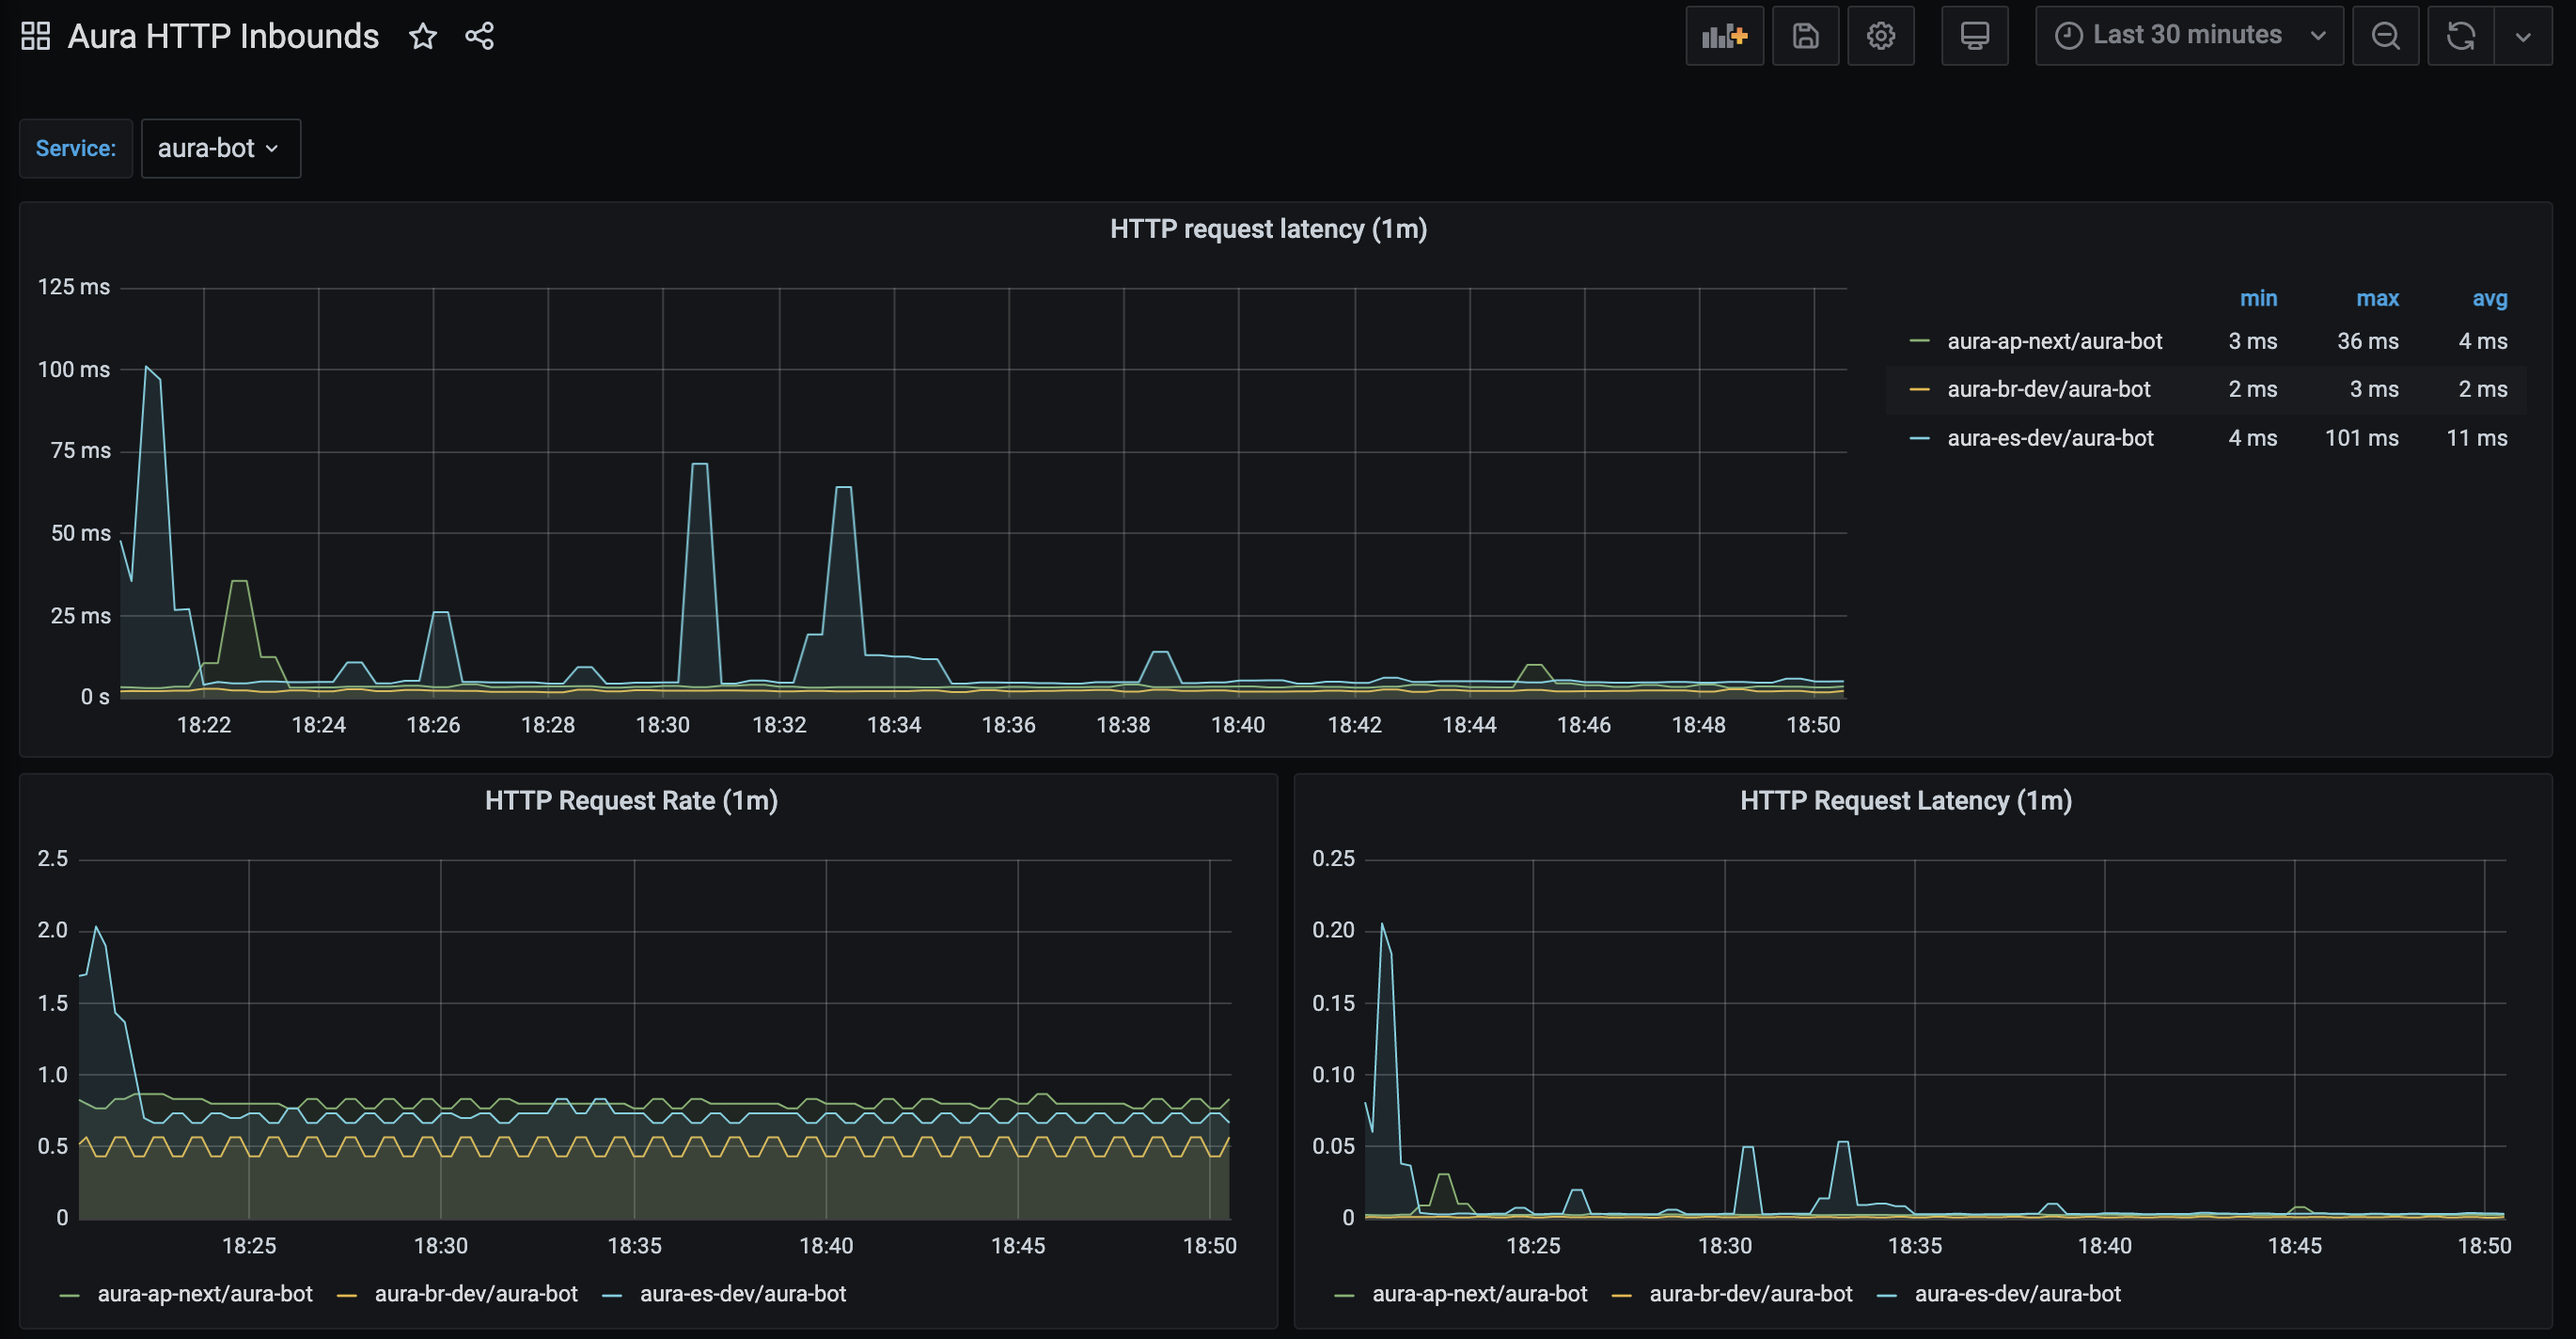
The panel named “HTTP Request Rate” shows the total number of requests being processed by a service.
This panel is based on the Prometheus aura-bot stored metric called http_request_duration_seconds aggregated in buckets of one minute.
It shows in the y-axis the number of requests in the service and in the x-axis the time period.
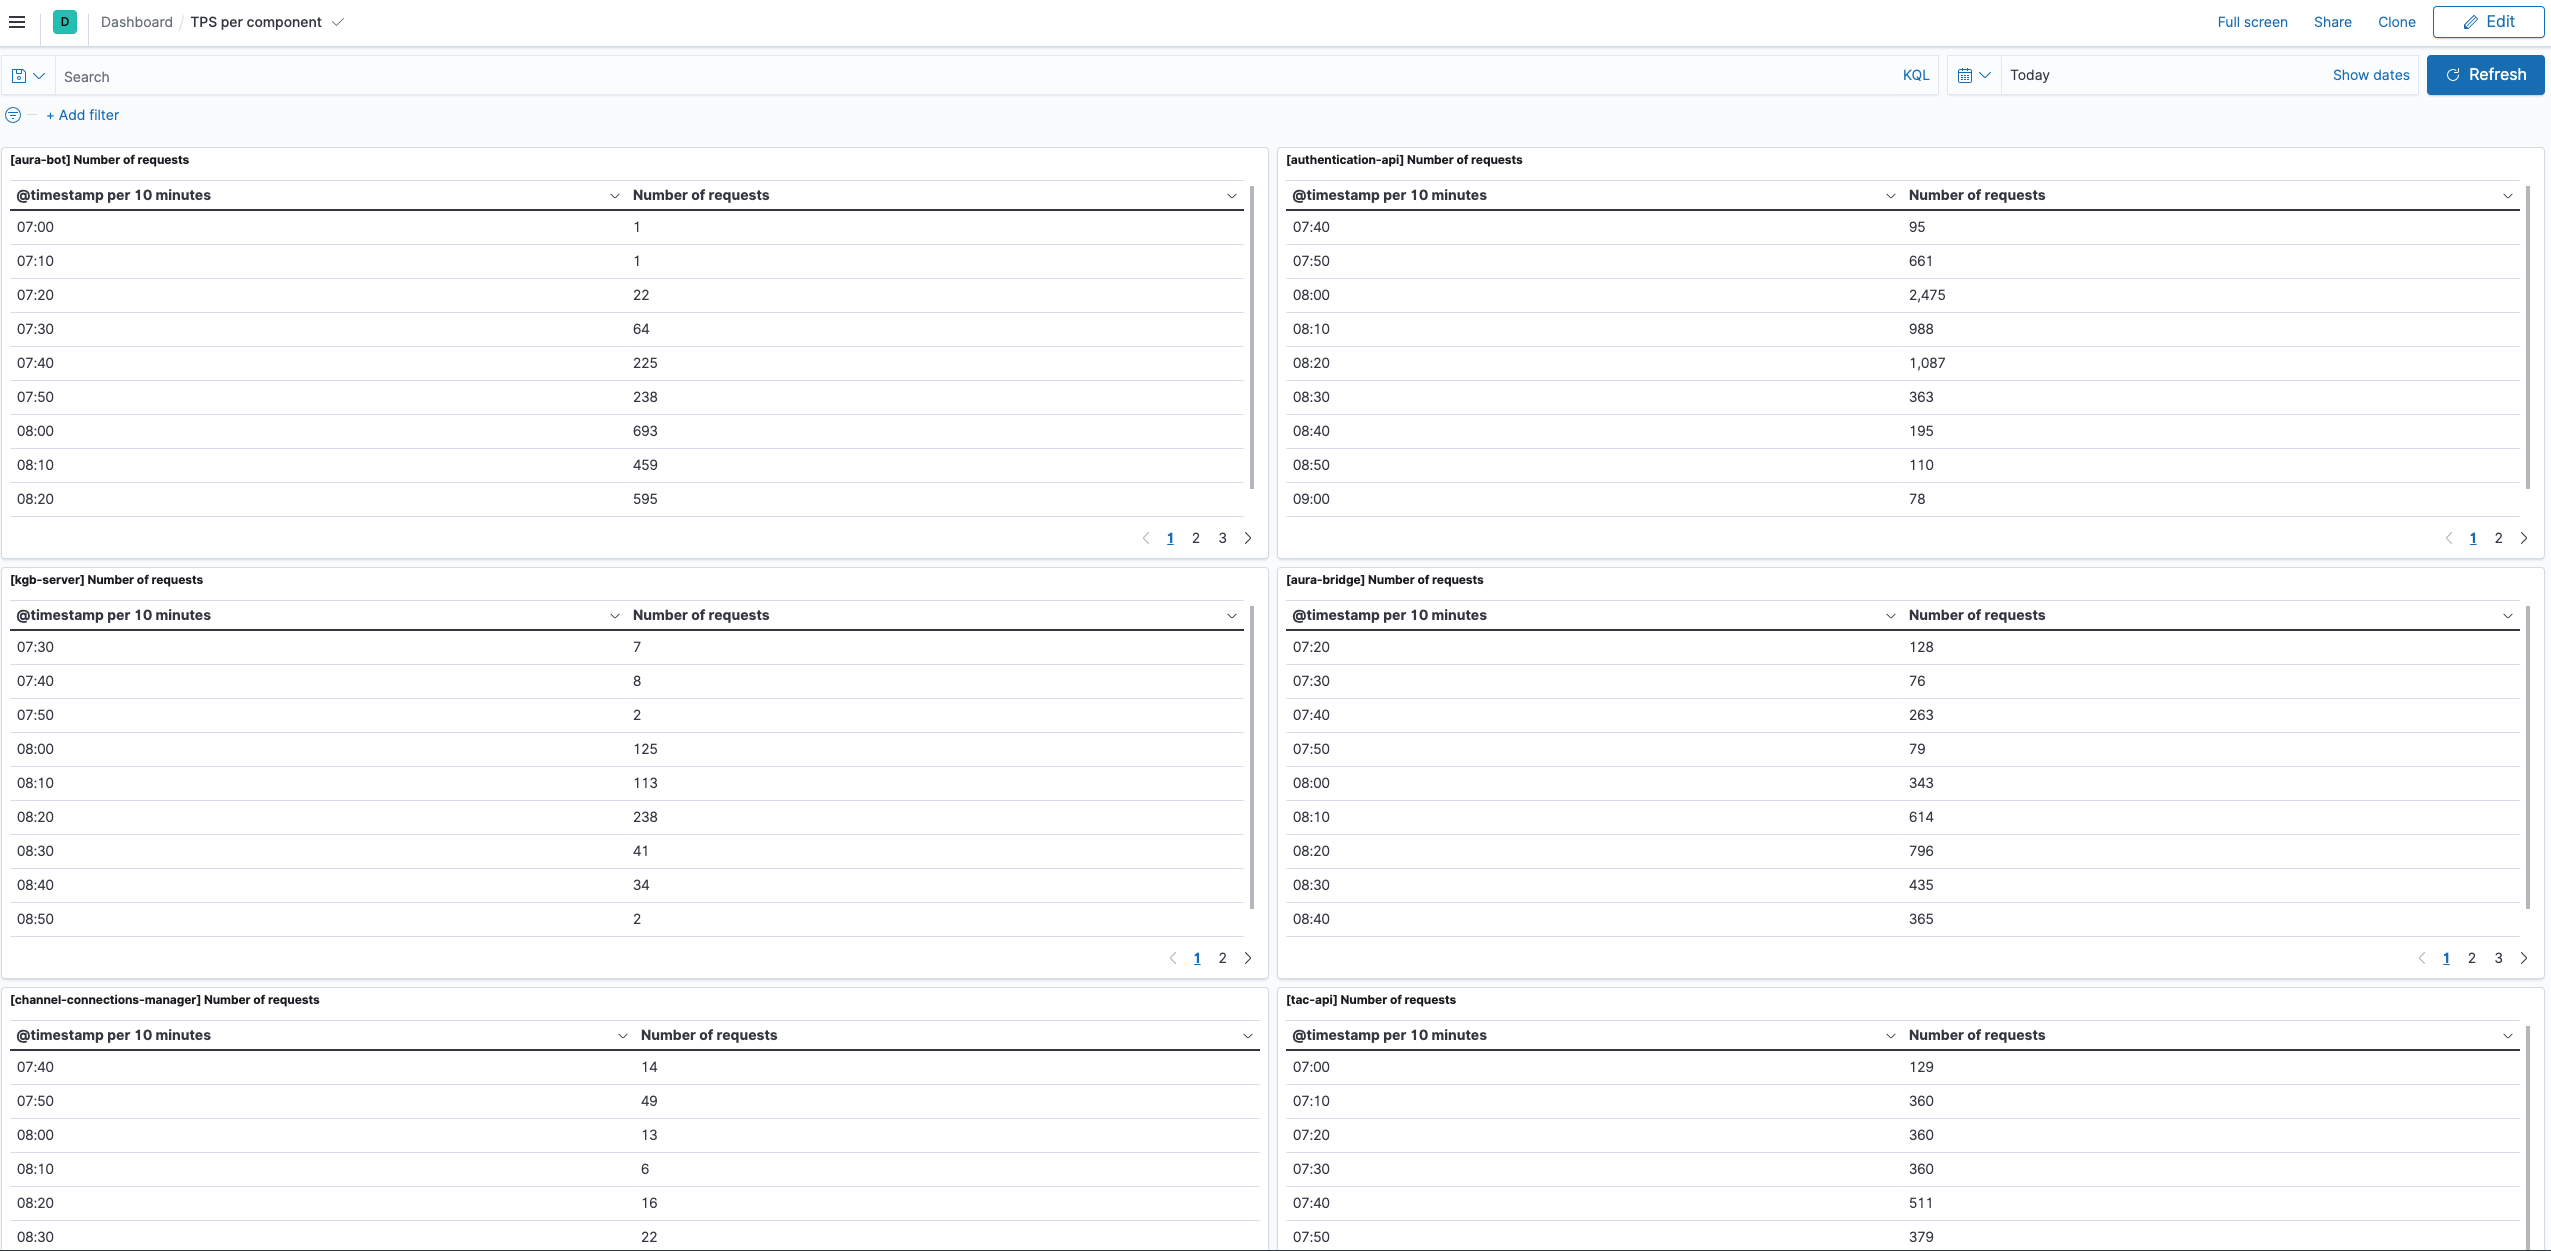
Request rate in Kibana
Add a new dashboard with the following data:
Update the dashboard and name it, in order to have it available.
A basic example of this dashboard with a panel per component is delivered with Aura, so it can be imported in the Kibana of the environment using Kibana import objects API.
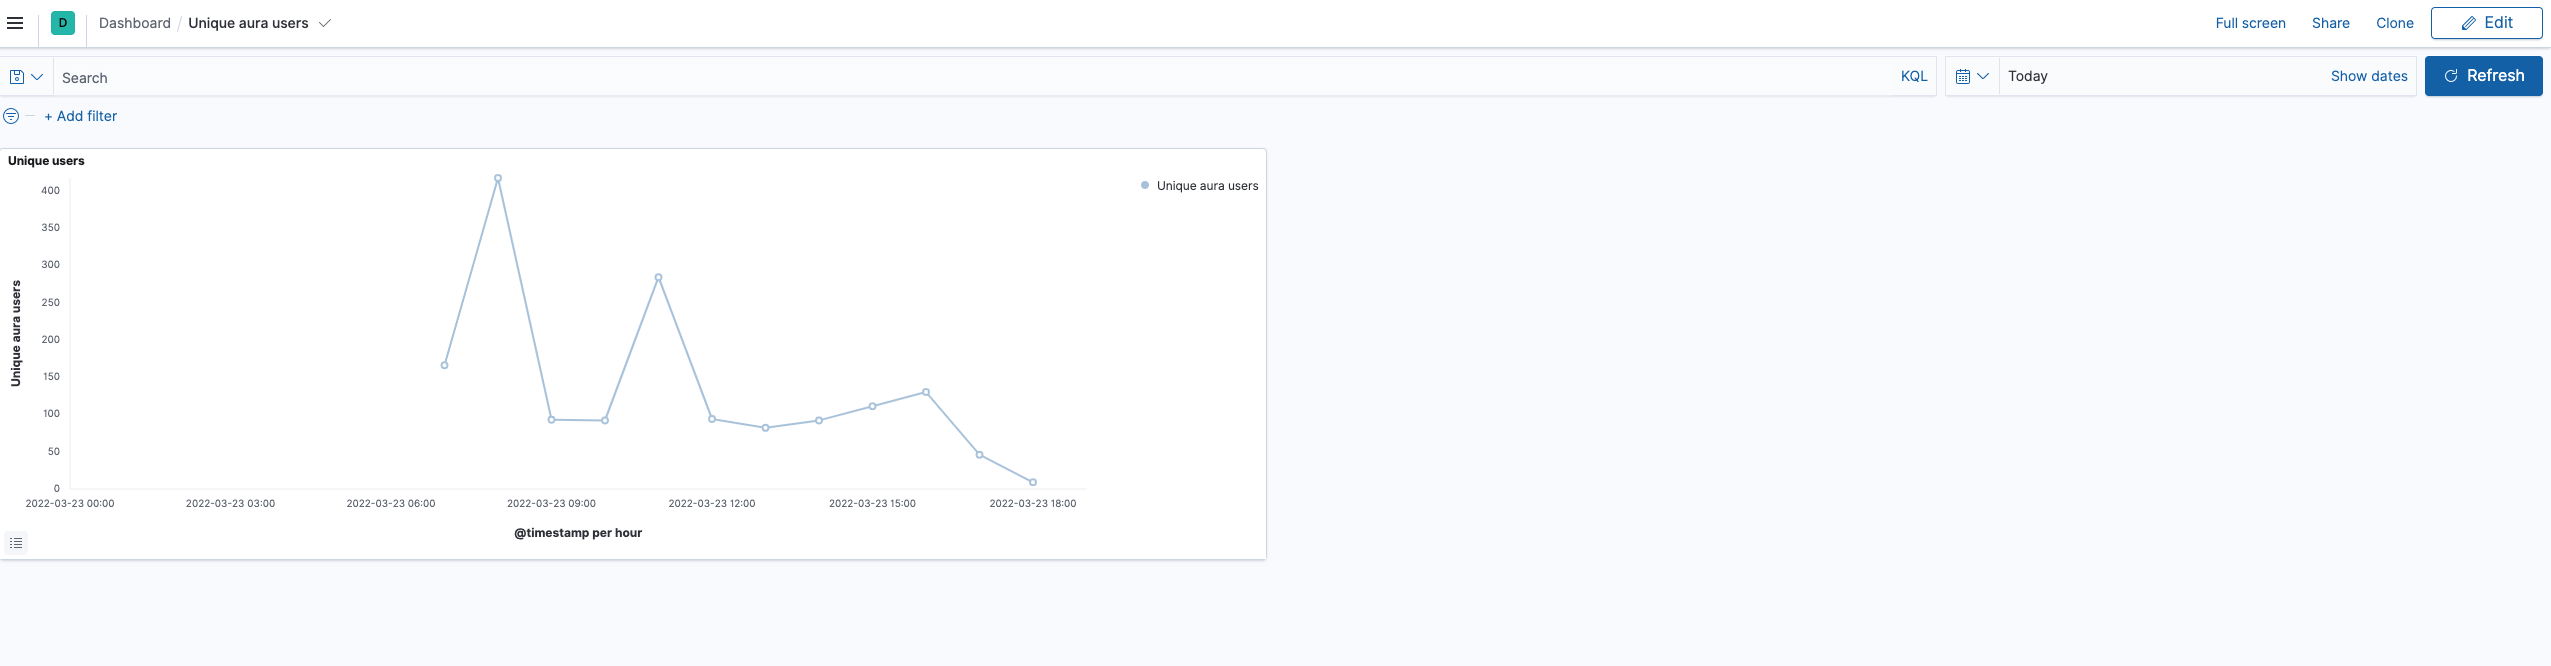
Number of unique users in Aura
In this case, the only way of getting the number of unique users accessing to Aura is querying the operational logs, in Kibana.
Add a new dashboard in Kibana with the following data:
- Select the time interval for the filter
- Query (overwrite your-env with the environment of your choice):
app.keyword : "aura-bot" and kubernetes.namespace_name.keyword : "your-env"
- Index: aurak8s-service
- Data:
- Metric: Unique Count
- Field: auraId.keyword
- Custom label: Number of unique aura users
- Buckets: split rows
- Aggregation: Date histogram
- Field: @timestamp
- Minimum interval: 1h
Update the dashboard and name it, to have it available.
A basic example of this dashboard with a panel per component is delivered with Aura, so it can be imported in the Kibana of the environment using kibana import objects API.
2 - Basic database queries
Basic database queries
Learn how to get information from the database to get some insights
Requirements
-
A valid kubeconfig for the environment
-
If the environment database is in Atlas: access to Atlas by IP
-
Get the variables to access the database:
# substitute {{aura-environment}} with the environment you're configuring
export AURA_ENVIRONMENT={{aura-environment}}

$ kubectl -n $AURA_ENVIRONMENT get cm authentication-api -o json | jq -r ".data.AURA_MONGODB_URI"

{{mongo_uri}}

$ kubectl -n $AURA_ENVIRONMENT get cm authentication-api -o json | jq -r ".data.AURA_MONGODB_USERNAME"

{{mongo_user}}

$ kubectl -n $AURA_ENVIRONMENT get secret authentication-api -o json | jq -r ".data.AURA_MONGODB_PASSWORD|@base64d"

{{mongo_pass}}

$ kubectl -n $AURA_ENVIRONMENT get cm authentication-api -o json | jq -r ".data.AURA_MONGODB_USER_DB"

{{mongo_users_db}}

$ kubectl -n $AURA_ENVIRONMENT get cm authentication-api -o json | jq -r ".data.AURA_MONGODB_USER_COLLECTION"

{{mongo_users_col}}
-
Get the channel_name and channel_id for the all channels in the environment:
# substitue {{aura-environment}} with the environment you're configuring
export AURA_ENVIRONMENT={{aura-environment}}

$ kubectl -n $AURA_ENVIRONMENT get cm aura-bot -o json | jq -r ".data.AURA_CHANNELS_CONFIGURATION_API_ENDPOINT"

{{channels_configuration_endpoint}}

$ kubectl -n $AURA_ENVIRONMENT get secret aura-bot -o json | jq -r ".data.AURA_AUTHORIZATION_HEADER|@base64d"

{{authorization_header}}

$ curl {{channels_configuration_endpoint}}/aura-services/v2/configuration/channels -H "Authorization: {{authorization_header}}" -o channels_config.json

$ cat channels_config.json| jq -r '.[] | .name + ":" +.id'
{{ channels }}

# Example of channels
# novum-mytelco:45494a5b-835a-4fff-a813-b3d2be529dbe
# whatsapp:f7fd1021-41cd-588a-a461-387cc24be223
# whatsapp-1004:e75e7b9d-7949-451a-9493-3d759745492c
# movistar-plus:60f0ffda-e58a-4a96-aad9-d42be70b7b42
# set-top-box:814bc401-7743-47d3-957b-7f1b2dafe398
# set-top-box-haac:dc388448-b1d1-11e9-b77b-67224ed60908
Queries
Total number of users registered in Aura
⚠️ This information is only for authenticated users. Currently, anonymous users are not stored in the Aura users’ database.
$ mongo -u {{mongo_user}} -p {{mongo_pass}} {{mongo_uri}}
> use {{mongo_users_db}}
> db.{{mongo_users_col}}.find({}).count()
10167
Total number of users registered in aura per channel
⚠️ This information is only for authenticated users. Currently, anonymous users are not stored in the Aura users’ database.
Use the output of {{ channels }} to identify the channel by its name rather than by its identifier.
$ mongo -u {{mongo_user}} -p {{mongo_pass}} {{mongo_uri}}
> use {{mongo_users_db}}
> db.{{mongo_users_col}}.aggregate([
    {"$group" : {_id: "$channelId", count: {$sum:1}}}
])
{ "_id" : "981e5db7-8031-4370-a326-b6f4d163cd82", "count" : 1 }
{ "_id" : "814bc401-7743-47d3-957b-7f1b2dafe398", "count" : 21 }
{ "_id" : "189d4016-bcd0-491d-a75e-64e7a54aa75c", "count" : 1 }
{ "_id" : "b2501583-6d76-4e77-b364-aa169490efec", "count" : 1 }
{ "_id" : "b94aec9a-da4d-46de-afc3-06cfe0157888", "count" : 1 }
{ "_id" : "60f0ffda-e58a-4a96-aad9-d42be70b7b42", "count" : 22 }
{ "_id" : "e75e7b9d-7949-451a-9493-3d759745492c", "count" : 2518 }
{ "_id" : "9924335b-321a-4f48-b820-e35c7eb9e58b", "count" : 1 }
{ "_id" : "dc388448-b1d1-11e9-b77b-67224ed60908", "count" : 69 }
{ "_id" : "f7fd1021-41cd-588a-a461-387cc24be223", "count" : 2062 }
{ "_id" : "e59aa30f-bae5-4c9e-9d1a-0be8b904711d", "count" : 1 }
{ "_id" : "45494a5b-835a-4fff-a813-b3d2be529dbe", "count" : 346 }
{ "_id" : "5ad28380-85fa-4ba2-bcdb-0732127f4a85", "count" : 4792 }
{ "_id" : "ecd189c2-b1dd-4142-bbe1-eb9549b327e2", "count" : 1 }
{ "_id" : "25695326-c67c-40fe-b5df-a8fd5b4deb22", "count" : 14 }
{ "_id" : "4c14973e-3369-4c6a-b59d-e3e0ecaed78c", "count" : 291 }
Total number of users with expired authorization_id
An authorization_id is expired if it has not been used for 180 days in a row.
$ mongo -u {{mongo_user}} -p {{mongo_pass}} {{mongo_uri}}
> use {{mongo_users_db}}
> db.{{mongo_users_col}}.find({lastAccess: {
        $lt: new Date(ISODate().getTime() - 180*24*60*60*1000)
    }
}).count()
3034