Aura system dashboards
Grafana dashboards with metrics related to the performance of Aura system
Introduction
Currently, these are the available Aura system dashboards in Grafana based on metrics stored in Prometheus:
This is the multi-page printable view of this section. Click here to print.
Grafana dashboards with metrics related to the performance of Aura system
Currently, these are the available Aura system dashboards in Grafana based on metrics stored in Prometheus:
Information provided by Alertmanager dashboards
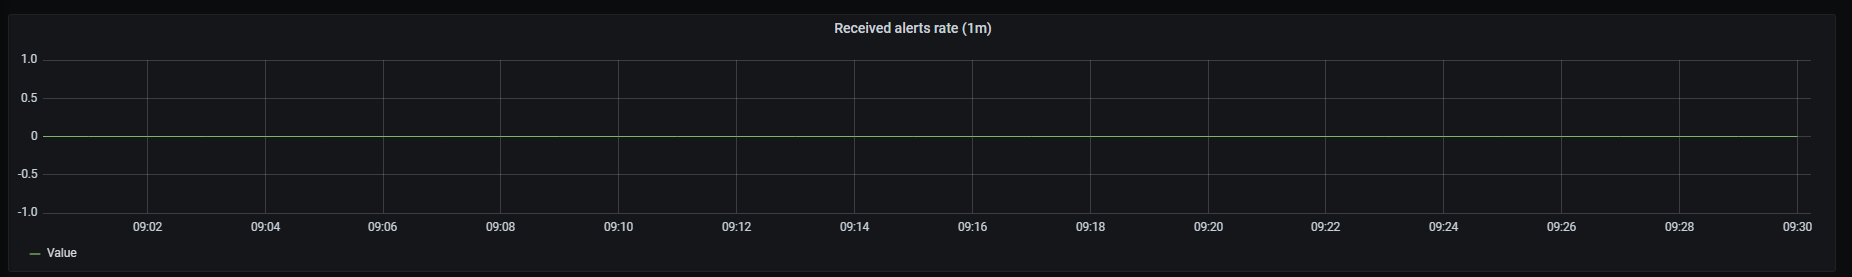
It shows a time series with the received alerts rate aggregated by one minute.
The x-axis shows the time series and the y-axis shows received alerts rate.
The queries used to get the panel information are:
sum(rate(prometheus_notifications_alertmanagers_discovered[1m])) by(status)
An example of this panel is shown below:
The available metrics are defined in the following sections.
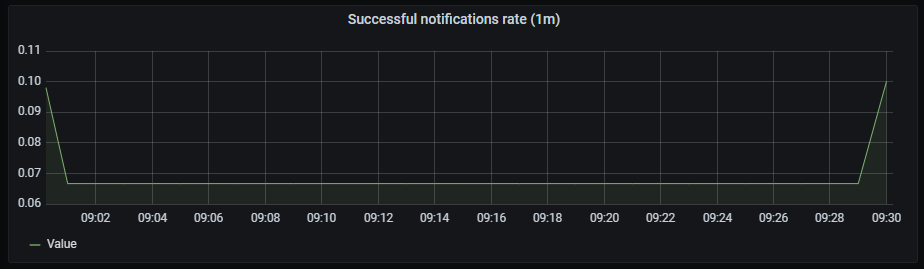
It shows a time series with the successful notifications rate aggregated by one minute.
The x-axis shows the time series and the y-axis shows the successful notifications rate.
The queries used to get the panel information are:
sum(rate(prometheus_notifications_sent_total[1m])) by(integration)
An example of this panel is shown below:
It shows a time series with the failed notifications rate aggregated by one minute.
The x-axis shows the time series and the y-axis shows the failed notifications rate.
The queries used to get panel information are:
sum(rate(prometheus_notifications_errors_total[1m])) by(integration)
An example of this panel is shown below:
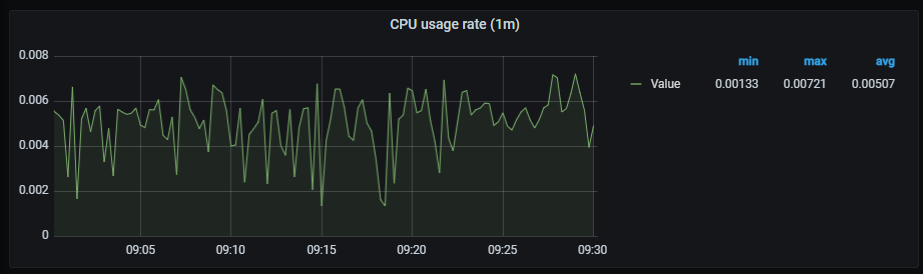
It shows a time series with the CPU usage rate aggregated by one minute. It also shows the current minimum, maximum and average cpu consumption of alertmanager.
The x-axis shows the time series and the y-axis shows the CPU usage rate.
The queries used to get panel information are:
sum(rate(container_cpu_usage_seconds_total{container="alertmanager"}[1m])) by (pod_name)
An example of this panel is shown below:
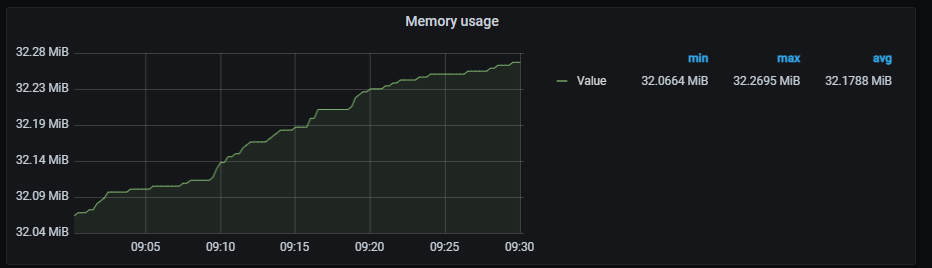
It shows a time series with the memory usage. It also shows the current minimum, maximum and average memory consumption of alertmanager.
The x-axis shows the time series and the y-axis shows the memory usage.
The queries used to get panel information are:
sum (container_memory_working_set_bytes{container="alertmanager"}) by (pod_name)
An example of this panel is shown below:
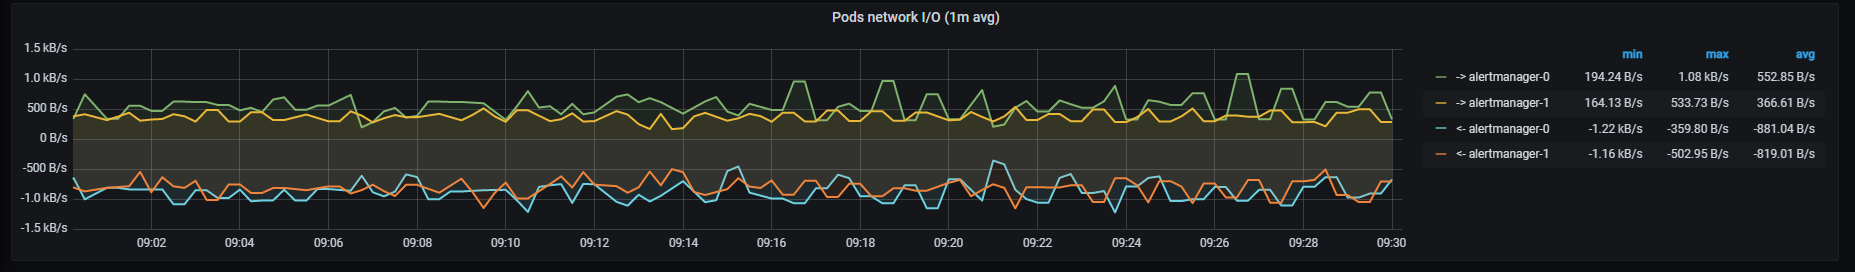
It shows a time series with the network I/O average aggregated by one minute. It also shows the current minimum, maximum and average network I/O.
The x-axis shows the time series and the y-axis shows the network usage.
The queries used to get panel information are:
sum (rate (container_network_receive_bytes_total{pod!="",pod=~"alertmanager.*"}[1m])) by (pod)
- sum (rate (container_network_transmit_bytes_total{pod!="",pod=~"alertmanager.*"}[1m])) by (pod)
An example of this panel is shown below:
Information provided by Elasticsearch dashboard
Elastic dashboard monitors multiple data, service and system related metrics.
The different graphs are shown in the following sections:
The current section includes cluster related graphs.
Code coloured indicator of cluster health.
Metrics:
((sum(elasticsearch_cluster_health_status{color="green"})*2)+sum(elasticsearch_cluster_health_status{color="yellow"}))/count(elasticsearch_index_stats_up)
Number of nodes.
Metrics:
count(elasticsearch_index_stats_up)
Number of data nodes per node.
Metrics:
sum(elasticsearch_cluster_health_number_of_data_nodes{cluster="elasticsearch"})/count(elasticsearch_index_stats_up)
Pending tasks per node.
Metrics:
sum(elasticsearch_cluster_health_number_of_pending_tasks{cluster="elasticsearch"})/count(elasticsearch_index_stats_up)

Shards related graphs.
Number of active primary shards per node.
Metrics:
sum(elasticsearch_cluster_health_active_primary_shards{cluster="elasticsearch"})/count(elasticsearch_index_stats_up)
Number of active shards per node.
Metrics:
sum(elasticsearch_cluster_health_active_shards{cluster="elasticsearch"})/count(elasticsearch_index_stats_up)
Number of shards initializing per node.
Metrics:
sum(elasticsearch_cluster_health_initializing_shards{cluster="elasticsearch"})/count(elasticsearch_index_stats_up)
Number of relocating shards per node.
Metrics:
sum(elasticsearch_cluster_health_relocating_shards{cluster="elasticsearch"})/count(elasticsearch_index_stats_up)
Number of unassigned shards per node.
Metrics:
sum(elasticsearch_cluster_health_delayed_unassigned_shards{cluster="elasticsearch"})/count(elasticsearch_index_stats_up)

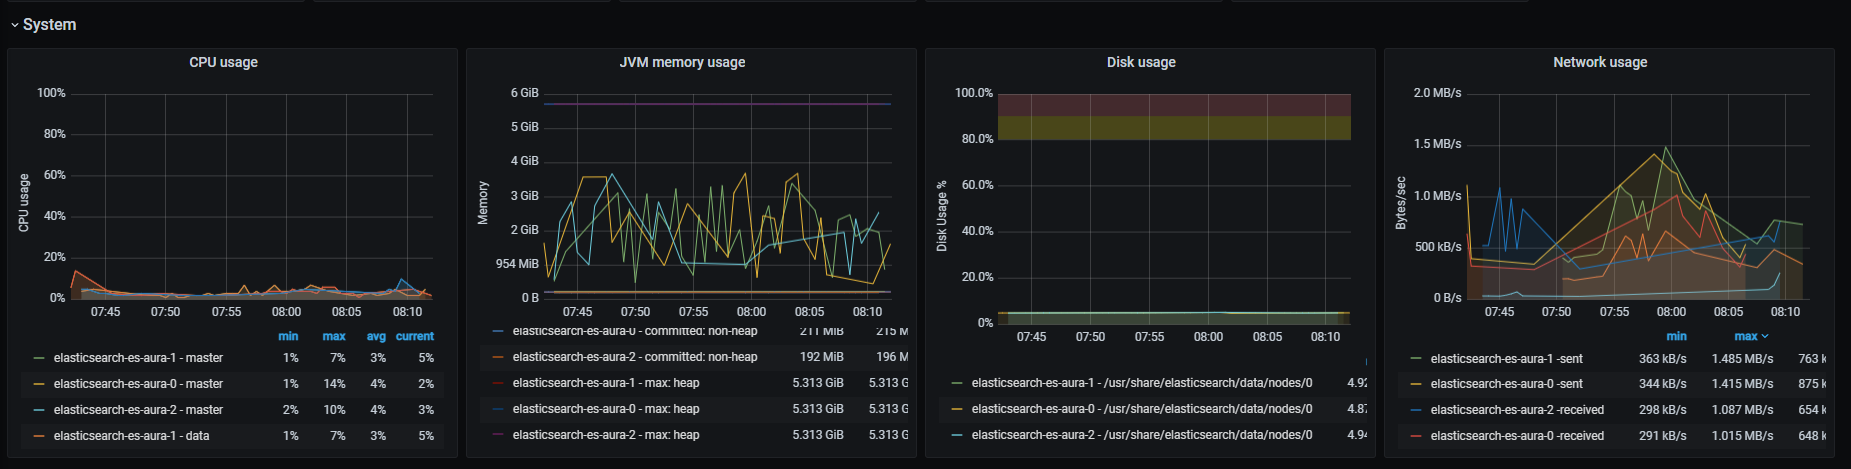
System related graphs.
Percentage of used CPU on master and data nodes.
Metrics: It includes two metrics:
elasticsearch_process_cpu_percent{cluster="elasticsearch",es_master_node="true",name=~"(elasticsearch-es-aura-0|elasticsearch-es-aura-1|elasticsearch-es-aura-2)"}
elasticsearch_process_cpu_percent{cluster="elasticsearch",es_data_node="true",name=~"(elasticsearch-es-aura-0|elasticsearch-es-aura-1|elasticsearch-es-aura-2)"}
Memory used by JVM graph in bytes.
Metrics:
It includes three metrics:
elasticsearch_jvm_memory_used_bytes{cluster="elasticsearch",name=~"(elasticsearch-es-aura-0|elasticsearch-es-aura-1|elasticsearch-es-aura-2)",name=~"(elasticsearch-es-aura-0|elasticsearch-es-aura-1|elasticsearch-es-aura-2)"}
elasticsearch_jvm_memory_committed_bytes{cluster="elasticsearch",name=~"(elasticsearch-es-aura-0|elasticsearch-es-aura-1|elasticsearch-es-aura-2)",name=~"(elasticsearch-es-aura-0|elasticsearch-es-aura-1|elasticsearch-es-aura-2)"}
elasticsearch_jvm_memory_max_bytes{cluster="elasticsearch",name=~"(elasticsearch-es-aura-0|elasticsearch-es-aura-1|elasticsearch-es-aura-2)",name=~"(elasticsearch-es-aura-0|elasticsearch-es-aura-1|elasticsearch-es-aura-2)"}
Disk usage in bytes.
Metrics:
1-(elasticsearch_filesystem_data_available_bytes{cluster="elasticsearch"}/elasticsearch_filesystem_data_size_bytes{cluster="elasticsearch",name=~"(elasticsearch-es-aura-0|elasticsearch-es-aura-1|elasticsearch-es-aura-2)"})
Bytes rate sent and received, aggregated by one minute.
Metrics: It includes two metrics:
irate(elasticsearch_transport_tx_size_bytes_total{cluster="elasticsearch",name=~"(elasticsearch-es-aura-0|elasticsearch-es-aura-1|elasticsearch-es-aura-2)"}[1m])
irate(elasticsearch_transport_rx_size_bytes_total{cluster="elasticsearch",name=~"(elasticsearch-es-aura-0|elasticsearch-es-aura-1|elasticsearch-es-aura-2)"}[1m])
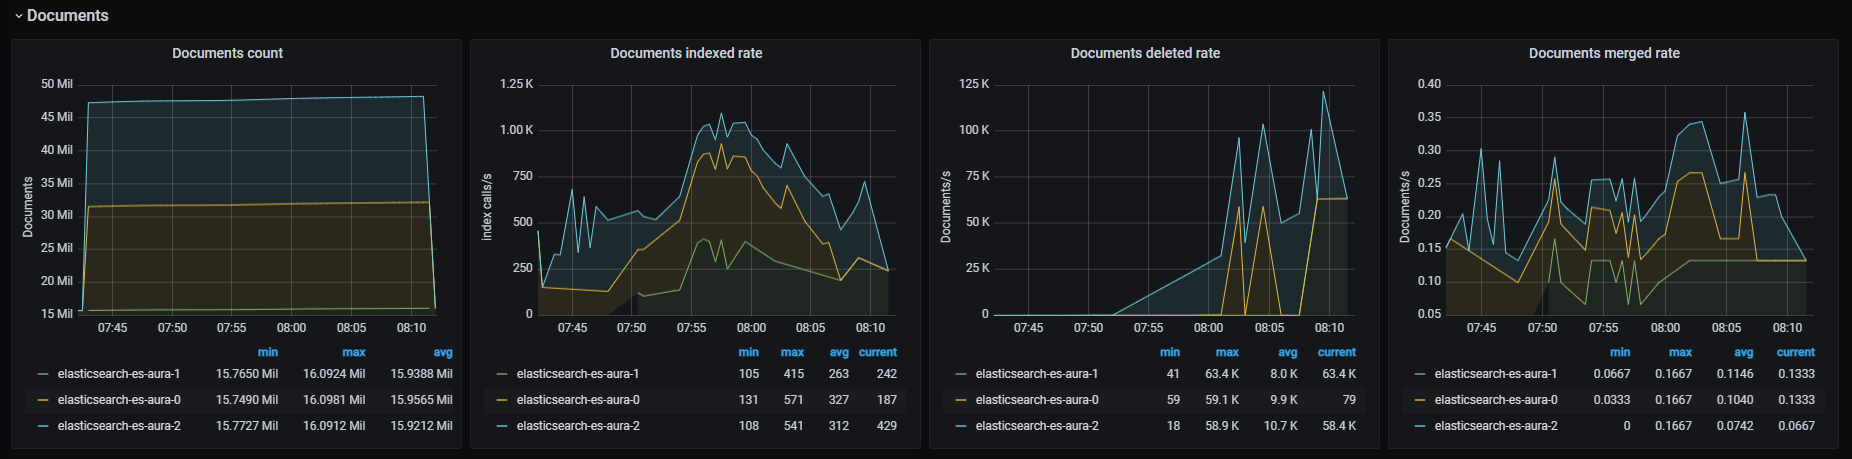
Documents state related graphs.
Number of documents in cluster.
Metrics:
elasticsearch_indices_docs{cluster="elasticsearch",name=~"(elasticsearch-es-aura-0|elasticsearch-es-aura-1|elasticsearch-es-aura-2)"}
Rate of indexed documents, aggregated by one minute.
Metrics:
irate(elasticsearch_indices_indexing_index_total{cluster="elasticsearch",name=~"(elasticsearch-es-aura-0|elasticsearch-es-aura-1|elasticsearch-es-aura-2)"}[1m])
Rate of deleted documents, aggregated by one minute.
Metrics:
rate(elasticsearch_indices_docs_deleted{cluster="elasticsearch",name=~"(elasticsearch-es-aura-0|elasticsearch-es-aura-1|elasticsearch-es-aura-2)"}[1m])
Rate of merged documents, aggregated by one minute.
Metrics:
rate(elasticsearch_indices_merges_total{cluster="elasticsearch",name=~"(elasticsearch-es-aura-0|elasticsearch-es-aura-1|elasticsearch-es-aura-2)"}[1m])
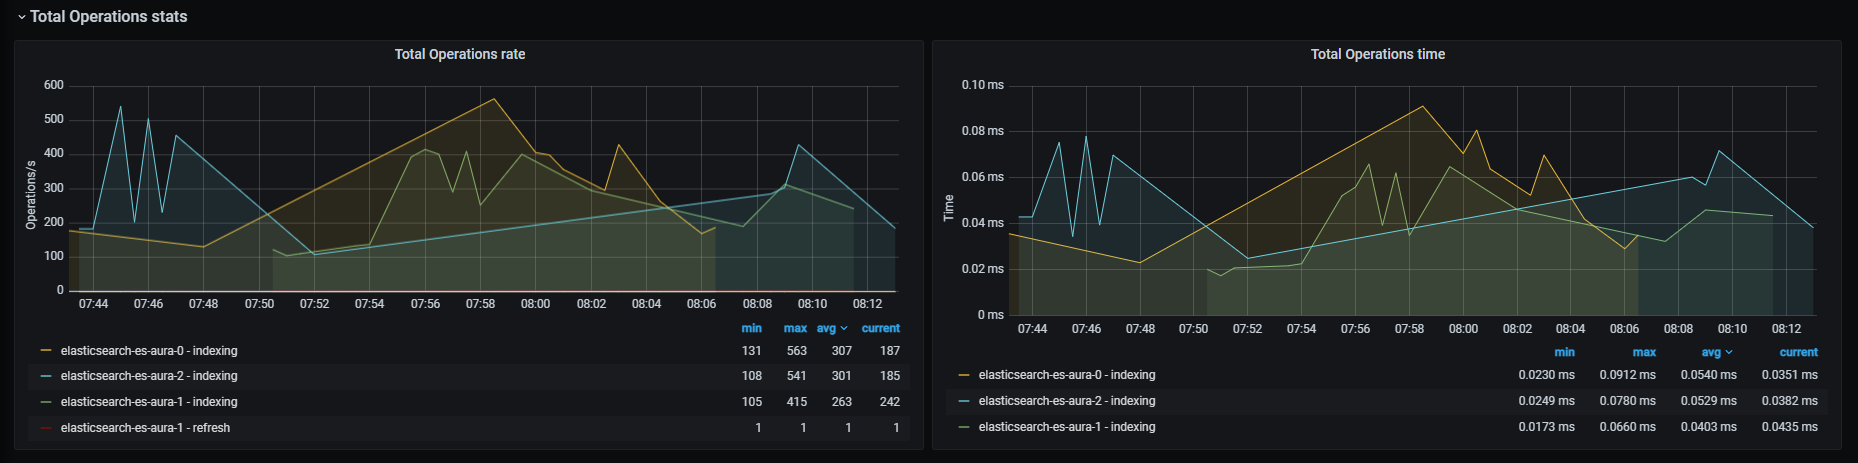
Data related to total operations.
Total operations number rate, aggregated by one minute.
Metrics: It includes six metrics:
irate(elasticsearch_indices_indexing_index_total{cluster="elasticsearch",name=~"(elasticsearch-es-aura-0|elasticsearch-es-aura-1|elasticsearch-es-aura-2)"}[1m])
irate(elasticsearch_indices_search_query_total{cluster="elasticsearch",name=~"(elasticsearch-es-aura-0|elasticsearch-es-aura-1|elasticsearch-es-aura-2)"}[1m])
irate(elasticsearch_indices_search_fetch_total{cluster="elasticsearch",name=~"(elasticsearch-es-aura-0|elasticsearch-es-aura-1|elasticsearch-es-aura-2)"}[1m])
irate(elasticsearch_indices_merges_total{cluster="elasticsearch",name=~"(elasticsearch-es-aura-0|elasticsearch-es-aura-1|elasticsearch-es-aura-2)"}[1m])
irate(elasticsearch_indices_refresh_total{cluster="elasticsearch",name=~"(elasticsearch-es-aura-0|elasticsearch-es-aura-1|elasticsearch-es-aura-2)"}[1m])
irate(elasticsearch_indices_flush_total{cluster="elasticsearch",name=~"(elasticsearch-es-aura-0|elasticsearch-es-aura-1|elasticsearch-es-aura-2)"}[1m])
Time rate for the different operations in milliseconds, aggregated by one minute.
Metrics: It includes six metrics:
irate(elasticsearch_indices_indexing_index_time_seconds_total{cluster="elasticsearch",name=~"(elasticsearch-es-aura-0|elasticsearch-es-aura-1|elasticsearch-es-aura-2)"}[1m])
irate(elasticsearch_indices_search_query_time_ms_total{cluster="elasticsearch",name=~"(elasticsearch-es-aura-0|elasticsearch-es-aura-1|elasticsearch-es-aura-2)"}[1m])
irate(elasticsearch_indices_search_fetch_time_ms_total{cluster="elasticsearch",name=~"(elasticsearch-es-aura-0|elasticsearch-es-aura-1|elasticsearch-es-aura-2)"}[1m])
irate(elasticsearch_indices_merges_total_time_ms_total{cluster="elasticsearch",name=~"(elasticsearch-es-aura-0|elasticsearch-es-aura-1|elasticsearch-es-aura-2)"}[1m])
irate(elasticsearch_indices_refresh_total_time_ms_total{cluster="elasticsearch",name=~"(elasticsearch-es-aura-0|elasticsearch-es-aura-1|elasticsearch-es-aura-2)"}[1m])
irate(elasticsearch_indices_flush_time_ms_total{cluster="elasticsearch",name=~"(elasticsearch-es-aura-0|elasticsearch-es-aura-1|elasticsearch-es-aura-2)"}[1m])
Graphs related to elapsed times of different actions.
Time rate for search query operations in seconds, aggregated by one minute.
Metrics:
rate(elasticsearch_indices_search_query_time_seconds{cluster="elasticsearch",name=~"(elasticsearch-es-aura-0|elasticsearch-es-aura-1|elasticsearch-es-aura-2)"}[1m])
Time rate for indexing index operations in seconds, aggregated by one minute.
Metrics:
rate(elasticsearch_indices_indexing_index_time_seconds_total{cluster="elasticsearch",name=~"(elasticsearch-es-aura-0|elasticsearch-es-aura-1|elasticsearch-es-aura-2)"}[1m])
Time rate for merge operations in seconds, aggregated by one minute.
Metrics:
rate(elasticsearch_indices_merges_total_time_seconds_total{cluster="elasticsearch",name=~"(elasticsearch-es-aura-0|elasticsearch-es-aura-1|elasticsearch-es-aura-2)"}[1m])
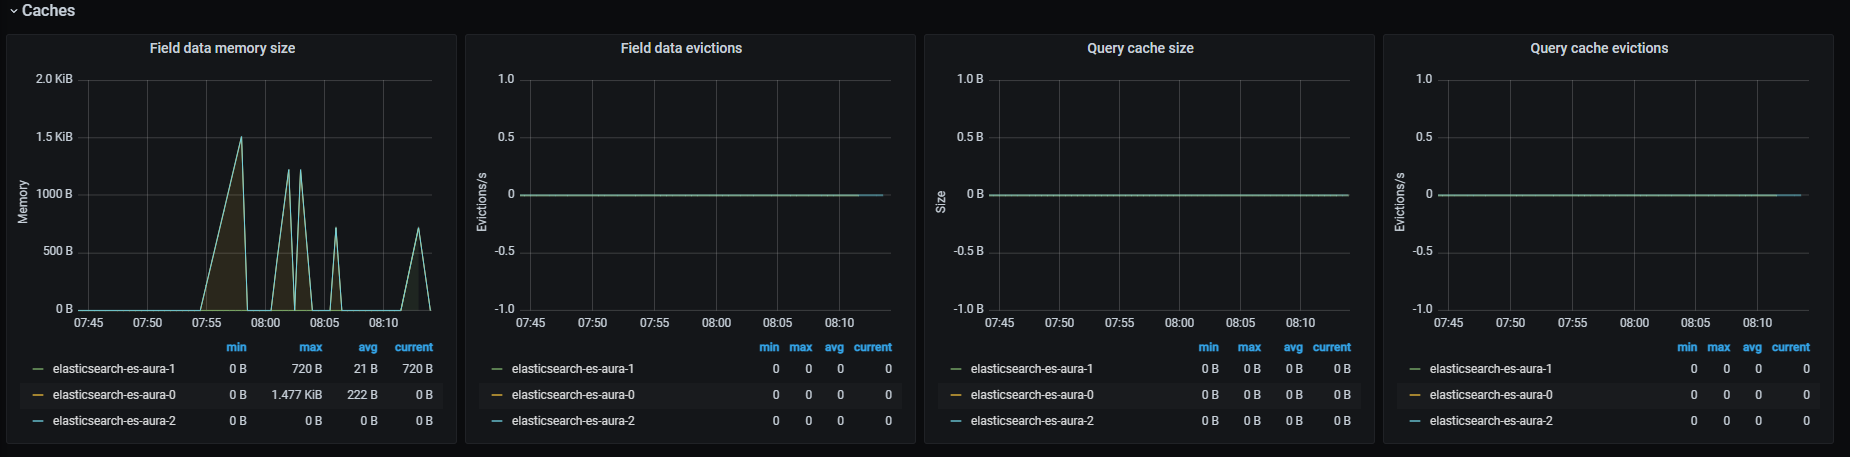
Graphs related to caches metrics.
Field data memory size in bytes.
Metrics:
elasticsearch_indices_fielddata_memory_size_bytes{cluster="elasticsearch",name=~"(elasticsearch-es-aura-0|elasticsearch-es-aura-1|elasticsearch-es-aura-2)"}
Rate of field data evicted, aggregated by one minute.
Metrics:
rate(elasticsearch_indices_fielddata_evictions{cluster="elasticsearch",name=~"(elasticsearch-es-aura-0|elasticsearch-es-aura-1|elasticsearch-es-aura-2)"}[1m])
Bytes of memory occupied by cached queries.
Metrics:
elasticsearch_indices_query_cache_memory_size_bytes{cluster="elasticsearch",name=~"(elasticsearch-es-aura-0|elasticsearch-es-aura-1|elasticsearch-es-aura-2)"}
Rate of queries evicted, aggregated by one minute.
Metrics:
rate(elasticsearch_indices_query_cache_evictions{cluster="elasticsearch",name=~"(elasticsearch-es-aura-0|elasticsearch-es-aura-1|elasticsearch-es-aura-2)"}[1m])
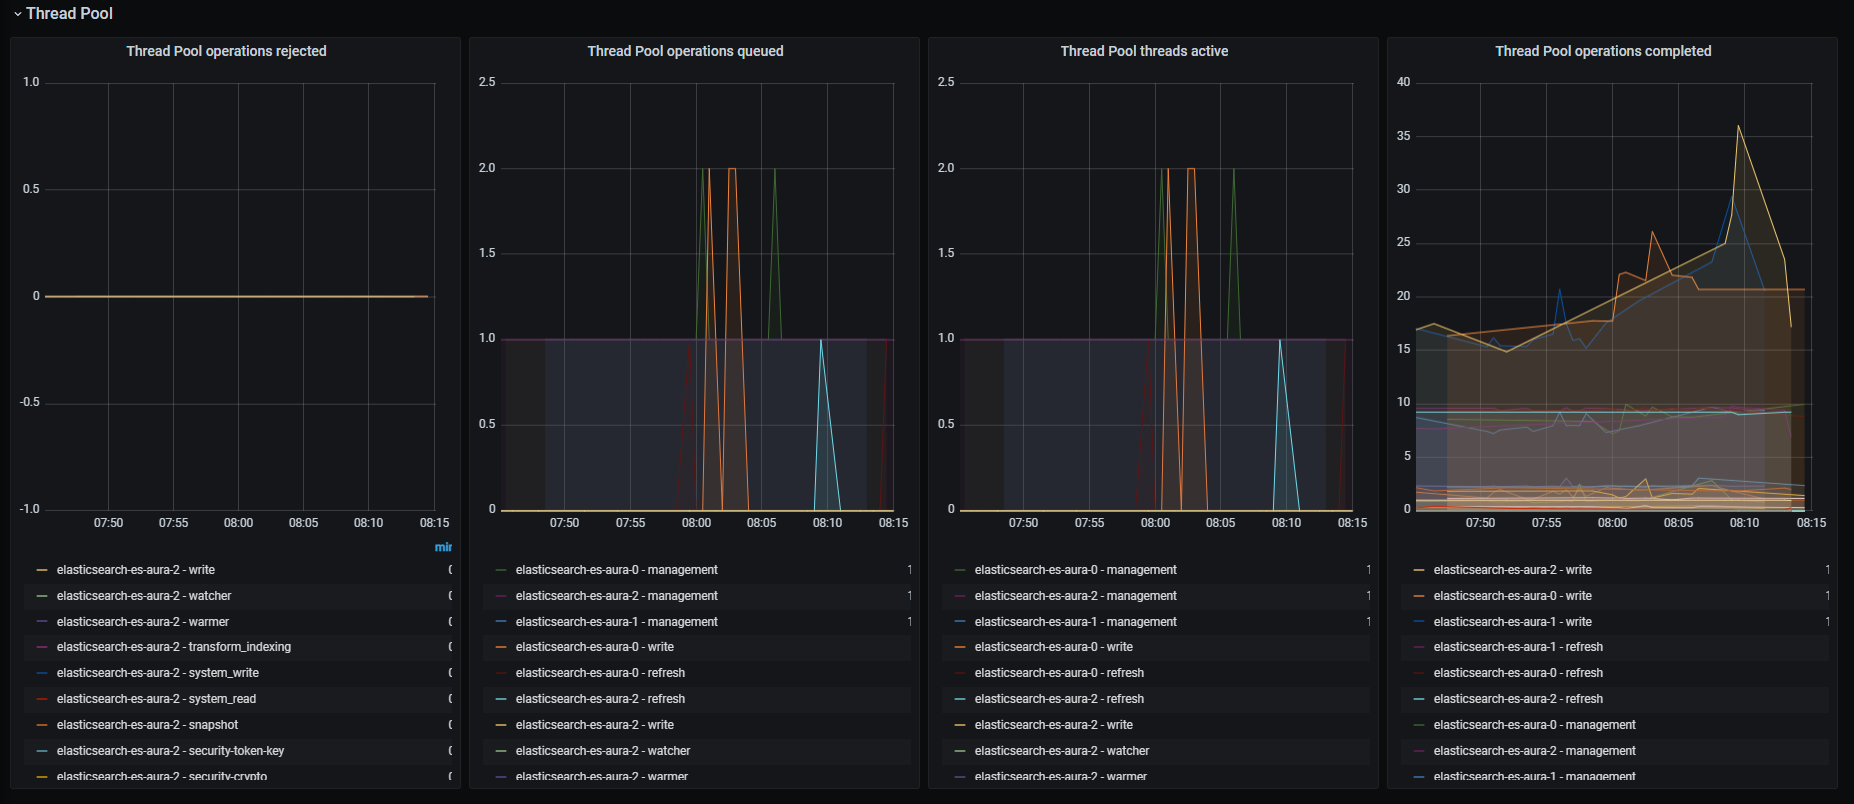
Graphs related to the thread pool.
Rate of rejected operations, aggregated by one minute.
Metrics:
irate(elasticsearch_thread_pool_rejected_count{cluster="elasticsearch",name=~"(elasticsearch-es-aura-0|elasticsearch-es-aura-1|elasticsearch-es-aura-2)"}[1m])
Rate of queued operations, aggregated by one minute.
Metrics:
elasticsearch_thread_pool_active_count{cluster="elasticsearch",name=~"(elasticsearch-es-aura-0|elasticsearch-es-aura-1|elasticsearch-es-aura-2)"}
Number of active threads.
Metrics:
elasticsearch_thread_pool_active_count{cluster="elasticsearch",name=~"(elasticsearch-es-aura-0|elasticsearch-es-aura-1|elasticsearch-es-aura-2)"}
Shows rate of completed operations, aggregated by one minute
Metrics:
irate(elasticsearch_thread_pool_completed_count{cluster="elasticsearch",name=~"(elasticsearch-es-aura-0|elasticsearch-es-aura-1|elasticsearch-es-aura-2)"}[1m])
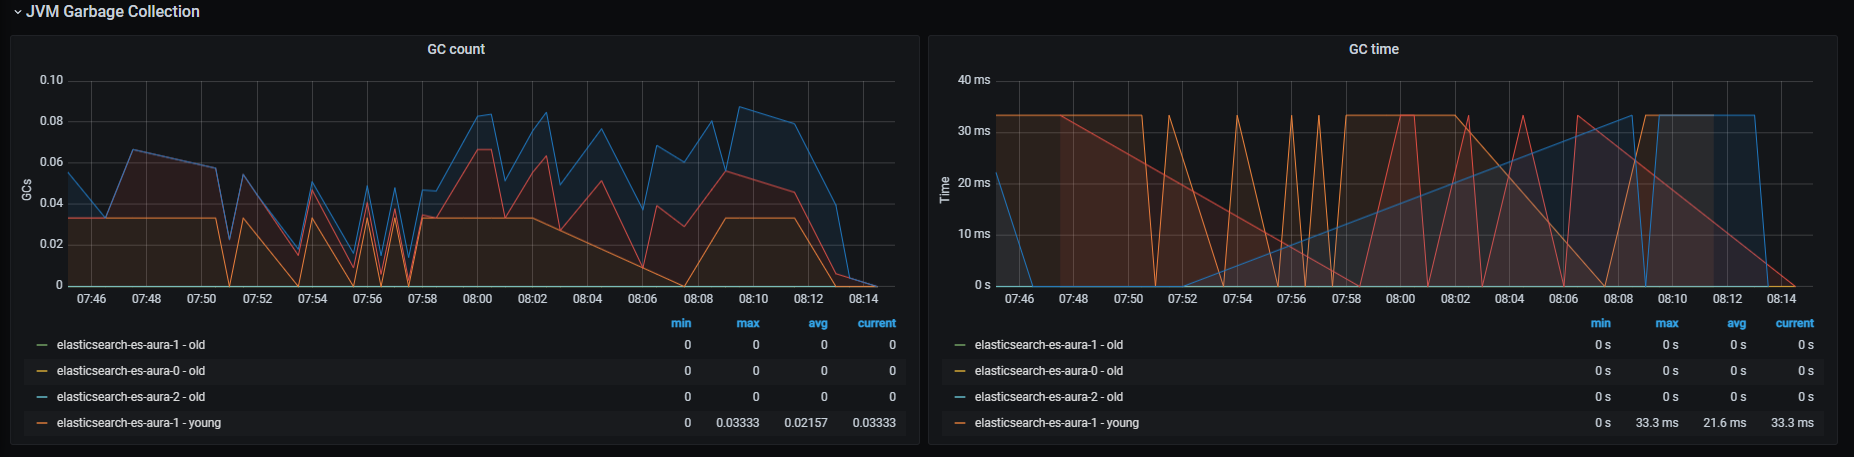
Graphs related to JVM garbage collector activity.
Rate of GC count, aggregated by one minute.
Metrics:
rate(elasticsearch_jvm_gc_collection_seconds_count{cluster="elasticsearch",name=~"(elasticsearch-es-aura-0|elasticsearch-es-aura-1|elasticsearch-es-aura-2)"}[1m])
Rate of GC execution time, aggregated by one minute.
Metrics:
rate(elasticsearch_jvm_gc_collection_seconds_count{cluster="elasticsearch",name=~"(elasticsearch-es-aura-0|elasticsearch-es-aura-1|elasticsearch-es-aura-2)"}[1m])
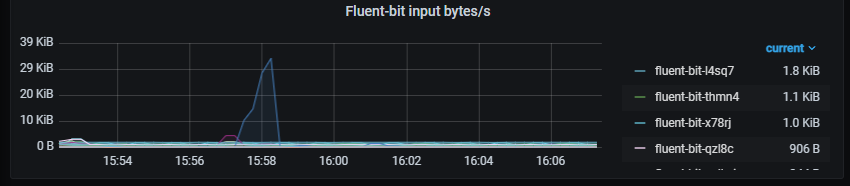
Information provided by Fluent bit dashboard
Fluent bit dashboard monitors system metrics related to fluent bit.
The available metrics are defined in the following sections.
Input bytes rate, aggregated by one minute.
Metrics:
rate(fluentbit_input_bytes_total[1m])
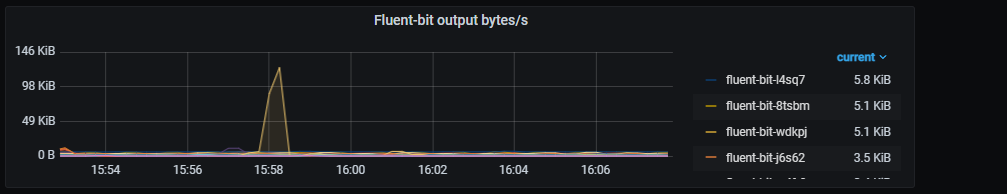
Output bytes rate, aggregated by one minute.
Metrics:
rate(fluentbit_output_proc_bytes_total[1m])
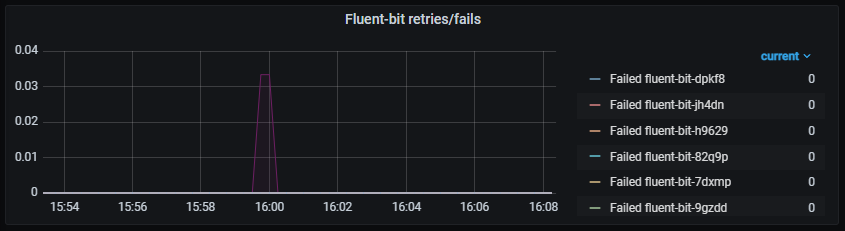
Rate of retries and fails, aggregated by one minute
Metrics:
It includes two metrics:
rate(fluentbit_output_retries_total[1m])
rate(fluentbit_output_retries_failed_total[1m])
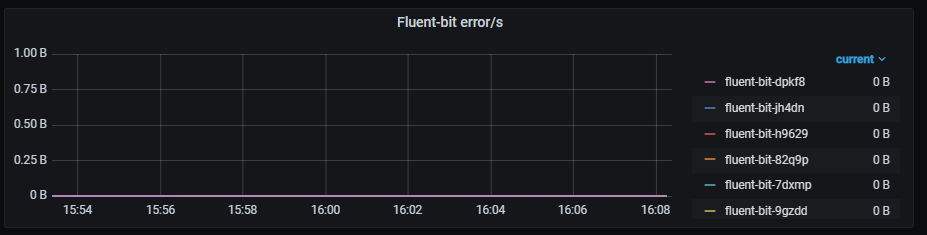
Rate of output errors, aggregated by one minute.
Metrics:
rate(fluentbit_output_errors_total[1m])
Information provided by Kubernetes cluster monitoring dashboard
Kubernetes cluster monitoring dashboard monitors multiple systems and networks related data from Kubernetes clusters.
The available metrics are defined in the following sections.
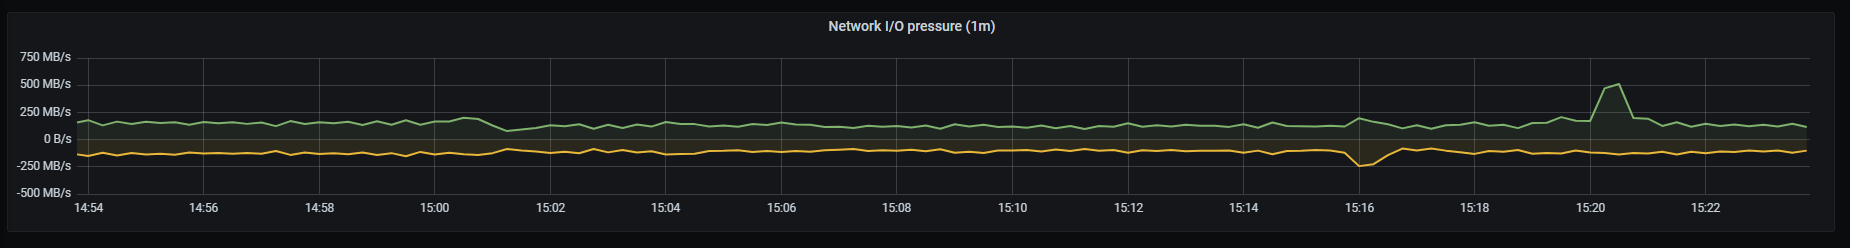
Rate of total received/sent data on all cluster containers, in bytes and aggregated by one minute.
Metrics:
It includes two metrics:
sum (rate (container_network_receive_bytes_total{kubernetes_io_hostname=~"^.*$",agentpool=~".*"}[1m]))
- sum (rate (container_network_transmit_bytes_total{kubernetes_io_hostname=~"^.*$",agentpool=~".*"}[1m]))
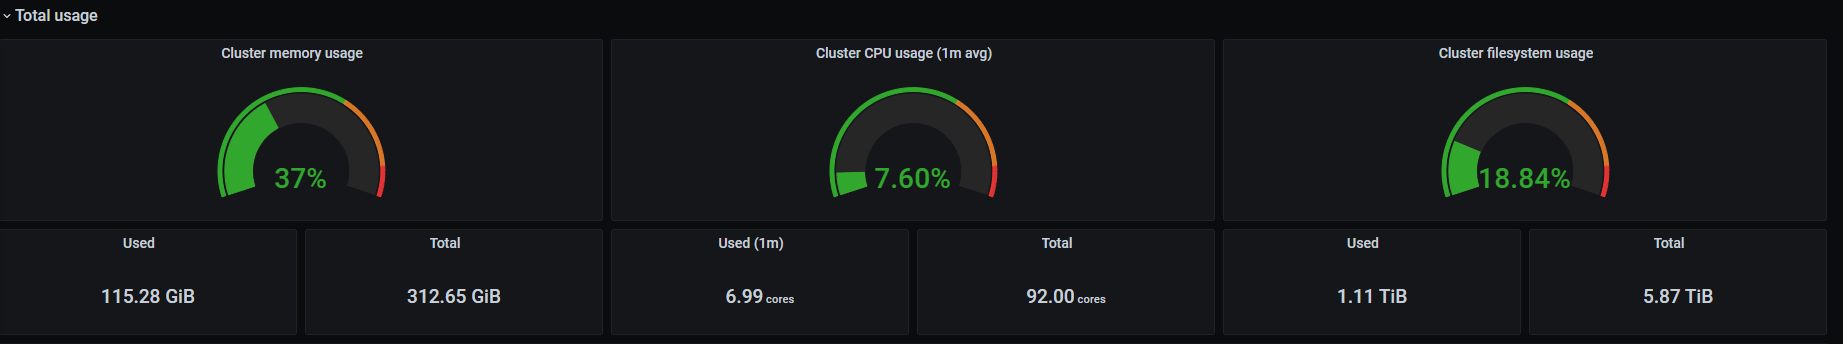
Graphs with different system parameters usage.
It is composed by three graphs:
Metrics:
It includes three metrics:
sum (container_memory_working_set_bytes{id="/",kubernetes_io_hostname=~"^.*$",agentpool=~".*"}) /
sum (machine_memory_bytes{kubernetes_io_hostname=~"^.*$",agentpool=~".*"}) * 100
sum (container_memory_working_set_bytes{id="/",kubernetes_io_hostname=~"^.*$",agentpool=~".*"})
sum (machine_memory_bytes{kubernetes_io_hostname=~"^.*$",agentpool=~".*"})
It is composed by three graphs:
Metrics:
It includes three metrics:
sum (rate (container_cpu_usage_seconds_total{id="/",kubernetes_io_hostname=~"^.*$",agentpool=~".*"}[1m])) /
sum (machine_cpu_cores{kubernetes_io_hostname=~"^.*$",agentpool=~".*"}) * 100
sum (rate (container_cpu_usage_seconds_total{id="/",kubernetes_io_hostname=~"^.*$",agentpool=~".*"}[1m]))
sum (machine_cpu_cores{kubernetes_io_hostname=~"^.*$",agentpool=~".*"})
It is composed by three graphs:
Metrics:
It includes three metrics:
sum (container_fs_usage_bytes{device=~"^/dev/.*$",id="/",kubernetes_io_hostname=~"^.*$",agentpool=~".*"}) /
sum (container_fs_limit_bytes{device=~"^/dev/.*$",id="/",kubernetes_io_hostname=~"^.*$",agentpool=~".*"}) * 100
sum (container_fs_usage_bytes{device=~"^/dev/.*$",id="/",kubernetes_io_hostname=~"^.*$",agentpool=~".*"})
sum (container_fs_limit_bytes{device=~"^/dev/.*$",id="/",kubernetes_io_hostname=~"^.*$",agentpool=~".*"})
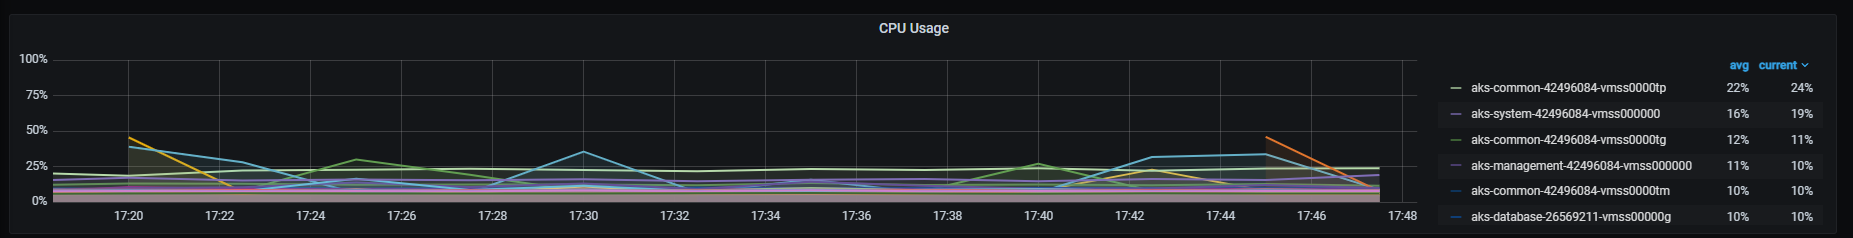
CPU usage rate, classified by pod and aggregated by one minute.
Metrics:
sum (rate (container_cpu_usage_seconds_total{image!="",name=~"^k8s_.*",kubernetes_io_hostname=~"^.*$",agentpool=~".*"}[1m])) by (pod_name)
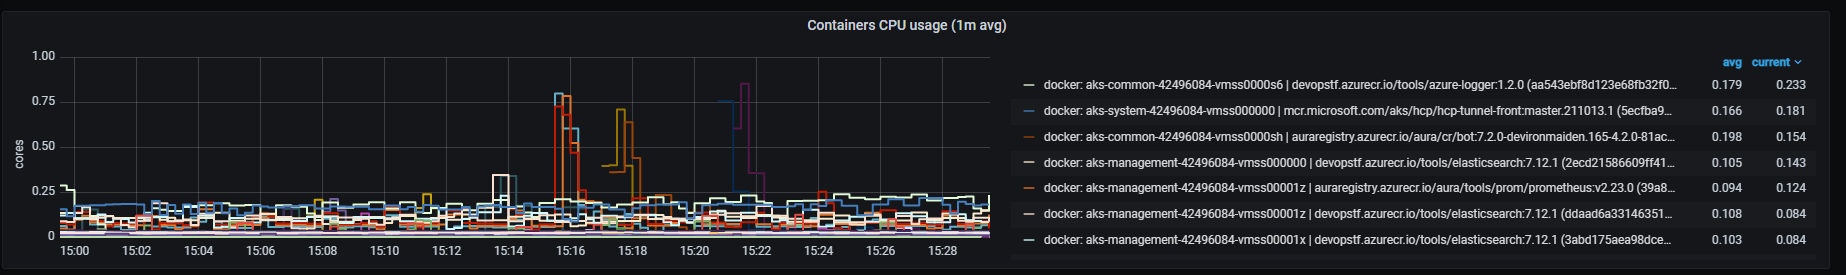
CPU usage rate, classified by container and aggregated by one minute.
Metrics:
It includes two metrics:
sum (rate (container_cpu_usage_seconds_total{image!="",name=~"^k8s_.*",kubernetes_io_hostname=~"^.*$",agentpool=~".*"}[1m])) by (pod_name)
sum (rate (container_cpu_usage_seconds_total{image!="",name!~"^k8s_.*",kubernetes_io_hostname=~"^.*$",agentpool=~".*"}[1m])) by (kubernetes_io_hostname, name, image)
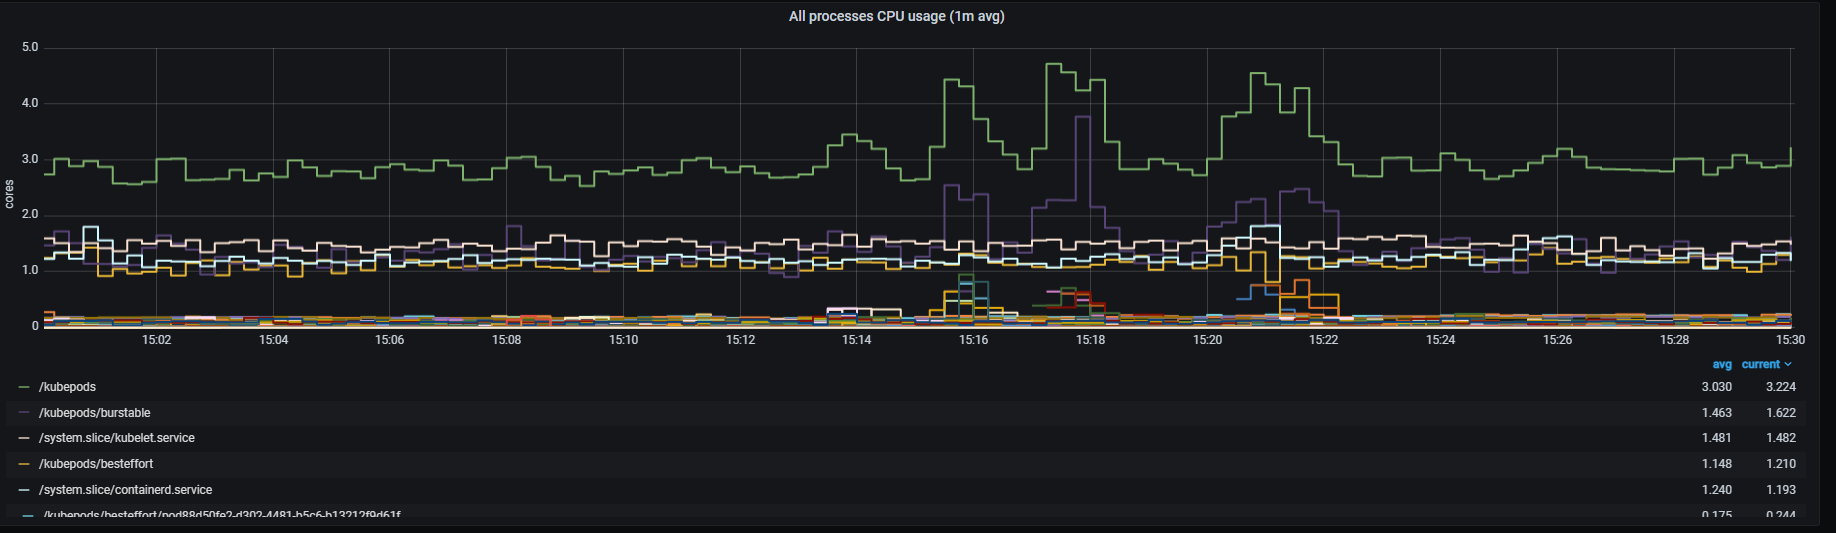
Total CPU usage rate, aggregated by one minute.
Metrics:
sum (rate (container_cpu_usage_seconds_total{id!="/",kubernetes_io_hostname=~"^.*$",agentpool=~".*"}[1m])) by (id)
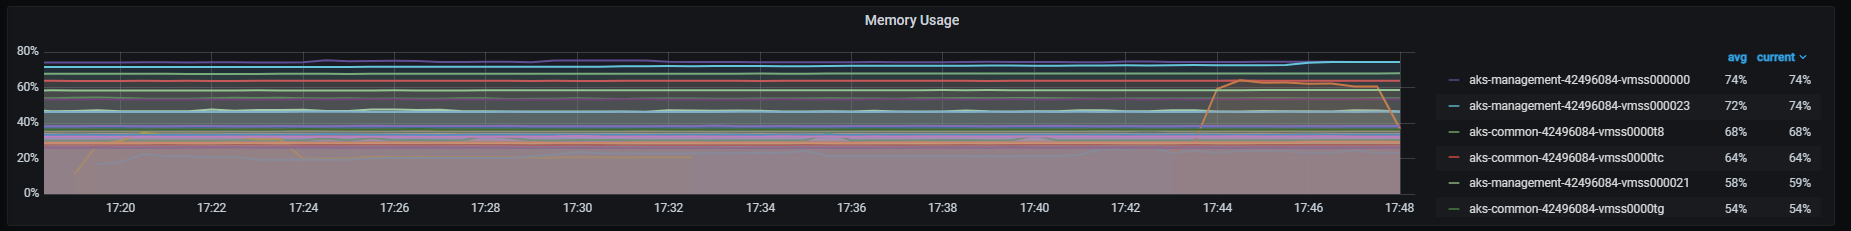
Memory usage, classified by pod.
Metrics:
sum (container_memory_working_set_bytes{image!="",name=~"^k8s_.*",kubernetes_io_hostname=~"^.*$",agentpool=~".*"}) by (pod_name)
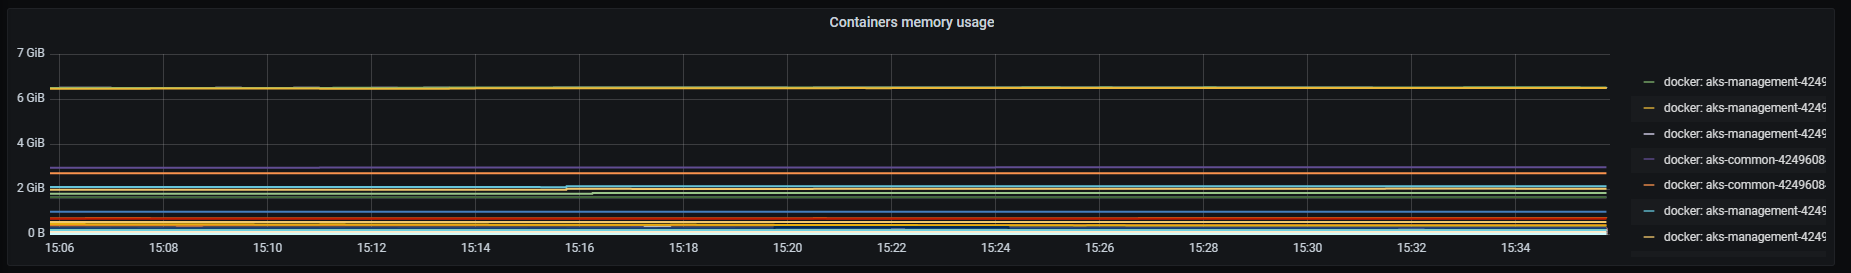
Memory usage, classified by container.
Metrics:
It includes two metrics:
sum (container_memory_working_set_bytes{image!="",name=~"^k8s_.*",container_name!="POD",kubernetes_io_hostname=~"^.*$",agentpool=~".*"}) by (container_name, pod_name)
sum (container_memory_working_set_bytes{image!="",name!~"^k8s_.*",kubernetes_io_hostname=~"^.*$",agentpool=~".*"}) by (kubernetes_io_hostname, name, image)
Total memory usage rate.
Metrics:
sum (container_memory_working_set_bytes{pod_name!="",kubernetes_io_hostname=~"^.*$",agentpool=~".*"}) by (pod_name)
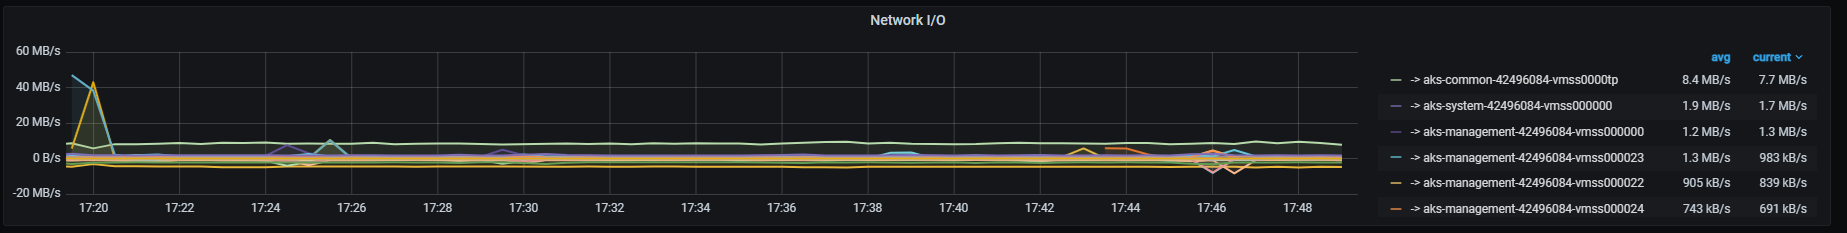
Total network received/sent usage rate, classified by pod and aggregated by one minute.
Metrics:
sum (rate (container_network_receive_bytes_total{image!="",name=~"^k8s_.*",kubernetes_io_hostname=~"^.*$",agentpool=~".*"}[1m])) by (pod_name)
- sum (rate (container_network_transmit_bytes_total{image!="",name=~"^k8s_.*",kubernetes_io_hostname=~"^.*$",agentpool=~".*"}[1m])) by (pod_name)
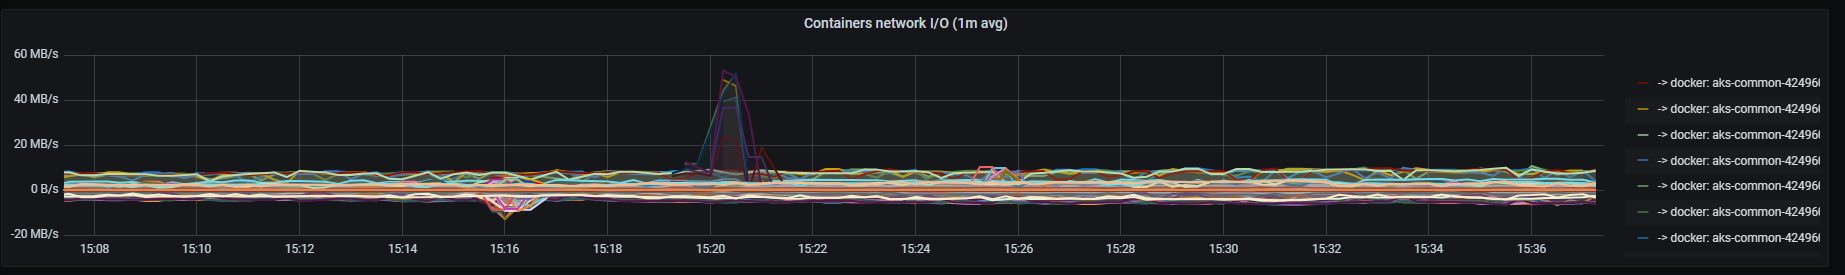
Total network received/sent usage rate, classified by container and aggregated by one minute.
Metrics:
sum (rate (container_network_receive_bytes_total{image!="",name=~"^k8s_.*",kubernetes_io_hostname=~"^.*$",agentpool=~".*"}[1m])) by (container_name, pod_name)
- sum (rate (container_network_transmit_bytes_total{image!="",name=~"^k8s_.*",kubernetes_io_hostname=~"^.*$",agentpool=~".*"}[1m])) by (container_name, pod_name)
sum (rate (container_network_receive_bytes_total{image!="",name!~"^k8s_.*",kubernetes_io_hostname=~"^.*$",agentpool=~".*"}[1m])) by (kubernetes_io_hostname, name, image)
- sum (rate (container_network_transmit_bytes_total{image!="",name!~"^k8s_.*",kubernetes_io_hostname=~"^.*$",agentpool=~".*"}[1m])) by (kubernetes_io_hostname, name, image)
Total network received/sent usage rate, aggregated by one minute.
Metrics:
sum (rate (container_network_receive_bytes_total{pod_name!="",kubernetes_io_hostname=~"^.*$",agentpool=~".*"}[1m])) by (pod_name)
- sum (rate (container_network_transmit_bytes_total{pod_name!="",kubernetes_io_hostname=~"^.*$",agentpool=~".*"}[1m])) by (pod_name)
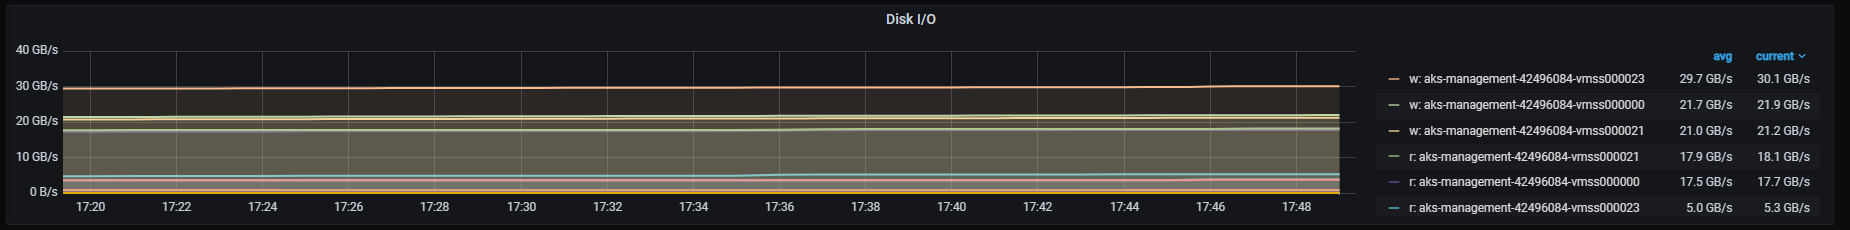
Total disk reads/writes rate, classified by pod and aggregated by one minute.
Metrics:
sum(rate(container_fs_reads_bytes_total{image!="",name=~"^k8s_.*",kubernetes_io_hostname=~"^.*$",agentpool=~".*", device!=""}[1m])) by (pod_name)
sum(rate(container_fs_writes_bytes_total{image!="",name=~"^k8s_.*",kubernetes_io_hostname=~"^.*$",agentpool=~".*", device!=""}[1m])) by (pod_name)
sum(rate(container_fs_reads_bytes_total{image!="",name=~"^k8s_.*",kubernetes_io_hostname=~"^.*$",agentpool=~".*", device=""}[1m])) by (pod_name)
sum(rate(container_fs_writes_bytes_total{image!="",name=~"^k8s_.*",kubernetes_io_hostname=~"^.*$",agentpool=~".*", device=""}[1m])) by (pod_name)
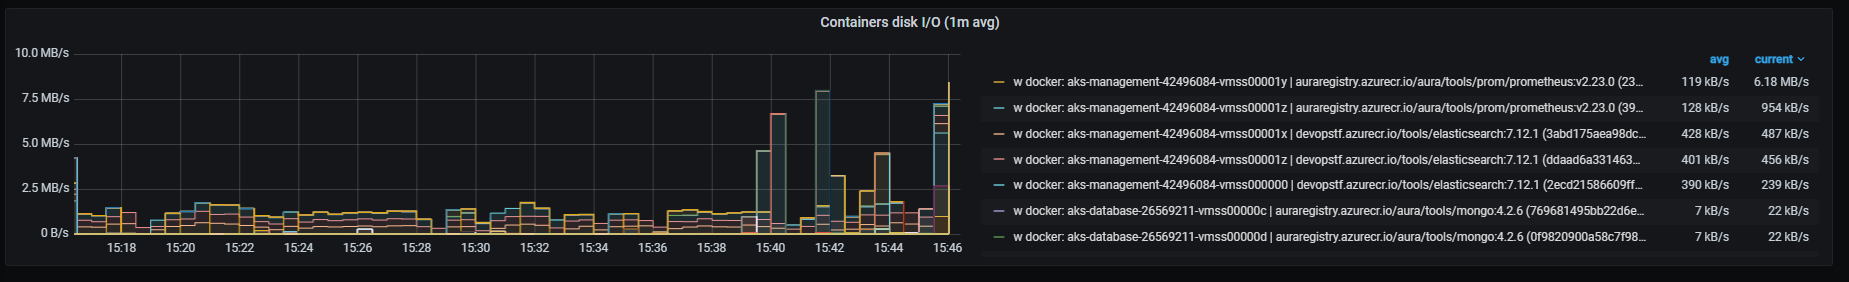
Total disk reads/writes rate, classified by container and aggregated by one minute.
Metrics:
sum(rate(container_fs_reads_bytes_total{image!="",name=~"^k8s_.*",kubernetes_io_hostname=~"^.*$",agentpool=~".*", device!=""}[1m])) by (container_name, pod_name)
sum(rate(container_fs_writes_bytes_total{image!="",name=~"^k8s_.*",kubernetes_io_hostname=~"^.*$",agentpool=~".*", device!=""}[1m])) by (container_name, pod_name)
sum(rate(container_fs_reads_bytes_total{image!="",name=~"^k8s_.*",kubernetes_io_hostname=~"^.*$",agentpool=~".*", device=""}[1m])) by (container_name, pod_name)
sum(rate(container_fs_writes_bytes_total{image!="",name=~"^k8s_.*",kubernetes_io_hostname=~"^.*$",agentpool=~".*", device=""}[1m])) by (container_name, pod_name)
sum(rate(container_fs_reads_bytes_total{image!="",name!~"^k8s_.*",kubernetes_io_hostname=~"^.*$",agentpool=~".*"}[1m])) by (kubernetes_io_hostname, name, image)
sum(rate(container_fs_writes_bytes_total{image!="",name!~"^k8s_.*",kubernetes_io_hostname=~"^.*$",agentpool=~".*"}[1m])) by (kubernetes_io_hostname, name, image)
Information provided by cron and batch job monitoring dashboard
Kubernetes cron and batch job monitoring dashboard monitors success/fail rates for cron/batch jobs.
The available metrics are defined in the following sections.
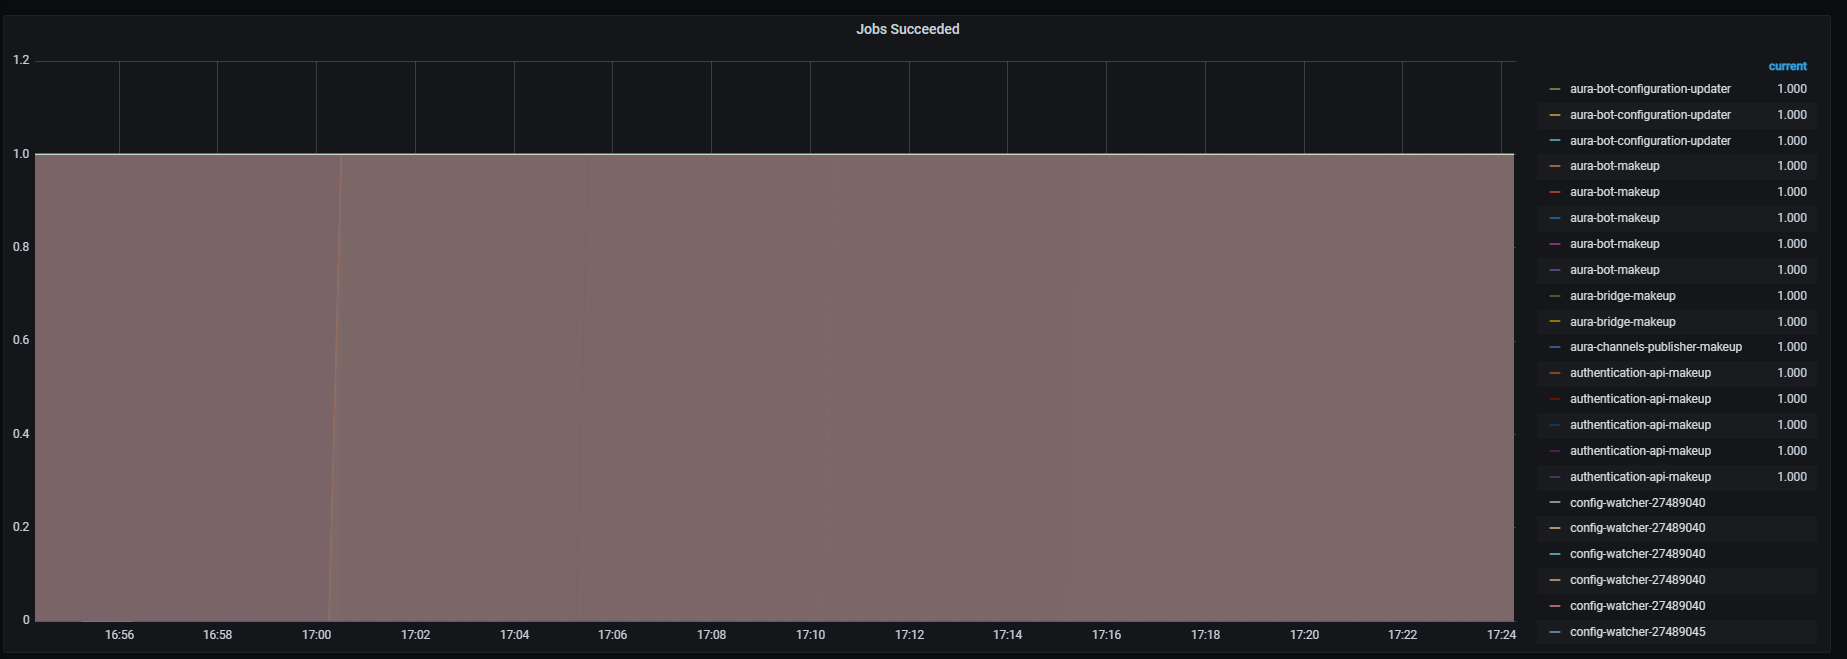
Successfully executed jobs.
Metrics:
kube_job_status_succeeded
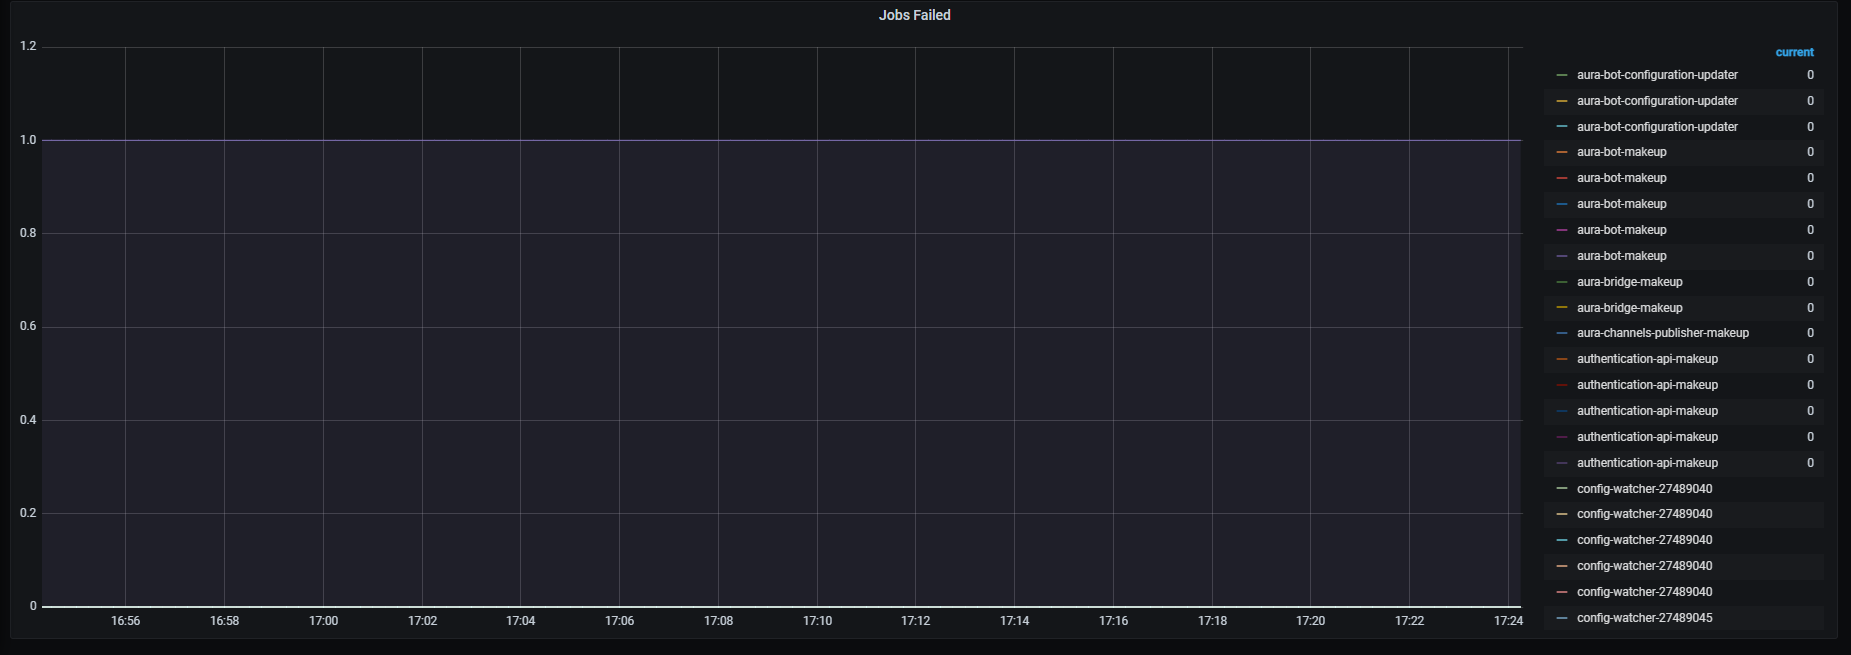
Failed job executions.
Metrics:
kube_job_status_failed
Information provided by Kubernetes nodes dashboard
Kubernetes nodes dashboard monitors nodes general system status.
The available metrics are defined in the following sections.
CPU usage percent rate, aggregated by one minute.
Metrics:
sum (rate (container_cpu_usage_seconds_total{id="/",kubernetes_io_hostname=~"^.*$",agentpool=~".*"}[1m])) by (kubernetes_io_hostname) / sum (machine_cpu_cores{kubernetes_io_hostname=~"^.*$",agentpool=~".*"}) by (kubernetes_io_hostname) * 100
Memory usage percentage.
Metrics:
sum (container_memory_working_set_bytes{id="/", kubernetes_io_hostname=~"^.*$",agentpool=~".*"}) by (kubernetes_io_hostname) / sum (machine_memory_bytes{kubernetes_io_hostname=~"^.*$",agentpool=~".*"}) by (kubernetes_io_hostname) * 100
Disk read/written data in bytes.
Metrics:
It includes two metrics:
sum (container_fs_reads_bytes_total{id="/", kubernetes_io_hostname=~"^.*$",agentpool=~".*"}) by (kubernetes_io_hostname)
sum (container_fs_writes_bytes_total{id="/", kubernetes_io_hostname=~"^.*$",agentpool=~".*"}) by (kubernetes_io_hostname)
Network received/sent data in bytes, aggregated by one minute.
Metrics:
It includes two metrics:
sum (rate (container_network_receive_bytes_total{id="/",kubernetes_io_hostname=~"^.*$",agentpool=~".*"}[1m])) by (kubernetes_io_hostname)
- sum (rate (container_network_transmit_bytes_total{id="/",kubernetes_io_hostname=~"^.*$",agentpool=~".*"}[1m])) by (kubernetes_io_hostname)
Information provided by Kubernetes services dashboard
Kubernetes services dashboard monitors system metrics related to services/pods.
The available metrics are defined in the following sections.
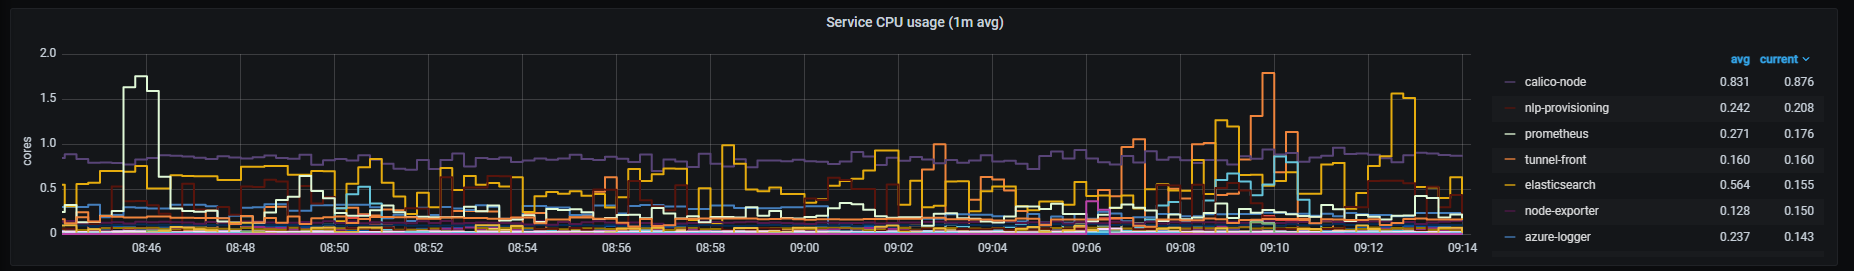
Services cpu usage rate, aggregated by one minute
Metrics:
sum(rate(container_cpu_usage_seconds_total{container!="",container=~".*"}[1m])) by (container)
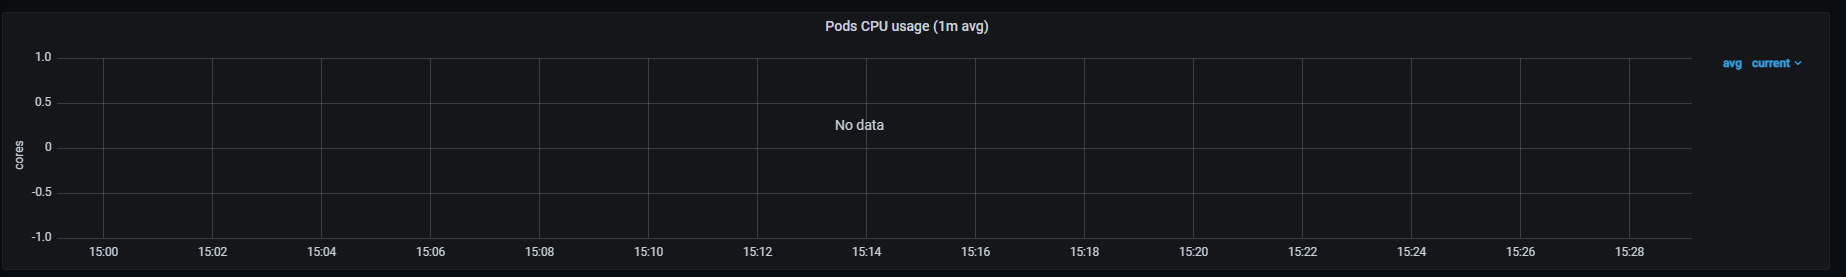
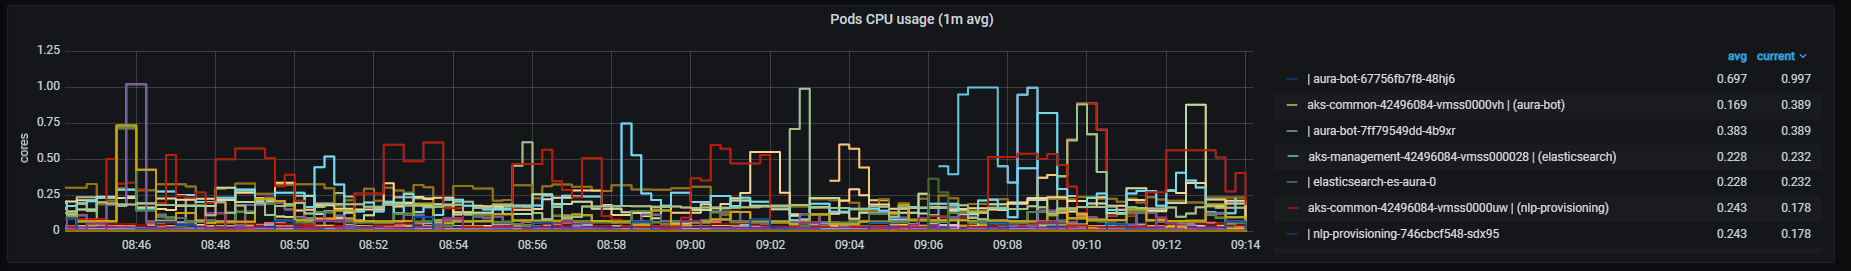
Pods CPU usage rate, aggregated by one minute.
Metrics:
It includes two metrics:
sum (rate (container_cpu_usage_seconds_total{container!="",container=~".*"}[1m])) by (container, pod)
sum (rate (container_cpu_usage_seconds_total{container!="",container=~".*"}[1m])) by (instance, container)
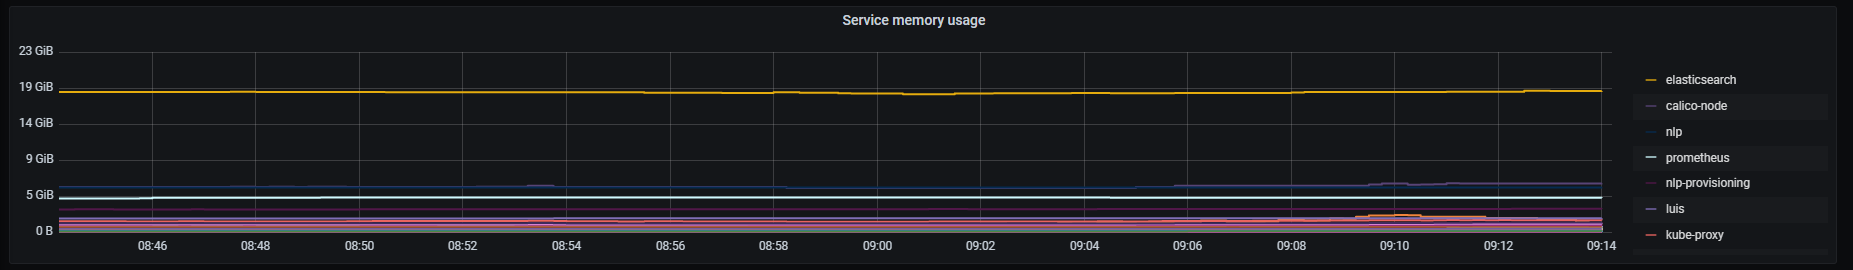
Service memory usage in bytes.
Metrics:
sum (container_memory_working_set_bytes{container!="",container=~".*"}) by (container)
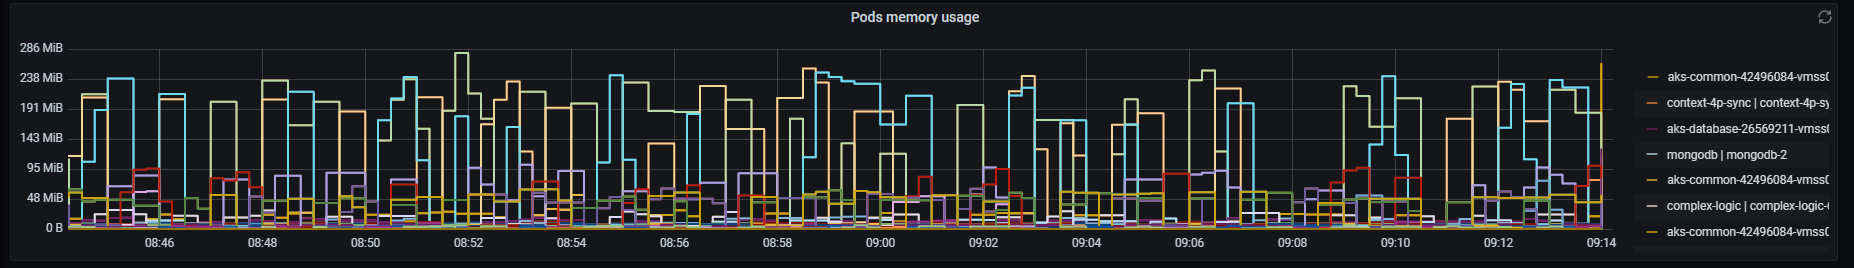
Pods memory usage in bytes, and memory usage rate aggregated by one minute
Metrics:
It includes four metrics:
sum (container_memory_working_set_bytes{container!="",container=~".*"}) by (container, pod)
sum (rate (container_cpu_usage_seconds_total{container!="",container=~".*"}[1m])) by (instance, container)
sum (rate (container_memory_working_set_bytes{container!="",container=~".*"}[1m])) by (container, pod)
sum (rate (container_memory_working_set_bytes{container!="",container=~".*"}[1m])) by (instance, container)
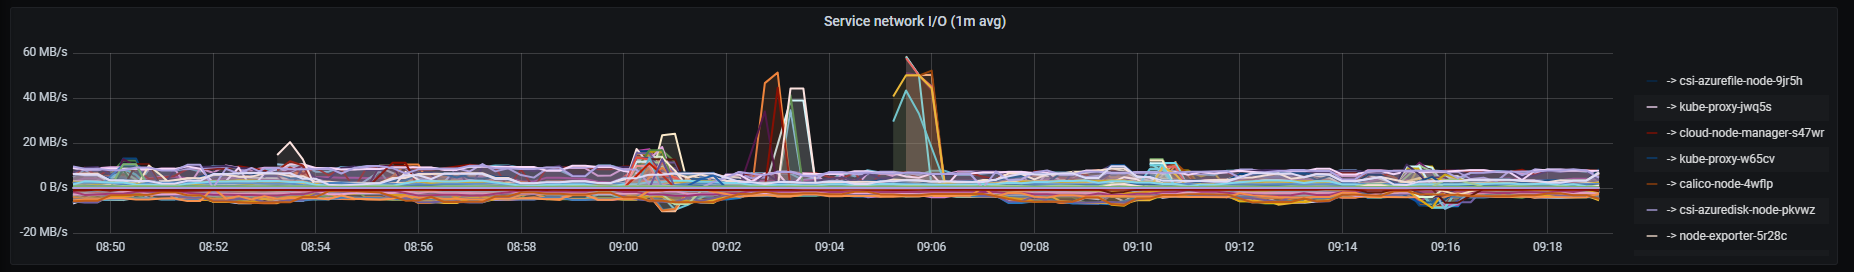
Network received/sent data rate, aggregated by one minute
Metrics:
It includes two metrics:
sum (container_memory_working_set_bytes{container!="",container=~".*"}) by (container)
- sum (rate (container_network_transmit_bytes_total{pod!="",pod=~".*.*"}[1m])) by (pod)
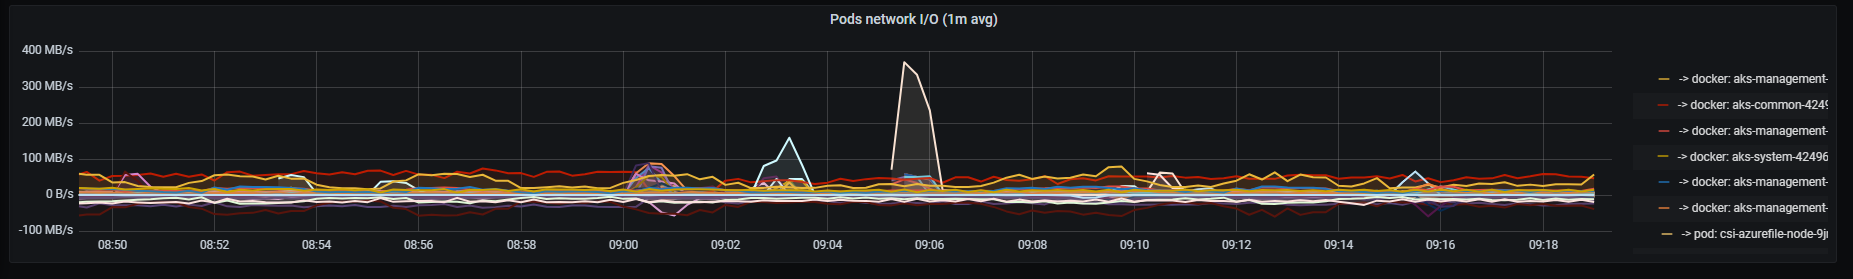
Pods received/sent data rate in bytes, aggregated by one minute.
Metrics:
It includes four metrics:
sum (rate (container_network_receive_bytes_total{pod!="",pod=~".*.*"}[1m])) by (name, pod)
- sum (rate (container_network_transmit_bytes_total{pod!="",pod=~".*.*"}[1m])) by (container, pod)
sum (rate (container_network_receive_bytes_total{pod!="",pod=~".*.*"}[1m])) by (instance, container, image)
- sum (rate (container_network_transmit_bytes_total{pod!="",pod=~".*.*"}[1m])) by (instance, container, image)
Information provided by Kubernetes storage monitoring dashboard
Kubernetes storage monitoring dashboard monitors storage related metrics.
The available metrics are defined in the following sections.
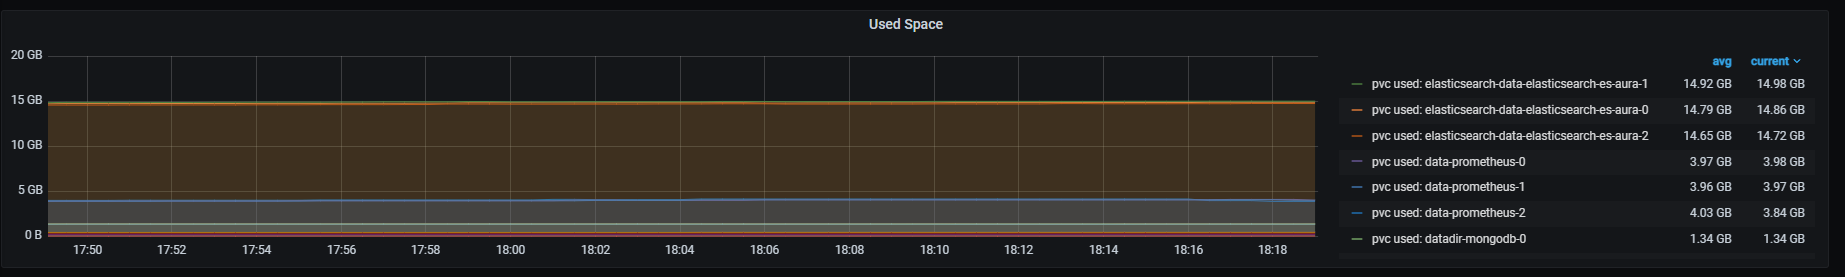
Kubelets volumes and container filesystems data usage in bytes.
Metrics:
It includes two metrics:
kubelet_volume_stats_used_bytes{kubernetes_io_hostname=~"^.*$",agentpool=~".*"}
container_fs_usage_bytes{image!="",kubernetes_io_hostname=~"^.*$",agentpool=~".*"}
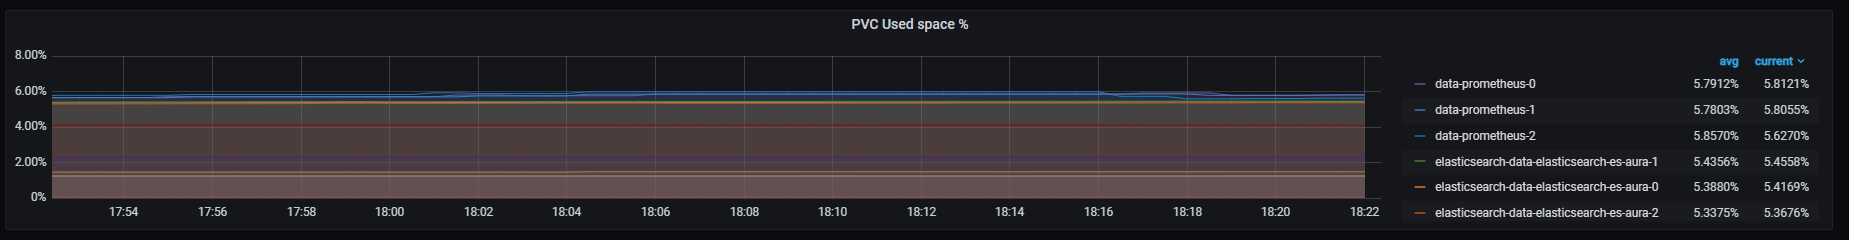
PersistentVolumeClaim used space percent.
Metrics:
(kubelet_volume_stats_used_bytes{kubernetes_io_hostname=~"^.*$",agentpool=~".*",persistentvolumeclaim=~"(data-prometheus-0|data-prometheus-1|data-prometheus-2|datadir-mongodb-0|datadir-mongodb-1|datadir-mongodb-2|elasticsearch-data-elasticsearch-es-aura-0|elasticsearch-data-elasticsearch-es-aura-1|elasticsearch-data-elasticsearch-es-aura-2|grafana-grafana-0|redis-data-redis-0|redis-data-redis-1|redis-data-redis-2|store-thanos-store-gateway-0|store-thanos-store-gateway-1)"} / kubelet_volume_stats_capacity_bytes{kubernetes_io_hostname=~"^.*$",agentpool=~".*",persistentvolumeclaim=~"(data-prometheus-0|data-prometheus-1|data-prometheus-2|datadir-mongodb-0|datadir-mongodb-1|datadir-mongodb-2|elasticsearch-data-elasticsearch-es-aura-0|elasticsearch-data-elasticsearch-es-aura-1|elasticsearch-data-elasticsearch-es-aura-2|grafana-grafana-0|redis-data-redis-0|redis-data-redis-1|redis-data-redis-2|store-thanos-store-gateway-0|store-thanos-store-gateway-1)"})
Containers assigned space usage percentage.
Metrics:
(container_fs_usage_bytes{image!="",kubernetes_io_hostname=~"^.*$",agentpool=~".*"} / container_fs_limit_bytes{image!="",kubernetes_io_hostname=~"^.*$",agentpool=~".*"})
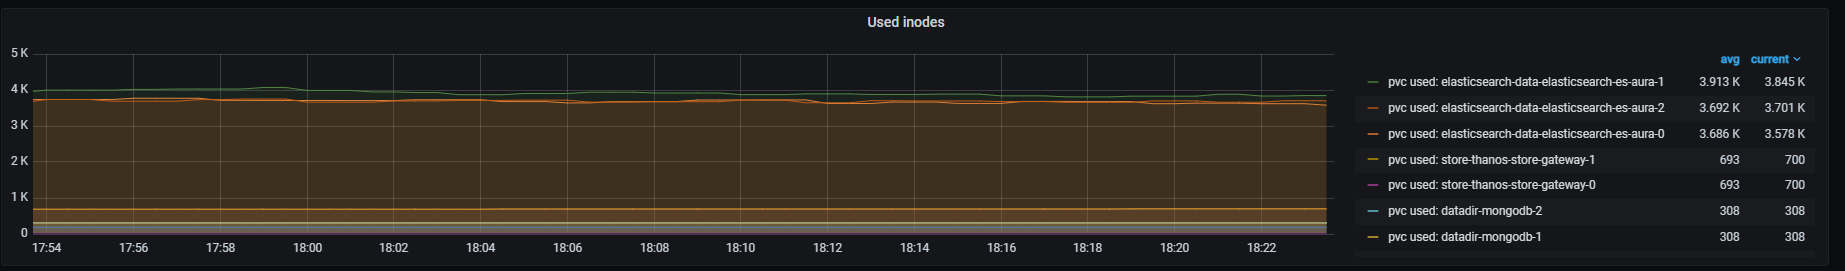
Kubelet PersistentVolumeClaim volumes total used inodes.
Metrics:
kubelet_volume_stats_inodes_used{kubernetes_io_hostname=~"^.*$",agentpool=~".*",persistentvolumeclaim=~"(data-prometheus-0|data-prometheus-1|data-prometheus-2|datadir-mongodb-0|datadir-mongodb-1|datadir-mongodb-2|elasticsearch-data-elasticsearch-es-aura-0|elasticsearch-data-elasticsearch-es-aura-1|elasticsearch-data-elasticsearch-es-aura-2|grafana-grafana-0|redis-data-redis-0|redis-data-redis-1|redis-data-redis-2|store-thanos-store-gateway-0|store-thanos-store-gateway-1)"}
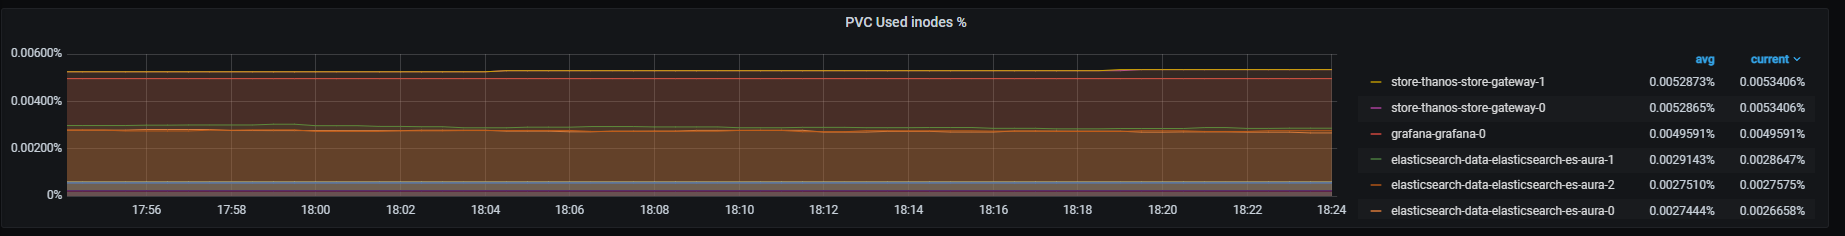
Kubelet PersistentVolumeClaim volumes inodes usage percentage.
Metrics:
(kubelet_volume_stats_inodes_used{kubernetes_io_hostname=~"^.*$",agentpool=~".*",persistentvolumeclaim=~"(data-prometheus-0|data-prometheus-1|data-prometheus-2|datadir-mongodb-0|datadir-mongodb-1|datadir-mongodb-2|elasticsearch-data-elasticsearch-es-aura-0|elasticsearch-data-elasticsearch-es-aura-1|elasticsearch-data-elasticsearch-es-aura-2|grafana-grafana-0|redis-data-redis-0|redis-data-redis-1|redis-data-redis-2|store-thanos-store-gateway-0|store-thanos-store-gateway-1)"} / kubelet_volume_stats_inodes{kubernetes_io_hostname=~"^.*$",agentpool=~".*",persistentvolumeclaim=~"(data-prometheus-0|data-prometheus-1|data-prometheus-2|datadir-mongodb-0|datadir-mongodb-1|datadir-mongodb-2|elasticsearch-data-elasticsearch-es-aura-0|elasticsearch-data-elasticsearch-es-aura-1|elasticsearch-data-elasticsearch-es-aura-2|grafana-grafana-0|redis-data-redis-0|redis-data-redis-1|redis-data-redis-2|store-thanos-store-gateway-0|store-thanos-store-gateway-1)"})
Information provided by NLP provisioning dashboard
Number of expected, killed and alive provisioning processes.
The queries used to get the panel information are:
nlp_provisioning_expected_alive_processes
nlp_provisioning_killed_processes
nlp_provisioning_alive_processes
An example of this panel is shown below:

Time series with the killed processes by container.
The x-axis shows the time series and the y-axis shows the number of killed processes by container.
The queries used to get the panel information are:
nlp_provisioning_container_killed_count_total
An example of this panel is shown below:
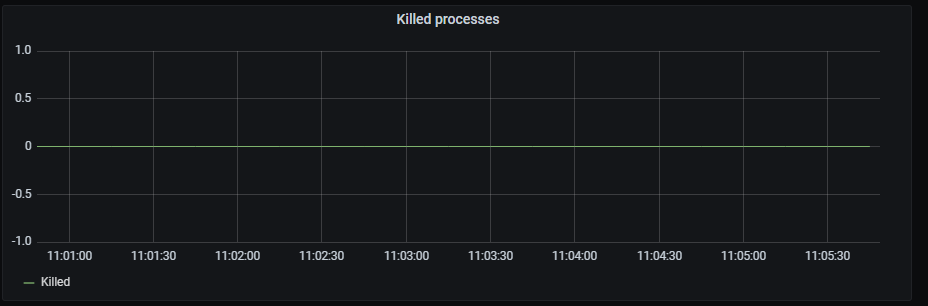
Time series with the total killed processes.
The x-axis shows the time series and the y-axis shows the number of killed processes.
The queries used to get the panel information are:
nlp_provisioning_killed_processes
An example of this panel is shown below:
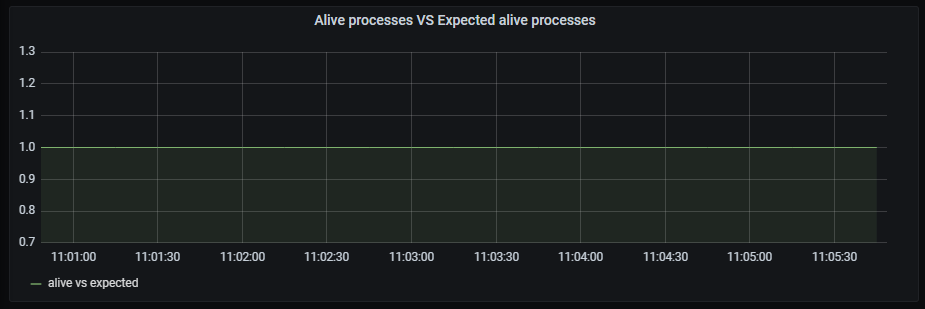
Time series with the ratio between alive processes and expected alive processes.
The x-axis shows the time series and the y-axis shows the ratio between alive and expected
The queries used to get the panel information are:
nlp_provisioning_alive_processes/ nlp_provisioning_expected_alive_processes
An example of this panel is shown below:
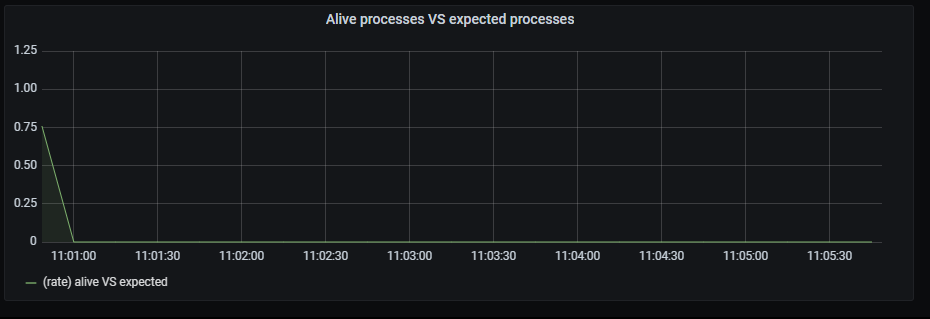
Time series with the ratio between alive processes rate aggregated by 15 minutes and expected alive processes rate aggregated by 15 minutes.
The x-axis shows the time series and the y-axis shows the ratio between alive/expected processes
The queries used to get the panel information are:
sum by (exported_job) (rate(nlp_provisioning_alive_processes{exported_job="nlp_provisioning_job"}[15m])) /
sum by (exported_job) (rate(nlp_provisioning_expected_alive_processes{exported_job="nlp_provisioning_job"}[15m]))
An example of this panel is shown below:
Information provided by Prometheus stats dashboard
This is a dashboard to obtain a lot of information on how Prometheus performs.
To get the information about each pod, the dashboard counts on a filter with the following fields:
jobs: list of active jobs.instances: list of scrapeable instances.interval: possible time intervals.Once selected, the following graphs are printed.
Time series with CPU usage rate, aggregated by one minute. It also shows the current minimum, maximum and average cpu usage.
The x-axis shows the time series and the y-axis shows the cpu usage rate.
The queries used to get the panel information are:
sum(rate(container_cpu_usage_seconds_total{pod_name!="",pod_name=~"prometheus.*"}[1m])) by (pod_name)
An example of this panel is shown below:
Time series with memory usage. It also shows the current minimum, maximum and average memory usage.
The x-axis shows the time series and the y-axis shows the memory usage.
The queries used to get the panel information are:
sum (container_memory_working_set_bytes{pod_name!="",pod_name=~"prometheus.*"}) by (pod_name)
An example of this panel is shown below:
Time series with the network I/O average aggregated by one minute. It also shows the current minimum, maximum and average network I/O bytes.
The x-axis shows the time series and the y-axis shows the network I/O.
The queries used to get the panel information are:
sum (rate (container_network_receive_bytes_total{pod_name!="",pod_name=~"prometheus.*"}[1m])) by (pod_name)
- sum (rate (container_network_transmit_bytes_total{pod_name!="",pod_name=~"prometheus.*"}[1m])) by (pod_name)
An example of this panel is shown below:
Percentage of uptime for the last hour.
The queries used to get the panel information are:
avg(avg_over_time(up{instance=~"(10\\.240\\.0\\.10:9093|10\\.240\\.3\\.161:9093|10\\.240\\.0\\.34:9114|10\\.240\\.0\\.253:8080|10\\.240\\.3\\.205:9090|10\\.240\\.3\\.236:9090|10\\.240\\.4\\.14:9090|10\\.240\\.4\\.156:9121|10\\.240\\.4\\.186:9121|10\\.240\\.4\\.223:9121)",job=~"kubernetes-service-endpoints"}[1h]) * 100)
An example of this panel is shown below:
Currently down instances.
The queries used to get the panel information are:
up{instance=~"(10\\.240\\.0\\.5:9093|10\\.240\\.0\\.76:9093|10\\.240\\.0\\.26:9114|10\\.240\\.0\\.253:8080|10\\.240\\.0\\.94:9090|10\\.240\\.1\\.199:9090|10\\.240\\.2\\.4:9090|10\\.240\\.2\\.204:9121|10\\.240\\.2\\.245:9121|10\\.240\\.3\\.10:9121)",job=~"kubernetes-service-endpoints"} < 1
An example of this panel is shown below:
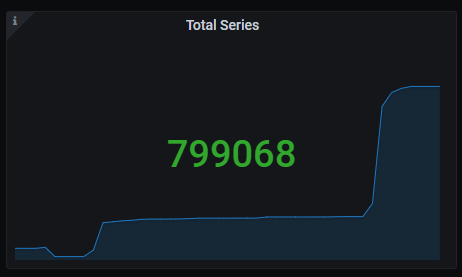
Total series count.
The queries used to get the panel information are:
sum(prometheus_tsdb_head_series{job=~"kubernetes-service-endpoints",instance=~"(10\\.240\\.0\\.5:9093|10\\.240\\.0\\.76:9093|10\\.240\\.0\\.26:9114|10\\.240\\.0\\.253:8080|10\\.240\\.0\\.94:9090|10\\.240\\.1\\.199:9090|10\\.240\\.2\\.4:9090|10\\.240\\.2\\.204:9121|10\\.240\\.2\\.245:9121|10\\.240\\.3\\.10:9121)"})
An example of this panel is shown below:
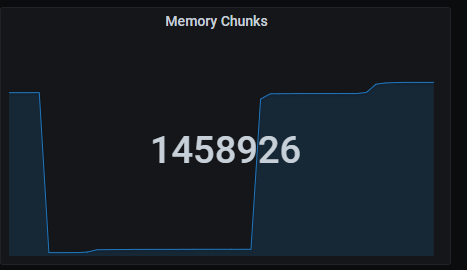
Memory chunks being used.
The queries used to get the panel information are:
sum(prometheus_tsdb_head_chunks{job=~"kubernetes-service-endpoints",instance=~"(10\\.240\\.0\\.5:9093|10\\.240\\.0\\.76:9093|10\\.240\\.0\\.26:9114|10\\.240\\.0\\.253:8080|10\\.240\\.0\\.94:9090|10\\.240\\.1\\.199:9090|10\\.240\\.2\\.4:9090|10\\.240\\.2\\.204:9121|10\\.240\\.2\\.245:9121|10\\.240\\.3\\.10:9121)"})
An example of this panel is shown below:
Quick numbers section shows a series of Prometheus indicators.
Number of missed iterations, aggregated by one hour.
The queries used to get the panel information are:
sum(sum_over_time(prometheus_evaluator_iterations_missed_total{job=~"kubernetes-service-endpoints",instance=~"(10\\.240\\.0\\.5:9093|10\\.240\\.0\\.76:9093|10\\.240\\.0\\.26:9114|10\\.240\\.0\\.253:8080|10\\.240\\.0\\.94:9090|10\\.240\\.1\\.199:9090|10\\.240\\.2\\.4:9090|10\\.240\\.2\\.204:9121|10\\.240\\.2\\.245:9121|10\\.240\\.3\\.10:9121)"}[1h]))
Number of skipped iterations, aggregated by one hour.
The queries used to get the panel information are:
sum(sum_over_time(prometheus_evaluator_iterations_skipped_total{job=~"kubernetes-service-endpoints",instance=~"(10\\.240\\.0\\.5:9093|10\\.240\\.0\\.76:9093|10\\.240\\.0\\.26:9114|10\\.240\\.0\\.253:8080|10\\.240\\.0\\.94:9090|10\\.240\\.1\\.199:9090|10\\.240\\.2\\.4:9090|10\\.240\\.2\\.204:9121|10\\.240\\.2\\.245:9121|10\\.240\\.3\\.10:9121)"}[1h]))
Number of scrapes that elapsed more than expected, aggregated by one hour.
The queries used to get the panel information are:
sum(sum_over_time(prometheus_target_scrapes_exceeded_sample_limit_total{job=~"kubernetes-service-endpoints",instance=~"(10\\.240\\.0\\.5:9093|10\\.240\\.0\\.76:9093|10\\.240\\.0\\.26:9114|10\\.240\\.0\\.253:8080|10\\.240\\.0\\.94:9090|10\\.240\\.1\\.199:9090|10\\.240\\.2\\.4:9090|10\\.240\\.2\\.204:9121|10\\.240\\.2\\.245:9121|10\\.240\\.3\\.10:9121)"}[1h]))
Number of reload failures, aggregated by one hour.
The queries used to get the panel information are:
sum(sum_over_time(prometheus_tsdb_reloads_failures_total{job=~"kubernetes-service-endpoints",instance=~"(10\\.240\\.0\\.5:9093|10\\.240\\.0\\.76:9093|10\\.240\\.0\\.26:9114|10\\.240\\.0\\.253:8080|10\\.240\\.0\\.94:9090|10\\.240\\.1\\.199:9090|10\\.240\\.2\\.4:9090|10\\.240\\.2\\.204:9121|10\\.240\\.2\\.245:9121|10\\.240\\.3\\.10:9121)"}[1h]))
Number of uncompleted scrapes due to multiple reasons, aggregated by one hour.
The queries used to get the panel information are:
sum(sum_over_time(prometheus_target_scrapes_exceeded_sample_limit_total{job=~"kubernetes-service-endpoints",instance=~"(10\\.240\\.0\\.5:9093|10\\.240\\.0\\.76:9093|10\\.240\\.0\\.26:9114|10\\.240\\.0\\.253:8080|10\\.240\\.0\\.94:9090|10\\.240\\.1\\.199:9090|10\\.240\\.2\\.4:9090|10\\.240\\.2\\.204:9121|10\\.240\\.2\\.245:9121|10\\.240\\.3\\.10:9121)"}[1h])) +
sum(sum_over_time(prometheus_target_scrapes_sample_duplicate_timestamp_total{job=~"kubernetes-service-endpoints",instance=~"(10\\.240\\.0\\.5:9093|10\\.240\\.0\\.76:9093|10\\.240\\.0\\.26:9114|10\\.240\\.0\\.253:8080|10\\.240\\.0\\.94:9090|10\\.240\\.1\\.199:9090|10\\.240\\.2\\.4:9090|10\\.240\\.2\\.204:9121|10\\.240\\.2\\.245:9121|10\\.240\\.3\\.10:9121)"}[1h])) +
sum(sum_over_time(prometheus_target_scrapes_sample_out_of_bounds_total{job=~"kubernetes-service-endpoints",instance=~"(10\\.240\\.0\\.5:9093|10\\.240\\.0\\.76:9093|10\\.240\\.0\\.26:9114|10\\.240\\.0\\.253:8080|10\\.240\\.0\\.94:9090|10\\.240\\.1\\.199:9090|10\\.240\\.2\\.4:9090|10\\.240\\.2\\.204:9121|10\\.240\\.2\\.245:9121|10\\.240\\.3\\.10:9121)"}[1h])) +
sum(sum_over_time(prometheus_target_scrapes_sample_out_of_order_total{job=~"kubernetes-service-endpoints",instance=~"(10\\.240\\.0\\.5:9093|10\\.240\\.0\\.76:9093|10\\.240\\.0\\.26:9114|10\\.240\\.0\\.253:8080|10\\.240\\.0\\.94:9090|10\\.240\\.1\\.199:9090|10\\.240\\.2\\.4:9090|10\\.240\\.2\\.204:9121|10\\.240\\.2\\.245:9121|10\\.240\\.3\\.10:9121)"}[1h]))
An example of this panel is shown below:

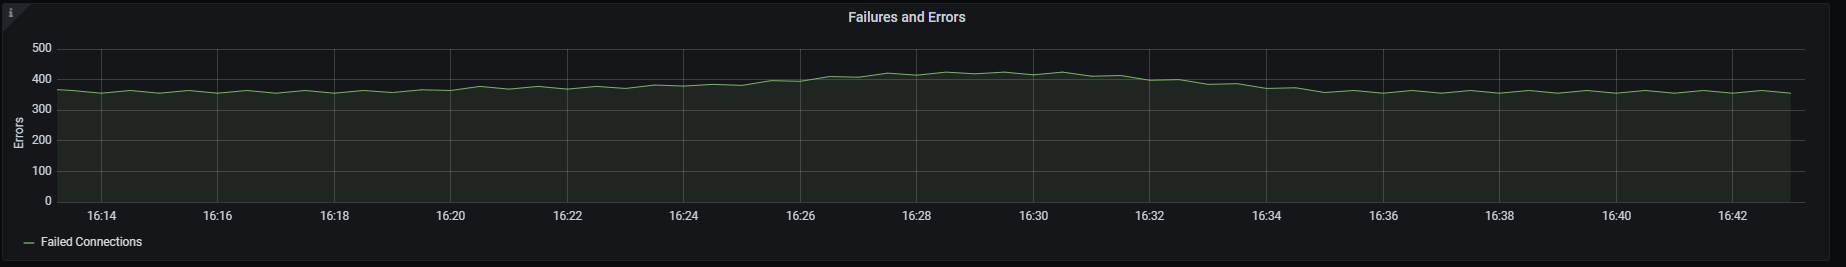
Time series with the number of several different errors and failures, aggregated by five minutes.
The x-axis shows the time series and the y-axis shows a series of different errors and failures:
The queries used to get the panel information are:
sum(increase(net_conntrack_dialer_conn_failed_total{instance=~"(10\\.240\\.0\\.5:9093|10\\.240\\.0\\.76:9093|10\\.240\\.0\\.26:9114|10\\.240\\.0\\.253:8080|10\\.240\\.0\\.94:9090|10\\.240\\.1\\.199:9090|10\\.240\\.2\\.4:9090|10\\.240\\.2\\.204:9121|10\\.240\\.2\\.245:9121|10\\.240\\.3\\.10:9121)"}[5m])) > 0
sum(increase(prometheus_evaluator_iterations_missed_total{instance=~"(10\\.240\\.0\\.5:9093|10\\.240\\.0\\.76:9093|10\\.240\\.0\\.26:9114|10\\.240\\.0\\.253:8080|10\\.240\\.0\\.94:9090|10\\.240\\.1\\.199:9090|10\\.240\\.2\\.4:9090|10\\.240\\.2\\.204:9121|10\\.240\\.2\\.245:9121|10\\.240\\.3\\.10:9121)"}[5m])) > 0
sum(increase(prometheus_evaluator_iterations_skipped_total{instance=~"(10\\.240\\.0\\.5:9093|10\\.240\\.0\\.76:9093|10\\.240\\.0\\.26:9114|10\\.240\\.0\\.253:8080|10\\.240\\.0\\.94:9090|10\\.240\\.1\\.199:9090|10\\.240\\.2\\.4:9090|10\\.240\\.2\\.204:9121|10\\.240\\.2\\.245:9121|10\\.240\\.3\\.10:9121)"}[5m])) > 0
sum(increase(prometheus_rule_evaluation_failures_total{instance=~"(10\\.240\\.0\\.5:9093|10\\.240\\.0\\.76:9093|10\\.240\\.0\\.26:9114|10\\.240\\.0\\.253:8080|10\\.240\\.0\\.94:9090|10\\.240\\.1\\.199:9090|10\\.240\\.2\\.4:9090|10\\.240\\.2\\.204:9121|10\\.240\\.2\\.245:9121|10\\.240\\.3\\.10:9121)"}[5m])) > 0
sum(increase(prometheus_sd_azure_refresh_failures_total{instance=~"(10\\.240\\.0\\.5:9093|10\\.240\\.0\\.76:9093|10\\.240\\.0\\.26:9114|10\\.240\\.0\\.253:8080|10\\.240\\.0\\.94:9090|10\\.240\\.1\\.199:9090|10\\.240\\.2\\.4:9090|10\\.240\\.2\\.204:9121|10\\.240\\.2\\.245:9121|10\\.240\\.3\\.10:9121)"}[5m])) > 0
sum(increase(prometheus_sd_consul_rpc_failures_total{instance=~"(10\\.240\\.0\\.5:9093|10\\.240\\.0\\.76:9093|10\\.240\\.0\\.26:9114|10\\.240\\.0\\.253:8080|10\\.240\\.0\\.94:9090|10\\.240\\.1\\.199:9090|10\\.240\\.2\\.4:9090|10\\.240\\.2\\.204:9121|10\\.240\\.2\\.245:9121|10\\.240\\.3\\.10:9121)"}[5m])) > 0
sum(increase(prometheus_sd_dns_lookup_failures_total{instance=~"(10\\.240\\.0\\.5:9093|10\\.240\\.0\\.76:9093|10\\.240\\.0\\.26:9114|10\\.240\\.0\\.253:8080|10\\.240\\.0\\.94:9090|10\\.240\\.1\\.199:9090|10\\.240\\.2\\.4:9090|10\\.240\\.2\\.204:9121|10\\.240\\.2\\.245:9121|10\\.240\\.3\\.10:9121)"}[5m])) > 0
sum(increase(prometheus_sd_ec2_refresh_failures_total{instance=~"(10\\.240\\.0\\.5:9093|10\\.240\\.0\\.76:9093|10\\.240\\.0\\.26:9114|10\\.240\\.0\\.253:8080|10\\.240\\.0\\.94:9090|10\\.240\\.1\\.199:9090|10\\.240\\.2\\.4:9090|10\\.240\\.2\\.204:9121|10\\.240\\.2\\.245:9121|10\\.240\\.3\\.10:9121)"}[5m])) > 0
sum(increase(prometheus_sd_gce_refresh_failures_total{instance=~"(10\\.240\\.0\\.5:9093|10\\.240\\.0\\.76:9093|10\\.240\\.0\\.26:9114|10\\.240\\.0\\.253:8080|10\\.240\\.0\\.94:9090|10\\.240\\.1\\.199:9090|10\\.240\\.2\\.4:9090|10\\.240\\.2\\.204:9121|10\\.240\\.2\\.245:9121|10\\.240\\.3\\.10:9121)"}[5m])) > 0
sum(increase(prometheus_sd_marathon_refresh_failures_total{instance=~"(10\\.240\\.0\\.5:9093|10\\.240\\.0\\.76:9093|10\\.240\\.0\\.26:9114|10\\.240\\.0\\.253:8080|10\\.240\\.0\\.94:9090|10\\.240\\.1\\.199:9090|10\\.240\\.2\\.4:9090|10\\.240\\.2\\.204:9121|10\\.240\\.2\\.245:9121|10\\.240\\.3\\.10:9121)"}[5m])) > 0
sum(increase(prometheus_sd_openstack_refresh_failures_total{instance=~"(10\\.240\\.0\\.5:9093|10\\.240\\.0\\.76:9093|10\\.240\\.0\\.26:9114|10\\.240\\.0\\.253:8080|10\\.240\\.0\\.94:9090|10\\.240\\.1\\.199:9090|10\\.240\\.2\\.4:9090|10\\.240\\.2\\.204:9121|10\\.240\\.2\\.245:9121|10\\.240\\.3\\.10:9121)"}[5m])) > 0
sum(increase(prometheus_sd_triton_refresh_failures_total{instance=~"(10\\.240\\.0\\.5:9093|10\\.240\\.0\\.76:9093|10\\.240\\.0\\.26:9114|10\\.240\\.0\\.253:8080|10\\.240\\.0\\.94:9090|10\\.240\\.1\\.199:9090|10\\.240\\.2\\.4:9090|10\\.240\\.2\\.204:9121|10\\.240\\.2\\.245:9121|10\\.240\\.3\\.10:9121)"}[5m])) > 0
sum(increase(prometheus_target_scrapes_exceeded_sample_limit_total{instance=~"(10\\.240\\.0\\.5:9093|10\\.240\\.0\\.76:9093|10\\.240\\.0\\.26:9114|10\\.240\\.0\\.253:8080|10\\.240\\.0\\.94:9090|10\\.240\\.1\\.199:9090|10\\.240\\.2\\.4:9090|10\\.240\\.2\\.204:9121|10\\.240\\.2\\.245:9121|10\\.240\\.3\\.10:9121)"}[5m])) > 0
sum(increase(prometheus_target_scrapes_sample_duplicate_timestamp_total{instance=~"(10\\.240\\.0\\.5:9093|10\\.240\\.0\\.76:9093|10\\.240\\.0\\.26:9114|10\\.240\\.0\\.253:8080|10\\.240\\.0\\.94:9090|10\\.240\\.1\\.199:9090|10\\.240\\.2\\.4:9090|10\\.240\\.2\\.204:9121|10\\.240\\.2\\.245:9121|10\\.240\\.3\\.10:9121)"}[5m])) > 0
sum(increase(prometheus_target_scrapes_sample_out_of_bounds_total{instance=~"(10\\.240\\.0\\.5:9093|10\\.240\\.0\\.76:9093|10\\.240\\.0\\.26:9114|10\\.240\\.0\\.253:8080|10\\.240\\.0\\.94:9090|10\\.240\\.1\\.199:9090|10\\.240\\.2\\.4:9090|10\\.240\\.2\\.204:9121|10\\.240\\.2\\.245:9121|10\\.240\\.3\\.10:9121)"}[5m])) > 0
sum(increase(prometheus_target_scrapes_sample_out_of_order_total{instance=~"(10\\.240\\.0\\.5:9093|10\\.240\\.0\\.76:9093|10\\.240\\.0\\.26:9114|10\\.240\\.0\\.253:8080|10\\.240\\.0\\.94:9090|10\\.240\\.1\\.199:9090|10\\.240\\.2\\.4:9090|10\\.240\\.2\\.204:9121|10\\.240\\.2\\.245:9121|10\\.240\\.3\\.10:9121)"}[5m])) > 0
sum(increase(prometheus_treecache_zookeeper_failures_total{instance=~"(10\\.240\\.0\\.5:9093|10\\.240\\.0\\.76:9093|10\\.240\\.0\\.26:9114|10\\.240\\.0\\.253:8080|10\\.240\\.0\\.94:9090|10\\.240\\.1\\.199:9090|10\\.240\\.2\\.4:9090|10\\.240\\.2\\.204:9121|10\\.240\\.2\\.245:9121|10\\.240\\.3\\.10:9121)"}[5m])) > 0
sum(increase(prometheus_tsdb_compactions_failed_total{instance=~"(10\\.240\\.0\\.5:9093|10\\.240\\.0\\.76:9093|10\\.240\\.0\\.26:9114|10\\.240\\.0\\.253:8080|10\\.240\\.0\\.94:9090|10\\.240\\.1\\.199:9090|10\\.240\\.2\\.4:9090|10\\.240\\.2\\.204:9121|10\\.240\\.2\\.245:9121|10\\.240\\.3\\.10:9121)"}[5m])) > 0
sum(increase(prometheus_tsdb_head_series_not_found{instance=~"(10\\.240\\.0\\.5:9093|10\\.240\\.0\\.76:9093|10\\.240\\.0\\.26:9114|10\\.240\\.0\\.253:8080|10\\.240\\.0\\.94:9090|10\\.240\\.1\\.199:9090|10\\.240\\.2\\.4:9090|10\\.240\\.2\\.204:9121|10\\.240\\.2\\.245:9121|10\\.240\\.3\\.10:9121)"}[5m])) > 0
sum(increase(prometheus_tsdb_reloads_failures_total{instance=~"(10\\.240\\.0\\.5:9093|10\\.240\\.0\\.76:9093|10\\.240\\.0\\.26:9114|10\\.240\\.0\\.253:8080|10\\.240\\.0\\.94:9090|10\\.240\\.1\\.199:9090|10\\.240\\.2\\.4:9090|10\\.240\\.2\\.204:9121|10\\.240\\.2\\.245:9121|10\\.240\\.3\\.10:9121)"}[5m])) > 0
An example of how this panel looks like:
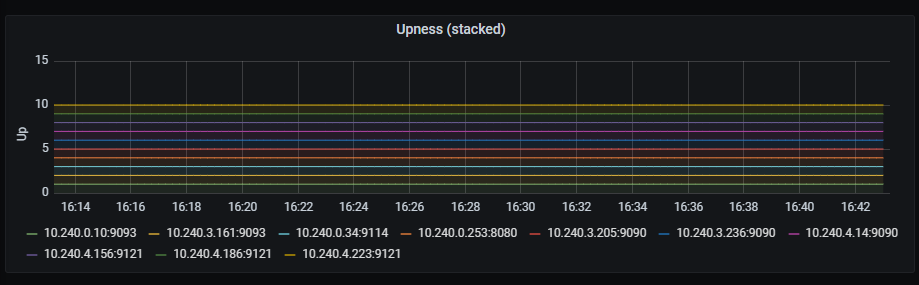
Time series with a time bound representation of services upness. Those values are shown stacked.
The x-axis shows the time series and the y-axis shows the upness state of the different services.
The queries used to get the panel information are:
up{instance=~"(10\\.240\\.0\\.5:9093|10\\.240\\.0\\.76:9093|10\\.240\\.0\\.26:9114|10\\.240\\.0\\.253:8080|10\\.240\\.0\\.94:9090|10\\.240\\.1\\.199:9090|10\\.240\\.2\\.4:9090|10\\.240\\.2\\.204:9121|10\\.240\\.2\\.245:9121|10\\.240\\.3\\.10:9121)",job=~"kubernetes-service-endpoints"}
An example of this panel is shown below:
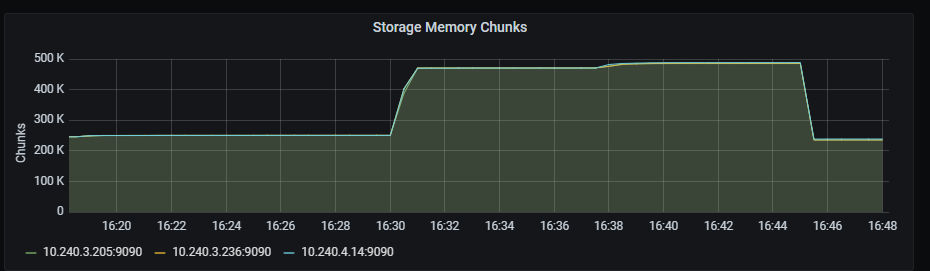
Time series with the number of memory chunks used.
The x-axis shows the time series and the y-axis shows the number of memory chunks.
The queries used to get the panel information are:
prometheus_tsdb_head_chunks{job=~"kubernetes-service-endpoints",instance=~"(10\\.240\\.0\\.5:9093|10\\.240\\.0\\.76:9093|10\\.240\\.0\\.26:9114|10\\.240\\.0\\.253:8080|10\\.240\\.0\\.94:9090|10\\.240\\.1\\.199:9090|10\\.240\\.2\\.4:9090|10\\.240\\.2\\.204:9121|10\\.240\\.2\\.245:9121|10\\.240\\.3\\.10:9121)"}
An example of this panel is shown below:
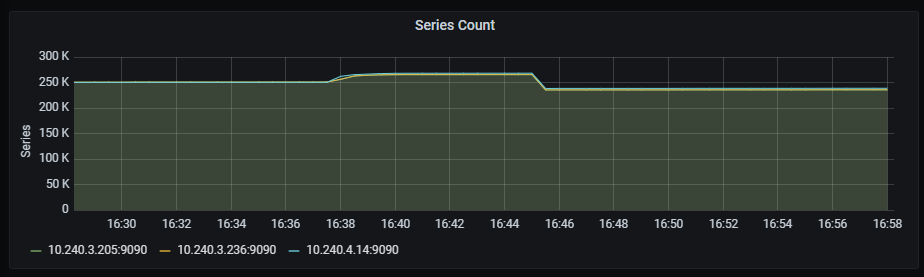
Time series with the number of tsdb series.
The x-axis shows the time series and the y-axis shows the number of series.
The queries used to get the panel information are:
prometheus_tsdb_head_series{job=~"kubernetes-service-endpoints",instance=~"(10\\.240\\.0\\.5:9093|10\\.240\\.0\\.76:9093|10\\.240\\.0\\.26:9114|10\\.240\\.0\\.253:8080|10\\.240\\.0\\.94:9090|10\\.240\\.1\\.199:9090|10\\.240\\.2\\.4:9090|10\\.240\\.2\\.204:9121|10\\.240\\.2\\.245:9121|10\\.240\\.3\\.10:9121)"}
An example of this panel is shown below:
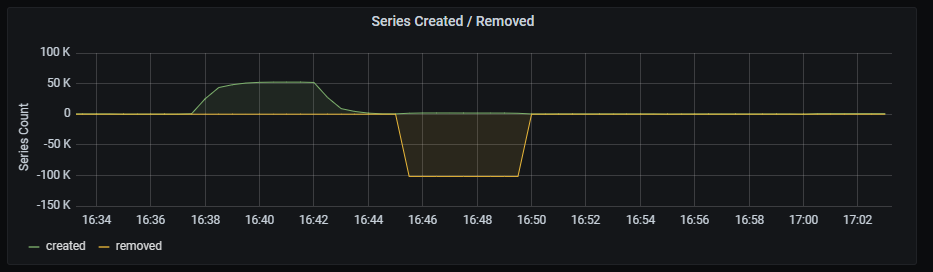
Time series with the number of tsdb series created/removed.
The x-axis shows the time series and the y-axis shows the number of series created/removed, aggregated by 5 minutes.
The queries used to get the panel information are:
sum( increase(prometheus_tsdb_head_series_created_total{instance=~"(10\\.240\\.0\\.5:9093|10\\.240\\.0\\.76:9093|10\\.240\\.0\\.26:9114|10\\.240\\.0\\.253:8080|10\\.240\\.0\\.94:9090|10\\.240\\.1\\.199:9090|10\\.240\\.2\\.4:9090|10\\.240\\.2\\.204:9121|10\\.240\\.2\\.245:9121|10\\.240\\.3\\.10:9121)"}[5m]) )
sum( increase(prometheus_tsdb_head_series_removed_total{instance=~"(10\\.240\\.0\\.5:9093|10\\.240\\.0\\.76:9093|10\\.240\\.0\\.26:9114|10\\.240\\.0\\.253:8080|10\\.240\\.0\\.94:9090|10\\.240\\.1\\.199:9090|10\\.240\\.2\\.4:9090|10\\.240\\.2\\.204:9121|10\\.240\\.2\\.245:9121|10\\.240\\.3\\.10:9121)"}[5m]) )
An example of this panel is shown below:
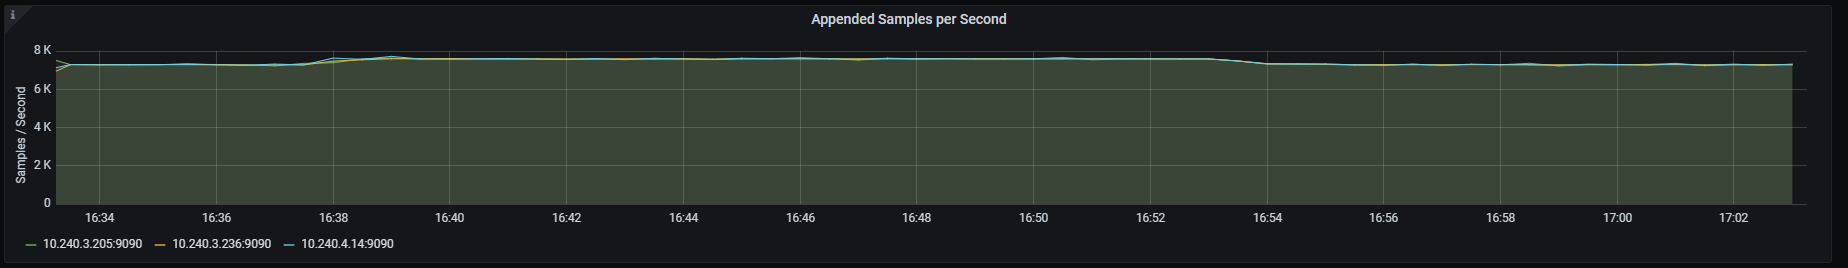
Time series with the number of metrics per second stored by Prometheus.
The x-axis shows the time series and the y-axis shows the number of metrics per second stored by Prometheus.
The queries used to get the panel information are:
rate(prometheus_tsdb_head_samples_appended_total{job=~"kubernetes-service-endpoints",instance=~"(10\\.240\\.0\\.5:9093|10\\.240\\.0\\.76:9093|10\\.240\\.0\\.26:9114|10\\.240\\.0\\.253:8080|10\\.240\\.0\\.94:9090|10\\.240\\.1\\.199:9090|10\\.240\\.2\\.4:9090|10\\.240\\.2\\.204:9121|10\\.240\\.2\\.245:9121|10\\.240\\.3\\.10:9121)"}[1m])
An example of this panel is shown below:
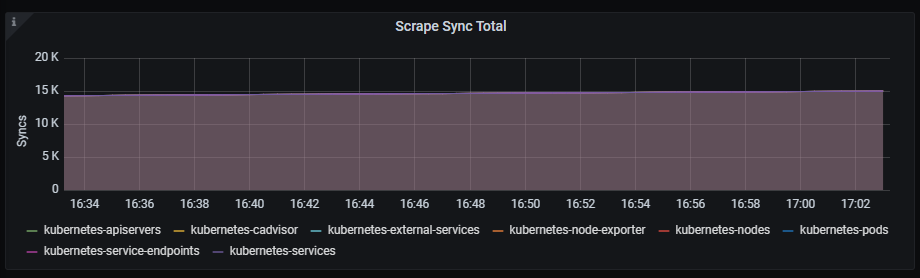
Time series with the total number of syncs that were executed on a scrape pool.
The x-axis shows the time series and the y-axis shows the total number of syncs that were executed on a scrape pool.
The queries used to get the panel information are:
sum(prometheus_target_scrape_pool_sync_total{job=~"kubernetes-service-endpoints",instance=~"(10\\.240\\.0\\.5:9093|10\\.240\\.0\\.76:9093|10\\.240\\.0\\.26:9114|10\\.240\\.0\\.253:8080|10\\.240\\.0\\.94:9090|10\\.240\\.1\\.199:9090|10\\.240\\.2\\.4:9090|10\\.240\\.2\\.204:9121|10\\.240\\.2\\.245:9121|10\\.240\\.3\\.10:9121)"}) by (scrape_job)
An example of this panel is shown below:
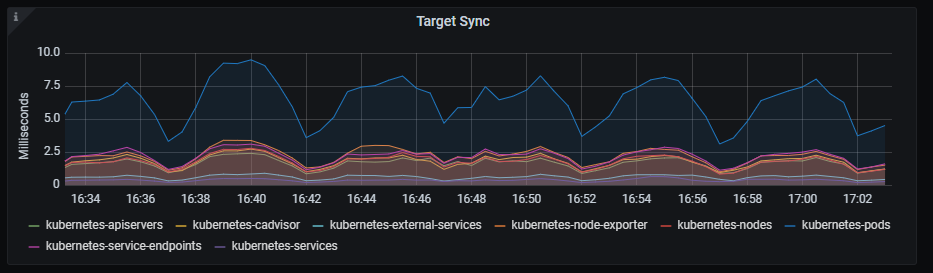
Time series with the interval to sync the scrape pool.
The x-axis shows the time series and the y-axis shows the interval to sync the scrape pool.
The queries used to get the panel information are:
sum(rate(prometheus_target_sync_length_seconds_sum{job=~"kubernetes-service-endpoints",instance=~"(10\\.240\\.0\\.5:9093|10\\.240\\.0\\.76:9093|10\\.240\\.0\\.26:9114|10\\.240\\.0\\.253:8080|10\\.240\\.0\\.94:9090|10\\.240\\.1\\.199:9090|10\\.240\\.2\\.4:9090|10\\.240\\.2\\.204:9121|10\\.240\\.2\\.245:9121|10\\.240\\.3\\.10:9121)"}[2m])) by (scrape_job) * 1000
An example of this panel is shown below:
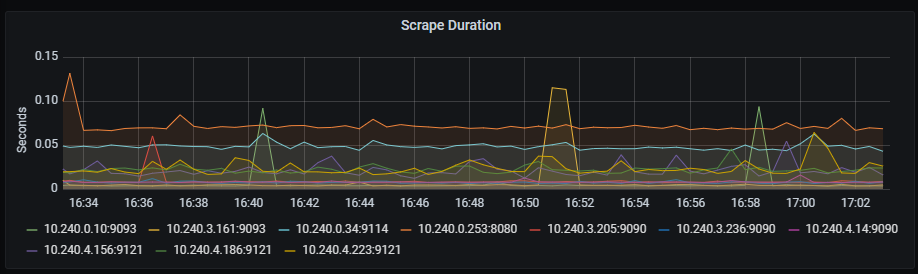
Time series with the scrape duration in seconds.
The x-axis shows the time series and the y-axis shows the scrape duration in seconds.
The queries used to get the panel information are:
scrape_duration_seconds{instance=~"(10\\.240\\.0\\.5:9093|10\\.240\\.0\\.76:9093|10\\.240\\.0\\.26:9114|10\\.240\\.0\\.253:8080|10\\.240\\.0\\.94:9090|10\\.240\\.1\\.199:9090|10\\.240\\.2\\.4:9090|10\\.240\\.2\\.204:9121|10\\.240\\.2\\.245:9121|10\\.240\\.3\\.10:9121)"}
An example of this panel is shown below:
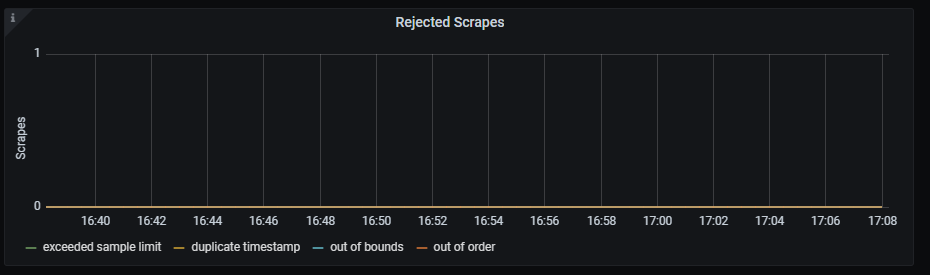
Time series with the rejected scrapes.
The x-axis shows the time series and the y-axis shows the rejected scrapes for several reasons:
The queries used to get the panel information are:
sum(prometheus_target_scrapes_exceeded_sample_limit_total{job=~"kubernetes-service-endpoints",instance=~"(10\\.240\\.0\\.5:9093|10\\.240\\.0\\.76:9093|10\\.240\\.0\\.26:9114|10\\.240\\.0\\.253:8080|10\\.240\\.0\\.94:9090|10\\.240\\.1\\.199:9090|10\\.240\\.2\\.4:9090|10\\.240\\.2\\.204:9121|10\\.240\\.2\\.245:9121|10\\.240\\.3\\.10:9121)"})
sum(prometheus_target_scrapes_sample_duplicate_timestamp_total{job=~"kubernetes-service-endpoints",instance=~"(10\\.240\\.0\\.5:9093|10\\.240\\.0\\.76:9093|10\\.240\\.0\\.26:9114|10\\.240\\.0\\.253:8080|10\\.240\\.0\\.94:9090|10\\.240\\.1\\.199:9090|10\\.240\\.2\\.4:9090|10\\.240\\.2\\.204:9121|10\\.240\\.2\\.245:9121|10\\.240\\.3\\.10:9121)"})
sum(prometheus_target_scrapes_sample_out_of_bounds_total{job=~"kubernetes-service-endpoints",instance=~"(10\\.240\\.0\\.5:9093|10\\.240\\.0\\.76:9093|10\\.240\\.0\\.26:9114|10\\.240\\.0\\.253:8080|10\\.240\\.0\\.94:9090|10\\.240\\.1\\.199:9090|10\\.240\\.2\\.4:9090|10\\.240\\.2\\.204:9121|10\\.240\\.2\\.245:9121|10\\.240\\.3\\.10:9121)"})
sum(prometheus_target_scrapes_sample_out_of_order_total{job=~"kubernetes-service-endpoints",instance=~"(10\\.240\\.0\\.5:9093|10\\.240\\.0\\.76:9093|10\\.240\\.0\\.26:9114|10\\.240\\.0\\.253:8080|10\\.240\\.0\\.94:9090|10\\.240\\.1\\.199:9090|10\\.240\\.2\\.4:9090|10\\.240\\.2\\.204:9121|10\\.240\\.2\\.245:9121|10\\.240\\.3\\.10:9121)"})
An example of this panel is shown below:
Time series with the average duration of rule group evaluations, aggregated by five minutes.
The x-axis shows the time series and the y-axis shows the average duration of rule group evaluations.
The queries used to get the panel information are:
1000 * rate(prometheus_evaluator_duration_seconds_sum{job=~"kubernetes-service-endpoints", instance=~"(10\\.240\\.0\\.5:9093|10\\.240\\.0\\.76:9093|10\\.240\\.0\\.26:9114|10\\.240\\.0\\.253:8080|10\\.240\\.0\\.94:9090|10\\.240\\.1\\.199:9090|10\\.240\\.2\\.4:9090|10\\.240\\.2\\.204:9121|10\\.240\\.2\\.245:9121|10\\.240\\.3\\.10:9121)"}[5m]) /
rate(prometheus_evaluator_duration_seconds_count{job=~"kubernetes-service-endpoints", instance=~"(10\\.240\\.0\\.5:9093|10\\.240\\.0\\.76:9093|10\\.240\\.0\\.26:9114|10\\.240\\.0\\.253:8080|10\\.240\\.0\\.94:9090|10\\.240\\.1\\.199:9090|10\\.240\\.2\\.4:9090|10\\.240\\.2\\.204:9121|10\\.240\\.2\\.245:9121|10\\.240\\.3\\.10:9121)"}[5m])
An example of this panel is shown below:
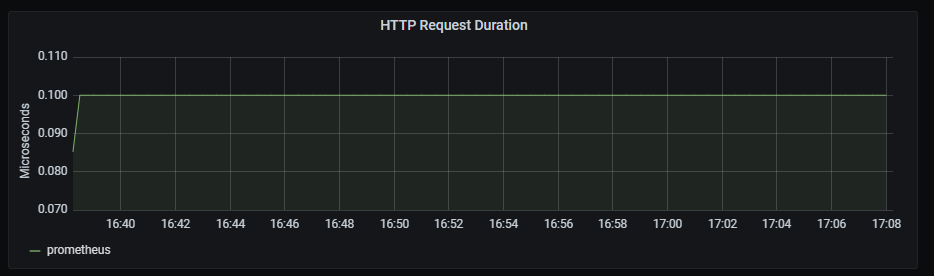
Time series with the HTTP request duration, aggregated by one minute.
The x-axis shows the time series and the y-axis shows the http request duration.
The queries used to get the panel information are:
sum(rate(http_request_duration_microseconds_count{job=~"kubernetes-service-endpoints",instance=~"(10\\.240\\.0\\.5:9093|10\\.240\\.0\\.76:9093|10\\.240\\.0\\.26:9114|10\\.240\\.0\\.253:8080|10\\.240\\.0\\.94:9090|10\\.240\\.1\\.199:9090|10\\.240\\.2\\.4:9090|10\\.240\\.2\\.204:9121|10\\.240\\.2\\.245:9121|10\\.240\\.3\\.10:9121)"}[1m])) by (handler) > 0
An example of this panel is shown below:
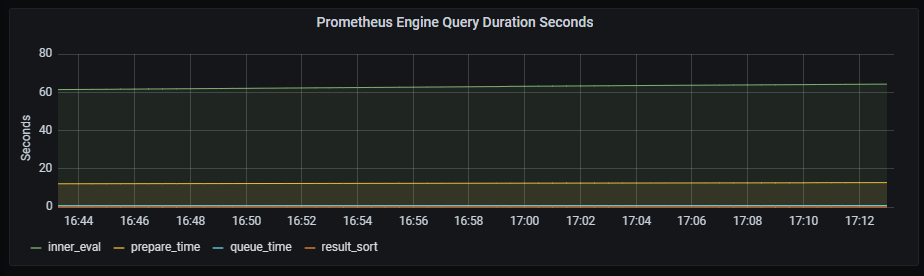
Time series with the engine query duration in seconds.
The x-axis shows the time series and the y-axis shows the engine query duration.
The queries used to get the panel information are:
sum(prometheus_engine_query_duration_seconds_sum{job=~"kubernetes-service-endpoints",instance=~"(10\\.240\\.0\\.5:9093|10\\.240\\.0\\.76:9093|10\\.240\\.0\\.26:9114|10\\.240\\.0\\.253:8080|10\\.240\\.0\\.94:9090|10\\.240\\.1\\.199:9090|10\\.240\\.2\\.4:9090|10\\.240\\.2\\.204:9121|10\\.240\\.2\\.245:9121|10\\.240\\.3\\.10:9121)"}) by (slice)
An example of this panel is shown below:
Time series with the number of scheduled rule group evaluations, whether executed, missed or skipped.
The x-axis shows the time series and the y-axis shows the number of scheduled rule group evaluations.
The queries used to get the panel information are:
sum(rate(prometheus_evaluator_iterations_total{job=~"kubernetes-service-endpoints", instance=~"(10\\.240\\.0\\.5:9093|10\\.240\\.0\\.76:9093|10\\.240\\.0\\.26:9114|10\\.240\\.0\\.253:8080|10\\.240\\.0\\.94:9090|10\\.240\\.1\\.199:9090|10\\.240\\.2\\.4:9090|10\\.240\\.2\\.204:9121|10\\.240\\.2\\.245:9121|10\\.240\\.3\\.10:9121)"}[5m]))
sum(rate(prometheus_evaluator_iterations_missed_total{job=~"kubernetes-service-endpoints", instance=~"(10\\.240\\.0\\.5:9093|10\\.240\\.0\\.76:9093|10\\.240\\.0\\.26:9114|10\\.240\\.0\\.253:8080|10\\.240\\.0\\.94:9090|10\\.240\\.1\\.199:9090|10\\.240\\.2\\.4:9090|10\\.240\\.2\\.204:9121|10\\.240\\.2\\.245:9121|10\\.240\\.3\\.10:9121)"}[5m]))
sum(rate(prometheus_evaluator_iterations_skipped_total{job=~"kubernetes-service-endpoints", instance=~"(10\\.240\\.0\\.5:9093|10\\.240\\.0\\.76:9093|10\\.240\\.0\\.26:9114|10\\.240\\.0\\.253:8080|10\\.240\\.0\\.94:9090|10\\.240\\.1\\.199:9090|10\\.240\\.2\\.4:9090|10\\.240\\.2\\.204:9121|10\\.240\\.2\\.245:9121|10\\.240\\.3\\.10:9121)"}[5m]))
An example of this panel is shown below:
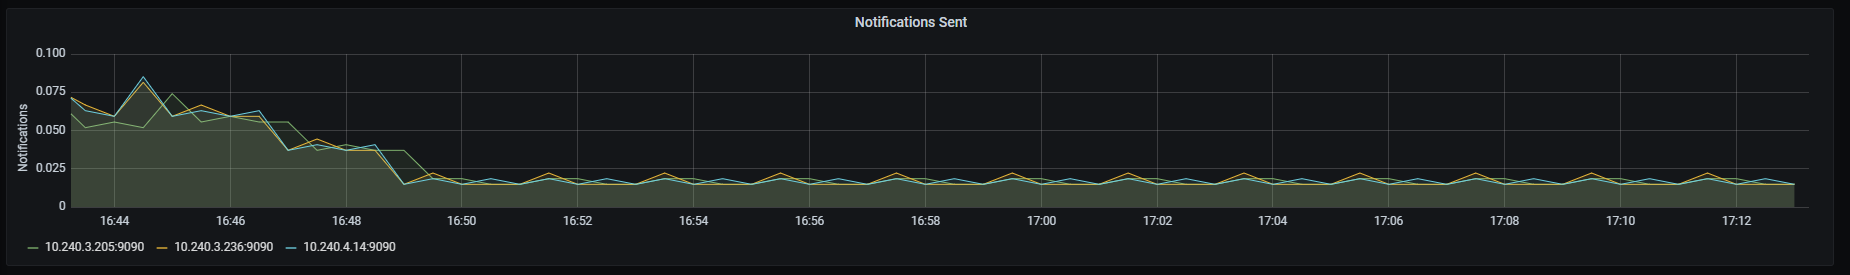
Time series with the rate of sent notifications, aggregated by 5 minutes.
The x-axis shows the time series and the y-axis shows the rate of sent notifications.
The queries used to get the panel information are:
rate(prometheus_notifications_sent_total[5m])
An example of this panel is shown below:
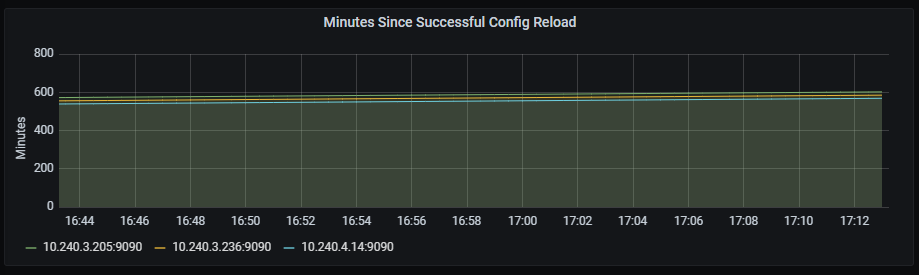
Time series with the number of minutes since the last successful config reload.
The x-axis shows the time series and the y-axis shows the number of minutes since the last successful reload.
The queries used to get the panel information are:
(time() - prometheus_config_last_reload_success_timestamp_seconds{job=~"kubernetes-service-endpoints",instance=~"(10\\.240\\.0\\.5:9093|10\\.240\\.0\\.76:9093|10\\.240\\.0\\.26:9114|10\\.240\\.0\\.253:8080|10\\.240\\.0\\.94:9090|10\\.240\\.1\\.199:9090|10\\.240\\.2\\.4:9090|10\\.240\\.2\\.204:9121|10\\.240\\.2\\.245:9121|10\\.240\\.3\\.10:9121)"}) / 60
An example of this panel is shown below:
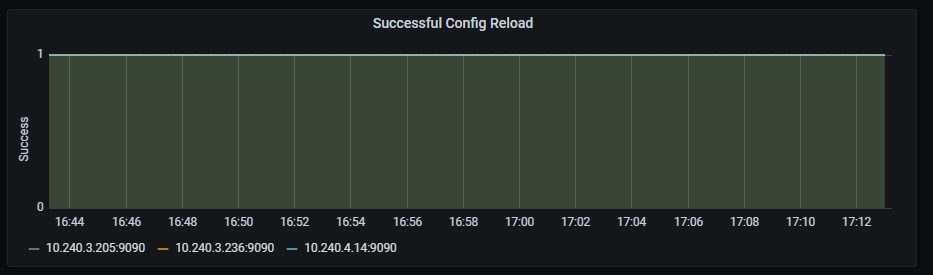
Time series with the last successful reload.
The x-axis shows the time series and the y-axis shows the last successful reload.
The queries used to get the panel information are:
prometheus_config_last_reload_successful{job=~"kubernetes-service-endpoints",instance=~"(10\\.240\\.0\\.5:9093|10\\.240\\.0\\.76:9093|10\\.240\\.0\\.26:9114|10\\.240\\.0\\.253:8080|10\\.240\\.0\\.94:9090|10\\.240\\.1\\.199:9090|10\\.240\\.2\\.4:9090|10\\.240\\.2\\.204:9121|10\\.240\\.2\\.245:9121|10\\.240\\.3\\.10:9121)"}
An example of this panel is shown below:
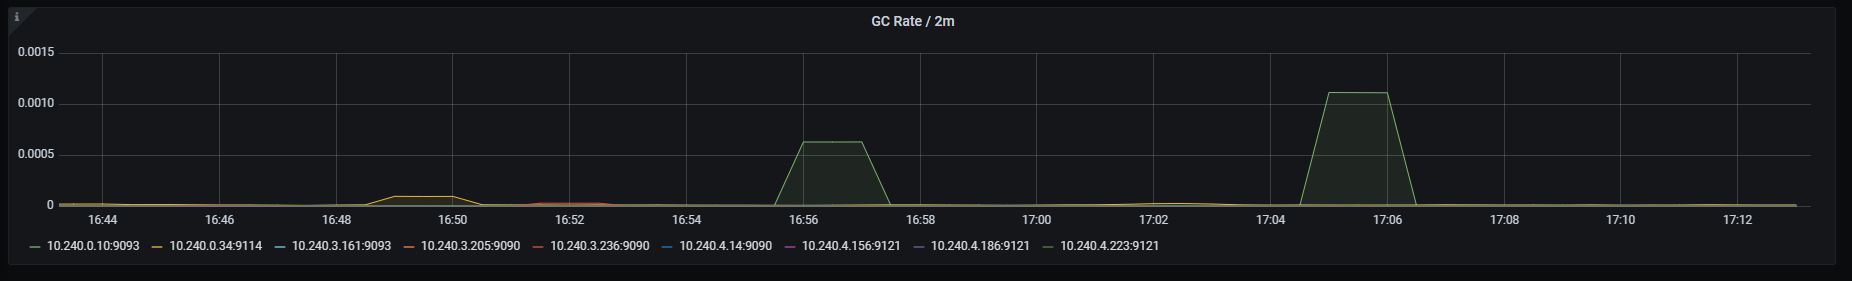
Time series with the GC invocation durations rate, aggregated by two minutes.
The x-axis shows the time series and the y-axis shows the GC invocation durations rate.
The queries used to get the panel information are:
sum(rate(go_gc_duration_seconds_sum{instance=~"(10\\.240\\.0\\.5:9093|10\\.240\\.0\\.76:9093|10\\.240\\.0\\.26:9114|10\\.240\\.0\\.253:8080|10\\.240\\.0\\.94:9090|10\\.240\\.1\\.199:9090|10\\.240\\.2\\.4:9090|10\\.240\\.2\\.204:9121|10\\.240\\.2\\.245:9121|10\\.240\\.3\\.10:9121)",job=~"kubernetes-service-endpoints"}[2m])) by (instance)
An example of this panel is shown below:
Information provided by Redis dashboard
Redis dashboard monitors multiple data and service-related metrics.
The available metrics are defined in the following sections.
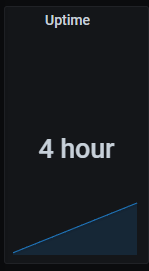
Uptime graph shows time since last restart/shutdown.
Metrics:
max(max_over_time(redis_uptime_in_seconds{kubernetes_name=~"redis-announce-0"}[$__interval]))
Clients graph shows number of connected clients.
Metrics:
redis_connected_clients{kubernetes_name=~"redis-announce-0"}

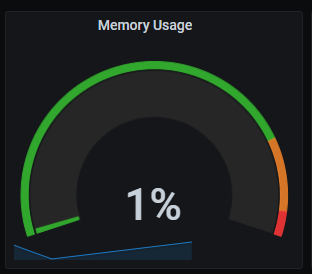
Memory usage graph shows percentage of used memory.
Metrics:
100 * (redis_memory_used_bytes{kubernetes_name=~"redis-announce-0"} / redis_memory_max_bytes{kubernetes_name=~"redis-announce-0"} )
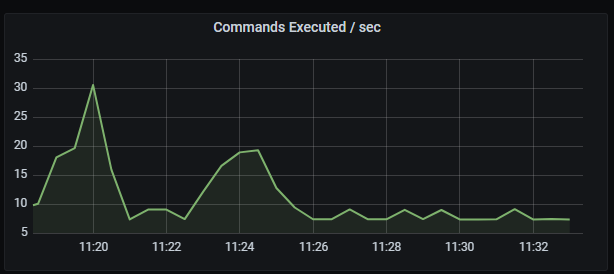
Commands executed per second graph shows the rate of commands executed per second, aggregated by one minute.
Metrics:
rate(redis_commands_processed_total{kubernetes_name=~"redis-announce-0"}[1m])
Commands executed per second graph shows the rate of commands executed per second, aggregated by one minute.
Metrics:
rate(redis_commands_processed_total{kubernetes_name=~"redis-announce-0"}[1m])
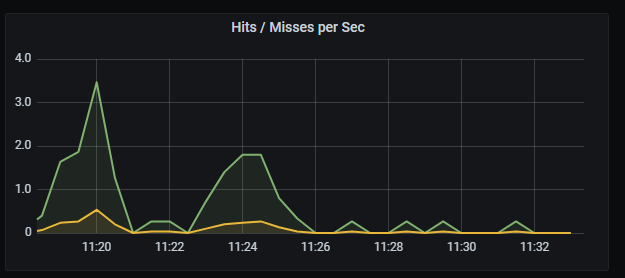
Hits/missed per second graph shows the rate of hits and misses per second, aggregated by five minutes.
Metrics: It includes two metrics:
irate(redis_keyspace_hits_total{kubernetes_name=~"redis-announce-0"}[5m])
irate(redis_keyspace_hits_total{kubernetes_name=~"redis-announce-0"}[5m])
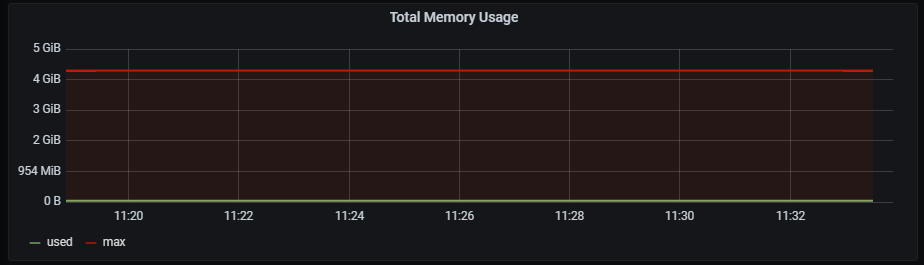
Total memory usage graph shows total memory usage and total memory free + used.
Metrics: It includes two metrics:
redis_memory_used_bytes{kubernetes_name=~"redis-announce-0"}
redis_memory_max_bytes{kubernetes_name=~"redis-announce-0"}
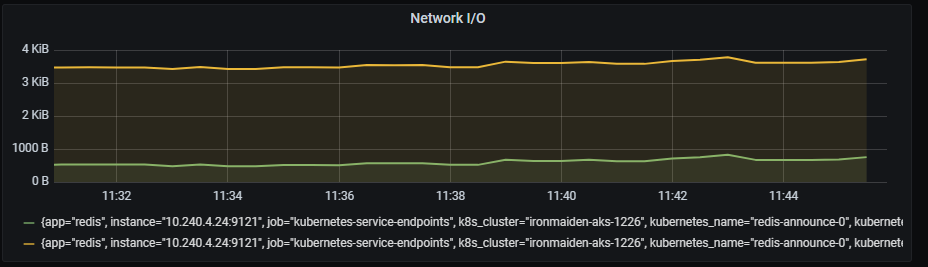
Network I/O graph shows rate of total in/out bytes, aggregated by 5 minutes.
Metrics: It includes two metrics:
rate(redis_net_input_bytes_total{kubernetes_name=~"redis-announce-0"}[5m])
rate(redis_net_output_bytes_total{kubernetes_name=~"redis-announce-0"}[5m])
Total items per DB graph shows total number of items separated by db number.
Metrics:
sum (redis_db_keys{kubernetes_name=~"redis-announce-0"}) by (db) > 0
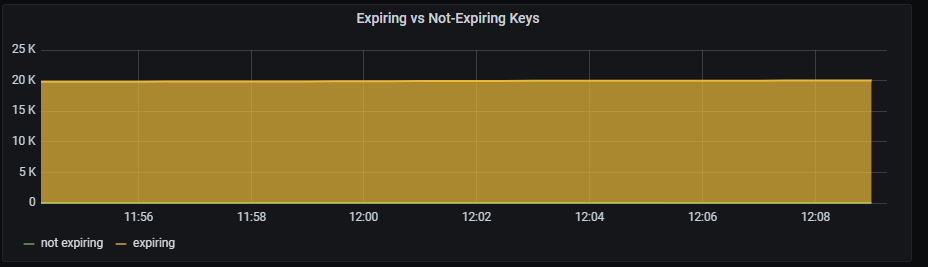
Expiring vs not-expiring keys graph shows total number of expiring and not expiring keys.
Metrics: It includes two metrics:
sum (redis_db_keys{kubernetes_name=~"redis-announce-0"}) - sum (redis_db_keys_expiring{kubernetes_name=~"redis-announce-0"})
sum (redis_db_keys_expiring{kubernetes_name=~"redis-announce-0"})
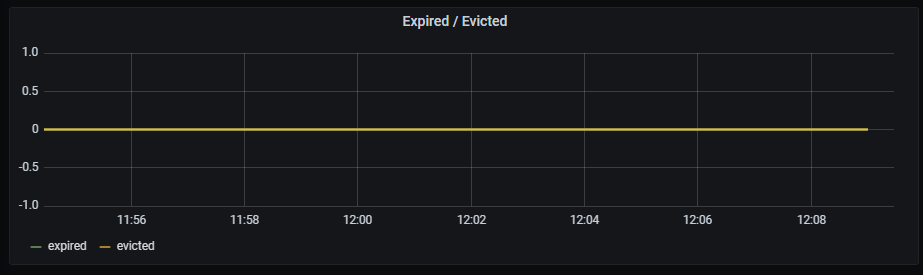
Expired/evicted graph shows total number of expired and evicted keys, aggregated by 5 minutes.
Metrics: It includes two metrics:
sum(rate(redis_expired_keys_total{kubernetes_name=~"redis-announce-0"}[5m])) by (kubernetes_name)
sum(rate(redis_evicted_keys_total{kubernetes_name=~"redis-announce-0"}[5m])) by (kubernetes_name)
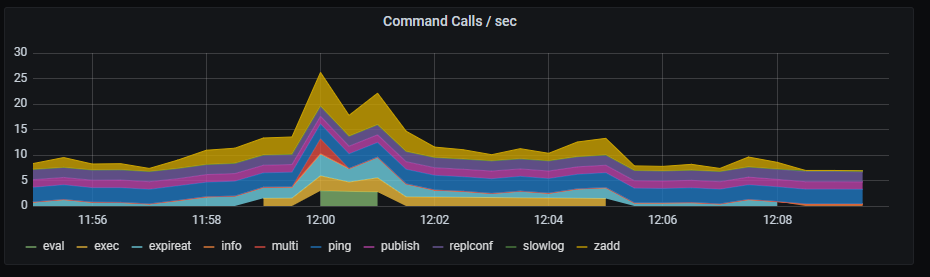
Command calls per second graph shows top commands number of executions rate, aggregated by 5 minutes.
Metrics:
topk(5, irate(redis_commands_total{kubernetes_name=~"redis-announce-0"} [1m]))