Aura components dashboards
Grafana dashboards with metrics related to the performance of specific Aura components
Introduction
Currently, these are the available dashboards for Aura components in Grafana based on metrics stored in Prometheus:
This is the multi-page printable view of this section. Click here to print.
Grafana dashboards with metrics related to the performance of specific Aura components
Currently, these are the available dashboards for Aura components in Grafana based on metrics stored in Prometheus:
Information provided by Aura bot latencies dashboard
Aura bot latencies dashboard monitors outbound and inbound latencies on the request and responses handled directly by aura-bot.
The available metrics are defined in the following sections, corresponding to request errors and latency for requests, Microsoft APIs, Kernel APIs, Cognitive APIs, aura-services APIs and other APIs.
Request error graph shows the number of errors rate, aggregated by one minute.
sum by (kubernetes_namespace,path)(rate(outgoing_request_duration_seconds_count{app="aura-bot",status=~"4..|500"}[1m]))
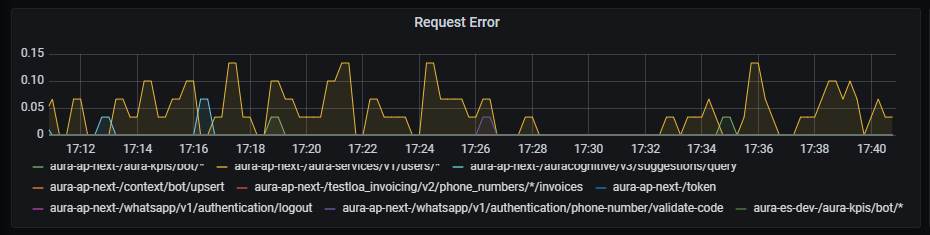
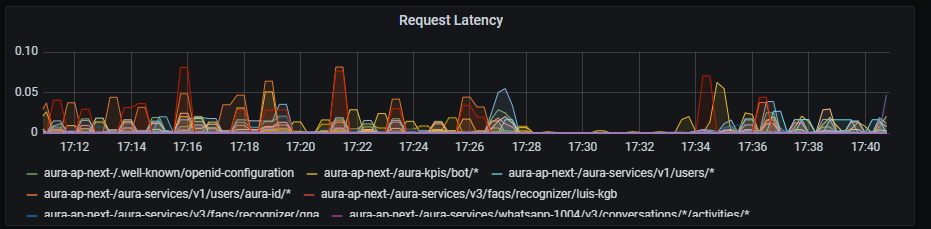
Request latency graph shows latency rate for outgoing traffic, aggregated by one minute.
sum by (path,kubernetes_namespace)(rate(outgoing_request_duration_seconds_sum{app="aura-bot"}[1m]))
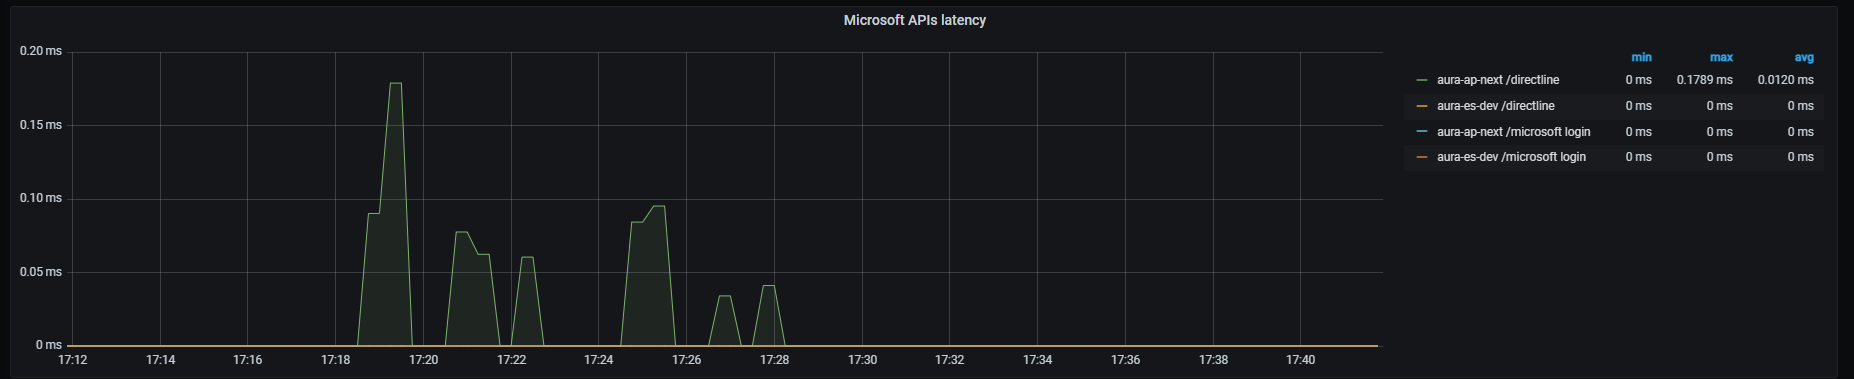
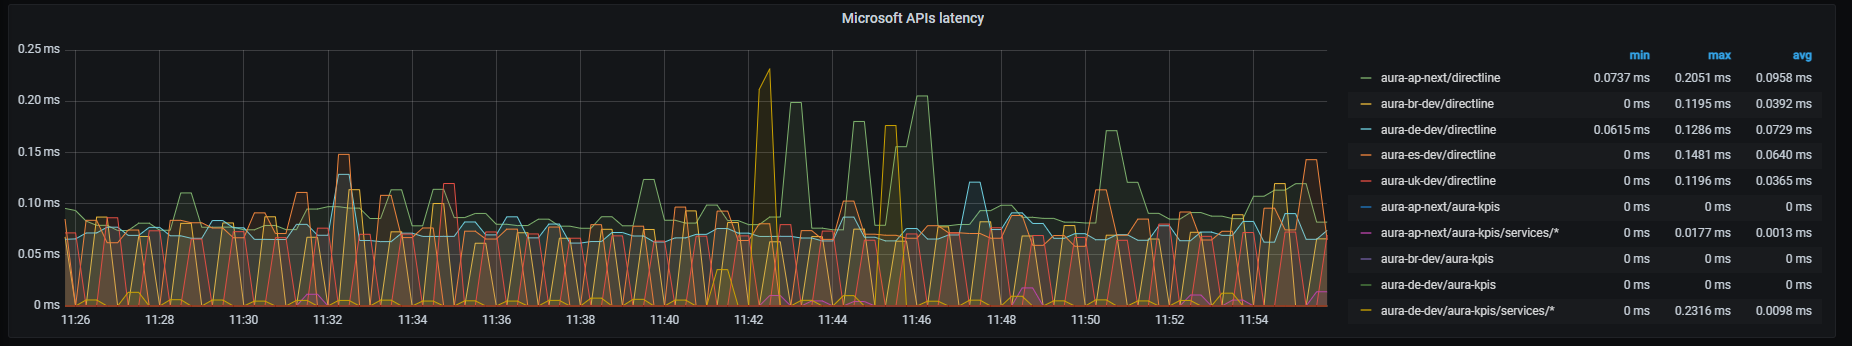
Microsoft APIs latency graph shows mean latency rate for the different Microsoft APIs used.
Currently, there are three monitored Microsoft endpoints:
sum by (path,kubernetes_namespace)(rate(outgoing_request_duration_seconds_sum{app="aura-bot",host=~"directline.botframework.com"}[1m]))/
sum by (path,kubernetes_namespace)(rate(outgoing_request_duration_seconds_count{app="aura-bot",host=~"directline.botframework.com"}[1m]))
sum by (path,kubernetes_namespace)(rate(outgoing_request_duration_seconds_sum{app="aura-bot",host=~"login.microsoftonline.com"}[1m]))/
sum by (path,kubernetes_namespace)(rate(outgoing_request_duration_seconds_count{app="aura-bot",host=~"login.microsoftonline.com"}[1m]))
sum (label_replace(outgoing_request_duration_seconds_sum{app="aura-bot",host=~"aura.*blob.core.windows.net",path=~"/aura-temporary-resources/.*"},"path_set","$1","path","/aura-temporary-resources/.*")) by (path_set,kubernetes_namespace) /
sum (label_replace(outgoing_request_duration_seconds_count{app="aura-bot",host=~"aura.*blob.core.windows.net",path=~"/aura-temporary-resources/.*"},"path_set","$1","path","/aura-temporary-resources/.*")) by (path_set,kubernetes_namespace)
Kernel APIs latency graph shows mean latency rate for the different Kernel APIs used.
Currently, there are four monitored Kernel endpoints (more can be added if necessary for a given environment):
sum by (kubernetes_namespace,path)(rate(outgoing_request_duration_seconds_sum{app="aura-bot",host=~"auth.*"}[1m]))/
sum by (kubernetes_namespace,path)(rate(outgoing_request_duration_seconds_count{app="aura-bot",host=~"auth.*"}[1m]))
sum by (kubernetes_namespace,path)(rate(outgoing_request_duration_seconds_sum{app="aura-bot",host=~"api.*",path=~"/subscribed_products/.*"}[1m]))/
sum by (kubernetes_namespace,path)(rate(outgoing_request_duration_seconds_count{app="aura-bot",host=~"api.*",path=~"/subscribed_products/.*"}[1m]))
sum by (kubernetes_namespace,path)(rate(outgoing_request_duration_seconds_sum{app="aura-bot",host=~"api.*",path=~"/userprofile/.*"}[1m]))/
sum by (kubernetes_namespace,path)(rate(outgoing_request_duration_seconds_count{app="aura-bot",host=~"api.*",path=~"/userprofile/.*"}[1m]))
sum by (kubernetes_namespace,path)(rate(outgoing_request_duration_seconds_sum{app="aura-bot",host=~"api.*",path=~"/invoicing/.*"}[1m]))/
sum by (kubernetes_namespace,path)(rate(outgoing_request_duration_seconds_count{app="aura-bot",host=~"api.*",path=~"/invoicing/.*"}[1m]))
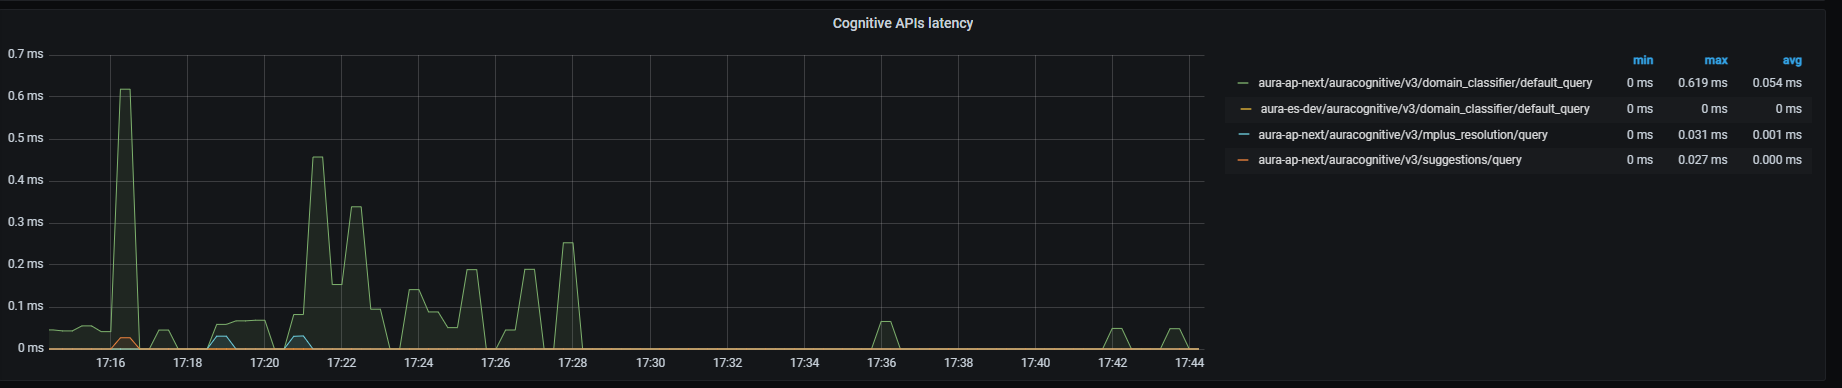
Cognitive APIs latency graph shows mean latency rate for the different cognitive APIs used.
Currently, there are three monitored Cognitive endpoints:
sum by (kubernetes_namespace,path)(rate(outgoing_request_duration_seconds_sum{app="aura-bot",host=~"api-.*",path=~"/auracognitive/v3/domain_classifier/.*"}[1m]))/
sum by (kubernetes_namespace,path)(rate(outgoing_request_duration_seconds_count{app="aura-bot",host=~"api-.*",path=~"/auracognitive/v3/domain_classifier/.*"}[1m]))
sum by (kubernetes_namespace,path)(rate(outgoing_request_duration_seconds_sum{app="aura-bot",host=~"api-.*",path=~"/auracognitive/v3/mplus_resolution/.*"}[1m]))/
sum by (kubernetes_namespace,path)(rate(outgoing_request_duration_seconds_count{app="aura-bot",host=~"api-.*",path=~"/auracognitive/v3/mplus_resolution/.*"}[1m]))
sum by (kubernetes_namespace,path)(rate(outgoing_request_duration_seconds_sum{app="aura-bot",host=~"api-.*",path=~"/auracognitive/v3/suggestions/.*"}[1m]))/
sum by (kubernetes_namespace,path)(rate(outgoing_request_duration_seconds_count{app="aura-bot",host=~"api-.*",path=~"/auracognitive/v3/suggestions/.*"}[1m]))
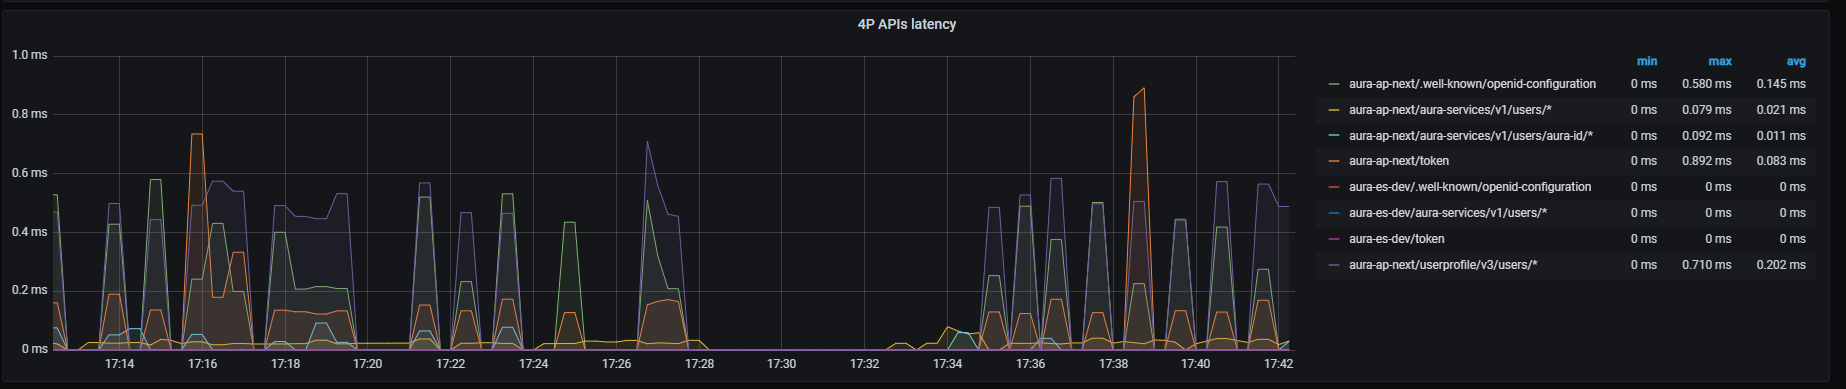
sum by (path,kubernetes_namespace)(rate(outgoing_request_duration_seconds_sum{app="aura-bot", path=~"/aura-services/.*"}[1m]))/
sum by (path,kubernetes_namespace)(rate(outgoing_request_duration_seconds_count{app="aura-bot", path=~"/aura-services/.*"}[1m]))
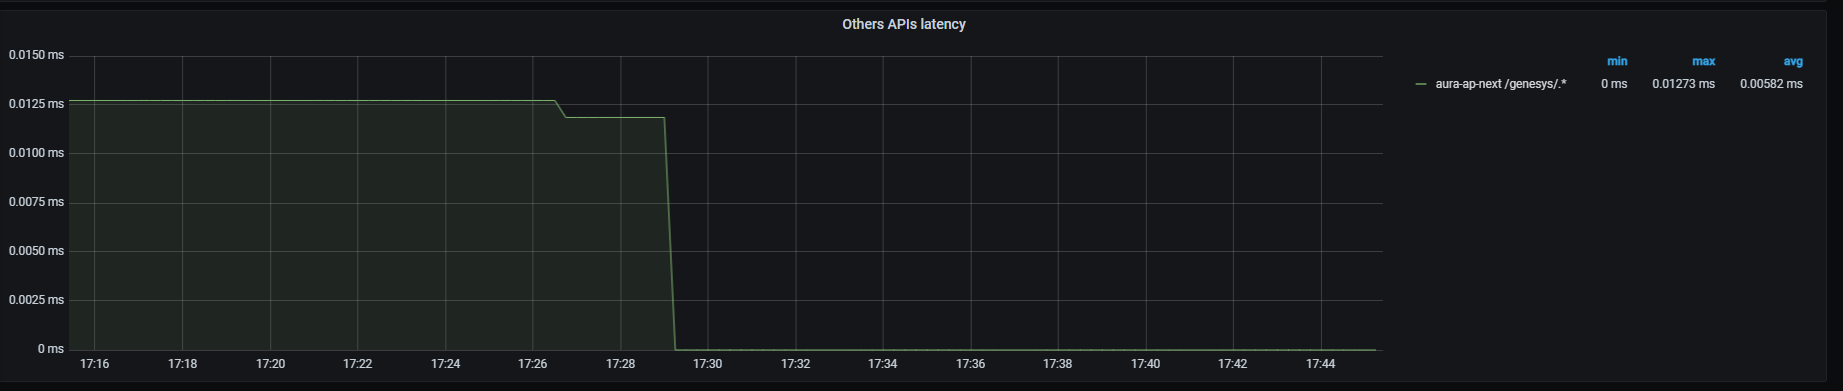
Other APIs latency graph shows mean latency rate for traffic directed to other APIs different from those above, aggregated by one minute.
Currently, the only API monitored is Genesys API:
sum (label_replace(outgoing_request_duration_seconds_sum{app="aura-bot",path=~"/genesys/.*"},"path_set","$1","path","/genesys/.*")) by (path_set,kubernetes_namespace) / sum (label_replace(outgoing_request_duration_seconds_count{app="aura-bot",path=~"/genesys/.*"},"path_set","$1","path","/genesys/.*")) by (path_set,kubernetes_namespace)
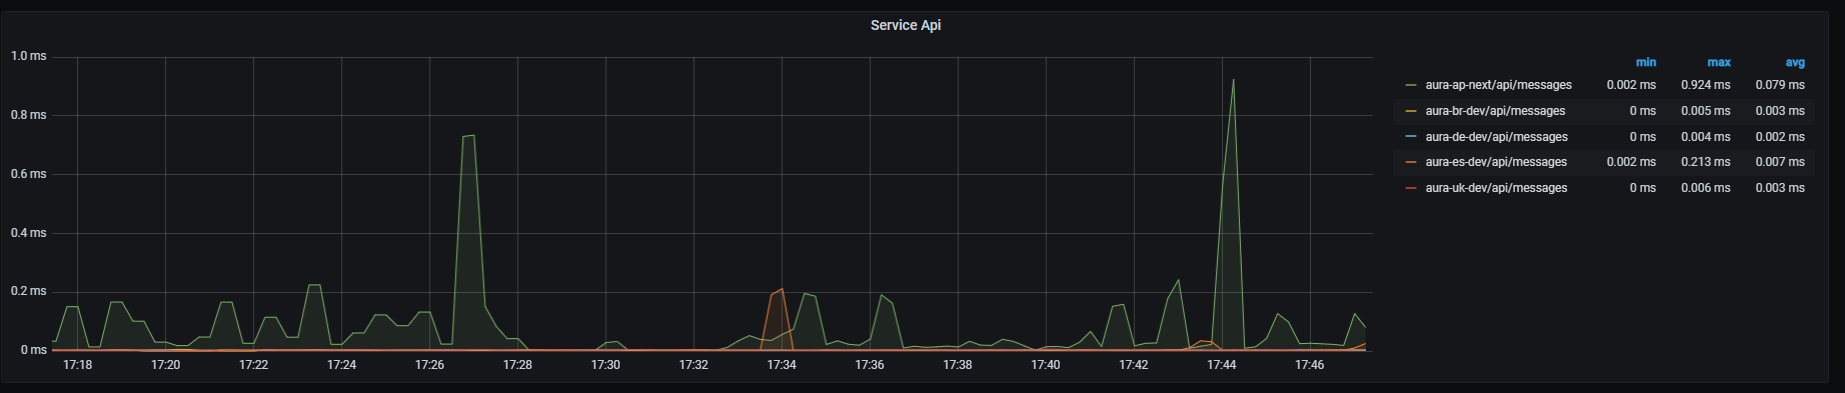
Service API graph shows mean latency rate for the main endpoint on aura-bridge, that receives requests from Direct Line and aura-bridge. Aggregated by one minute.
sum by (path,kubernetes_namespace)(rate(http_request_duration_seconds_sum{path=~"/api/messages"}[1m]))/
sum by (path,kubernetes_namespace)(rate(http_request_duration_seconds_count{path=~"/api/messages"}[1m]))
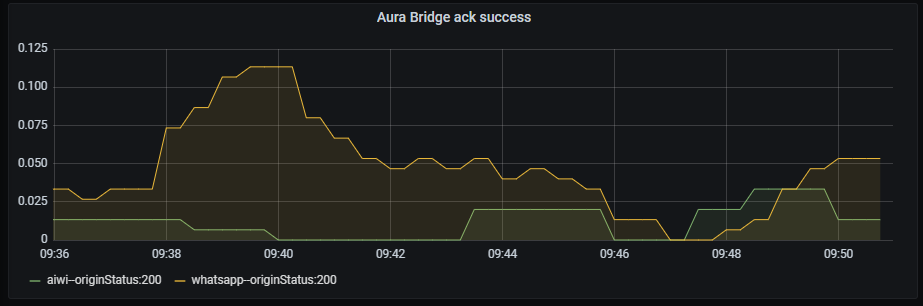
Information provided by Aura bridge dashboard
Ack success graph shows the number of successful acks rate, aggregated by three minutes.
The available metrics are defined in the following sections.
sum by (origin,originStatus)(rate(aura_response_ack_duration_seconds_count{app="aura-bridge",origin=~"aura-bot|whatsapp|4p",originStatus="200"}[3m]))
Ack error graph shows acks rate with an error status, aggregated by three minutes.
sum by (origin,originStatus)(rate(aura_response_ack_duration_seconds_count{app="aura-bridge",origin=~"aura-bot|whatsapp|4p",originStatus!="200"}[3m]))
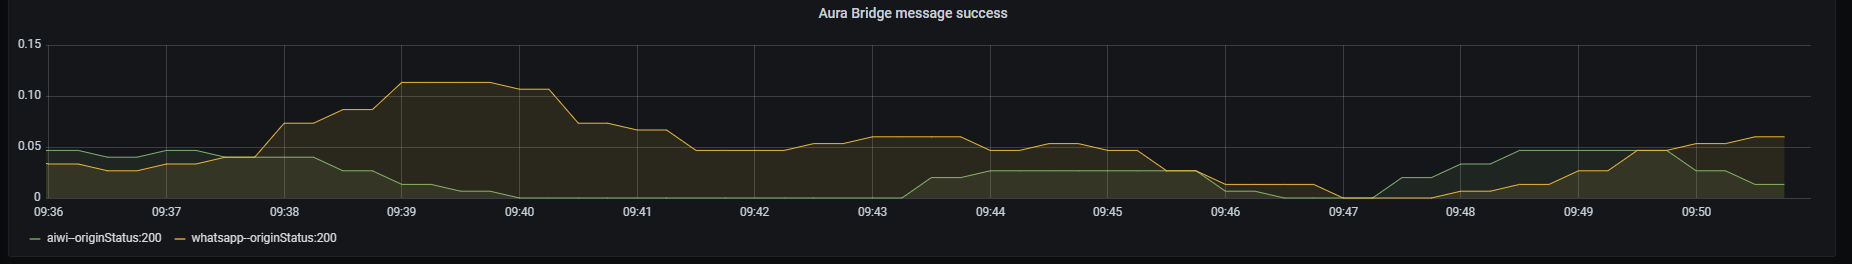
Message success graph shows the number of successful messages rate, aggregated by three minutes.
sum by (origin,originStatus)(rate(outgoing_message_duration_seconds_count{app="aura-bridge",origin=~"aura-bot|whatsapp|4p",originStatus="200"}[3m]))
Message error graph shows number of erroneous messages rate, aggregated by three minutes.
sum by (origin,originStatus)(rate(outgoing_message_duration_seconds_count{app="aura-bridge",origin=~"aura-bot|whatsapp|4p",originStatus!="200"}[3m]))
They correspond to errors that aura-bridge receives from aura-bot. Bot message error graph shows the number of erroneous messages (sent by aura-bot) rate, aggregated by three minutes.
sum by (origin,originStatus)(rate(outgoing_message_duration_seconds_count{app="aura-bridge",origin=~"aura-bot",originStatus!="200"}[3m]))
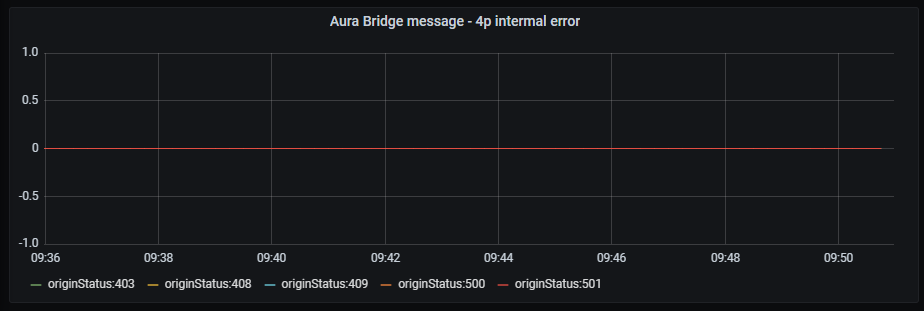
Kernel internal error graph shows number of erroneous messages (sent by Kernel) rate, regardless of the error type and aggregated by three minutes.
sum by (origin,originStatus)(rate(outgoing_message_duration_seconds_count{app="aura-bridge",origin=~"4p",originStatus!="200"}[3m]))
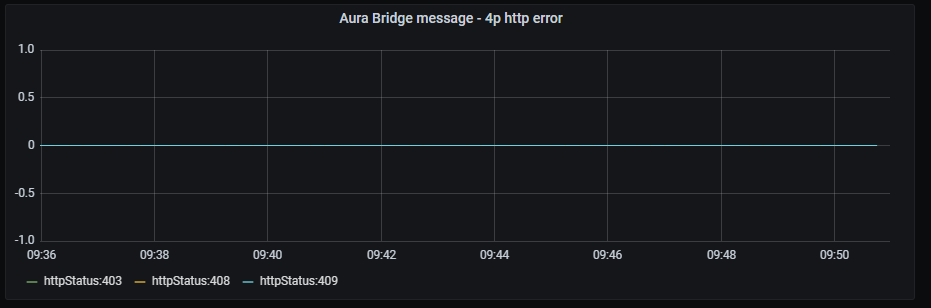
Kernel HTTP error graph shows number of erroneous messages (sent by Kernel) rate, filtered by HTTP client errors and aggregated by three minutes.
sum by (origin,httpStatus)(rate(outgoing_message_duration_seconds_count{app="aura-bridge",origin=~"4p",httpStatus=~"4.."}[3m]))
Information provided by Authentication API dashboard
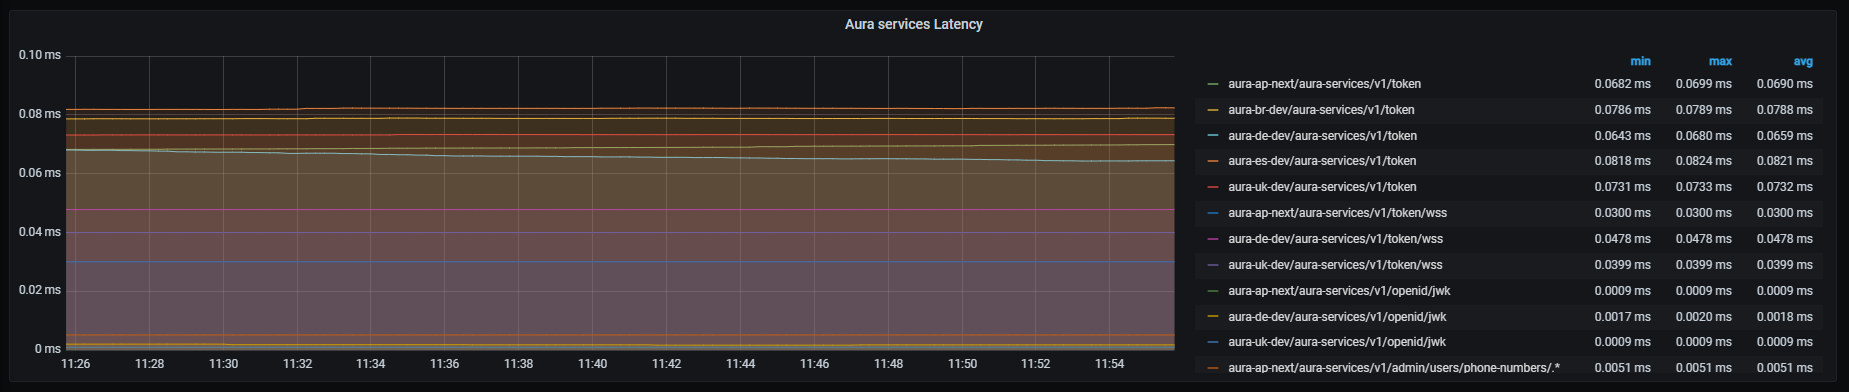
Aura services latency graph shows mean latency rate for the different incoming calls.
The available metrics are defined in the following sections.
Currently, these are the existing monitored incoming calls:
sum by (kubernetes_namespace,path)(rate(http_request_duration_seconds_sum{path=~"/aura-services/v1/users/whatsapp.*"}[1m]))/
sum by (kubernetes_namespace,path)(rate(http_request_duration_seconds_count{path=~"/aura-services/v1/users/whatsapp.*"}[1m]))
sum by (kubernetes_namespace,path)(http_request_duration_seconds_sum{app="authentication-api",path=~"/aura-services/v1/users/aura-id"})/
sum by (kubernetes_namespace,path)(http_request_duration_seconds_count{app="authentication-api",path=~"/aura-services/v1/users/aura-id"})
sum (label_replace(http_request_duration_seconds_sum{app="authentication-api",path=~"/aura-services/v1/users/aura-id/.*"},"path_set","$1","path","/aura-services/v1/users/aura-id/.*")) by (kubernetes_namespace,path_set) /
sum (label_replace(http_request_duration_seconds_count{app="authentication-api",path=~"/aura-services/v1/users/aura-id/.*"},"path_set","$1","path","/aura-services/v1/users/aura-id/.*")) by (kubernetes_namespace,path_set)
auraIdGlobal and the channelIdsum (label_replace(http_request_duration_seconds_sum{app="authentication-api",path=~"/aura-services/v1/users/aura-id-global/.*"},"path_set","$1","path","/aura-services/v1/users/aura-id-global/.*")) by (kubernetes_namespace,path_set) /
sum (label_replace(http_request_duration_seconds_count{app="authentication-api",path=~"/aura-services/v1/users/aura-id-global/.*"},"path_set","$1","path","/aura-services/v1/users/aura-id-global/.*")) by (kubernetes_namespace,path_set)
sum (label_replace(http_request_duration_seconds_sum{app="authentication-api",path=~"/aura-services/v1/users/auraid/integrated/.*"},"path_set","$1","path","/aura-services/v1/users/auraid/integrated/.*")) by (kubernetes_namespace,path_set) /
sum (label_replace(http_request_duration_seconds_count{app="authentication-api",path=~"/aura-services/v1/users/auraid/integrated/.*"},"path_set","$1","path","/aura-services/v1/users/auraid/integrated/.*")) by (kubernetes_namespace,path_set)
sum by (kubernetes_namespace,path)(http_request_duration_seconds_sum{app="authentication-api",path=~"/aura-services/v1/users/auraid/integrated/logout"})/
sum by (kubernetes_namespace,path)(http_request_duration_seconds_count{app="authentication-api",path=~"/aura-services/v1/users/auraid/integrated/logout"})
sum by (kubernetes_namespace,path)(http_request_duration_seconds_sum{app="authentication-api",path=~"/aura-services/v1/token"})/
sum by (kubernetes_namespace,path)(http_request_duration_seconds_count{app="authentication-api",path=~"/aura-services/v1/token"})
sum by (kubernetes_namespace,path)(http_request_duration_seconds_sum{app="authentication-api",path=~"/aura-services/v1/token/wss"})/
sum by (kubernetes_namespace,path)(http_request_duration_seconds_count{app="authentication-api",path=~"/aura-services/v1/token/wss"})
sum by (kubernetes_namespace,path)(http_request_duration_seconds_sum{app="authentication-api",path=~"/aura-services/v1/openid/issuer/.well-known/openid-configuration"})/
sum by (kubernetes_namespace,path)(http_request_duration_seconds_count{app="authentication-api",path=~"/aura-services/v1/openid/issuer/.well-known/openid-configuration"})
sum by (kubernetes_namespace,path)(http_request_duration_seconds_sum{app="authentication-api",path=~"/aura-services/v1/openid/jwk"})/
sum by (kubernetes_namespace,path)(http_request_duration_seconds_count{app="authentication-api",path=~"/aura-services/v1/openid/jwk"})
sum (label_replace(http_request_duration_seconds_sum{app="authentication-api",path=~"/users/aura-id/.*"},"path_set","$1","path","/users/aura-id/.*")) by (kubernetes_namespace,path_set) /
sum (label_replace(http_request_duration_seconds_count{app="authentication-api",path=~"/users/aura-id/.*"},"path_set","$1","path","/users/aura-id/.*")) by (kubernetes_namespace,path_set)
sum (label_replace(http_request_duration_seconds_sum{app="authentication-api",path=~"/aura-services/v1/admin/users/phone-numbers/.*"},"path_set","$1","path","/aura-services/v1/admin/users/phone-numbers/.*")) by (kubernetes_namespace,path_set) /
sum (label_replace(http_request_duration_seconds_count{app="authentication-api",path=~"/aura-services/v1/admin/users/phone-numbers/.*"},"path_set","$1","path","/aura-services/v1/admin/users/phone-numbers/.*")) by (kubernetes_namespace,path_set)
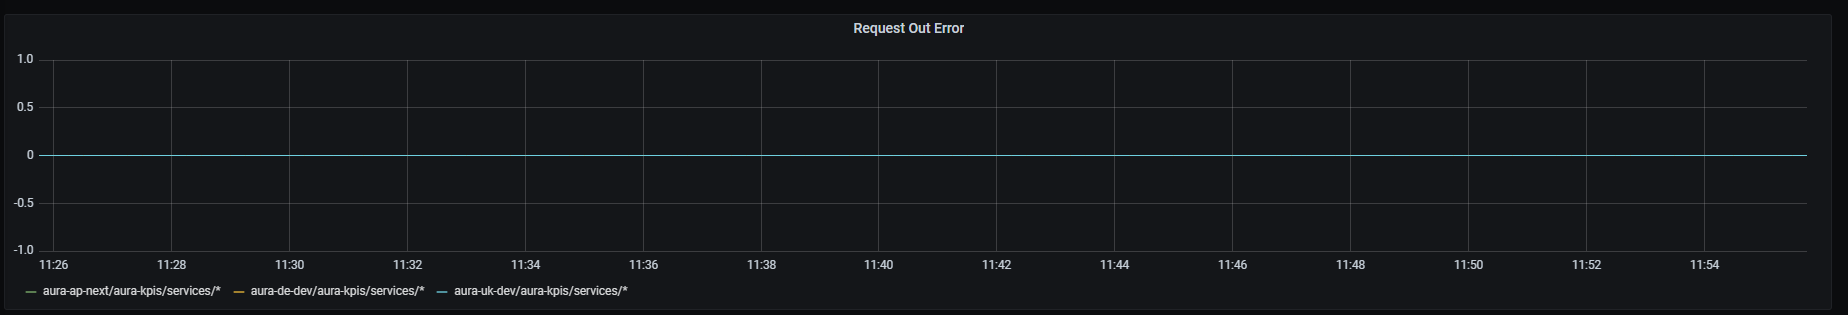
Request out error graph shows error rate for outgoing requests with HTTP codes 4xx and 5xx, aggregated by 1 minute.
sum by (kubernetes_namespace,path)(rate(outgoing_request_duration_seconds_count{app="authentication-api",status=~"4..|5.."}[1m]))
Microsoft APIs latency graph shows mean latency rate for the different Microsoft APIs used.
Currently, there are three monitored Microsoft endpoints:
sum by (kubernetes_namespace,path)(rate(outgoing_request_duration_seconds_sum{app="authentication-api",host=~"directline.botframework.com"}[1m]))/
sum by (kubernetes_namespace,path)(rate(outgoing_request_duration_seconds_count{app="authentication-api",host=~"directline.botframework.com"}[1m]))
sum by (kubernetes_namespace,path)(rate(outgoing_request_duration_seconds_sum{app="authentication-api",host=~"login.microsoftonline.com"}[1m]))/
sum by (kubernetes_namespace,path)(rate(outgoing_request_duration_seconds_count{app="authentication-api",host=~"login.microsoftonline.com"}[1m]))
sum by (kubernetes_namespace,path)(rate(outgoing_request_duration_seconds_sum{app="authentication-api",host=~"aura.*.blob.core.windows.net"}[1m]))/
sum by (kubernetes_namespace,path)(rate(outgoing_request_duration_seconds_count{app="authentication-api",host=~"aura.*.blob.core.windows.net"}[1m]))
Kernel APIs latency graph shows mean latency rate for the different Kernel APIs used.
Currently, there are three monitored Kernel endpoints:
sum by (kubernetes_namespace,path)(rate(outgoing_request_duration_seconds_sum{app="authentication-api",host=~"auth.*",path="/token"}[1m]))/
sum by (kubernetes_namespace,path)(rate(outgoing_request_duration_seconds_count{app="authentication-api",host=~"auth.*",path="/token"}[1m]))
sum by (kubernetes_namespace,path)(rate(outgoing_request_duration_seconds_sum{app="authentication-api",host=~"api.*",path=~"/token-introspection/.*"}[1m]))/
sum by (kubernetes_namespace,path)(rate(outgoing_request_duration_seconds_count{app="authentication-api",host=~"api.*",path=~"/token-introspection/.*"}[1m]))
sum by (kubernetes_namespace,path)(rate(outgoing_request_duration_seconds_sum{app="authentication-api",host=~"auth.*",path="/.well-known/openid-configuration"}[1m]))/
sum by (kubernetes_namespace,path)(rate(outgoing_request_duration_seconds_count{app="authentication-api",host=~"auth.*",path="/.well-known/openid-configuration"}[1m]))
Information provided Aura HTTP inbound dashboard
HTTP inbound dashboard monitors inbound traffic to different services.
This inbound traffic can be visualized by channel, thus providing a detailed insight into the specific incoming traffic to this particular channel. It clearly improves the optimization of strategies for that channel or a performance comparison between different channels.
The available metrics are defined in the following sections.
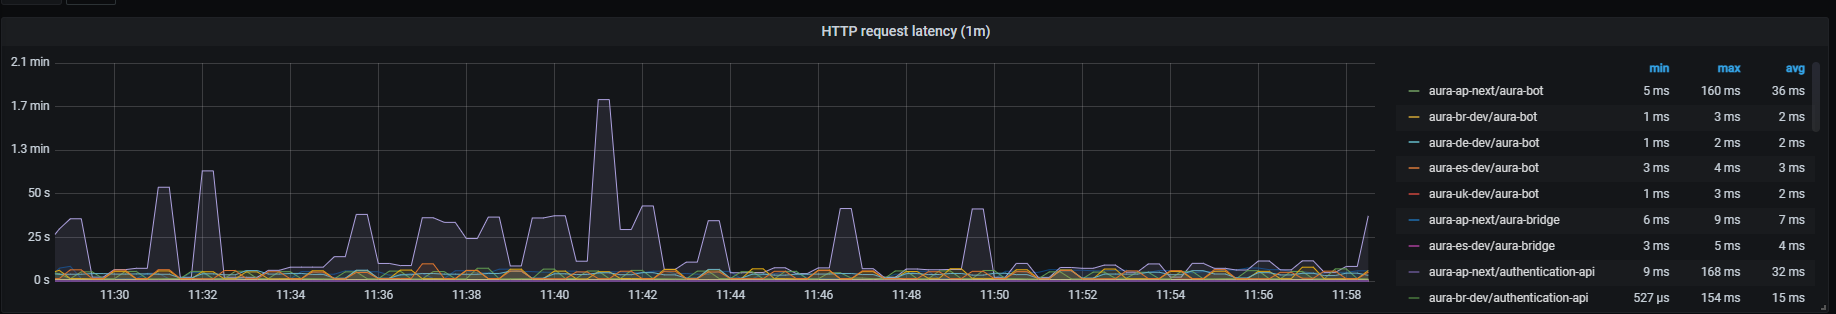
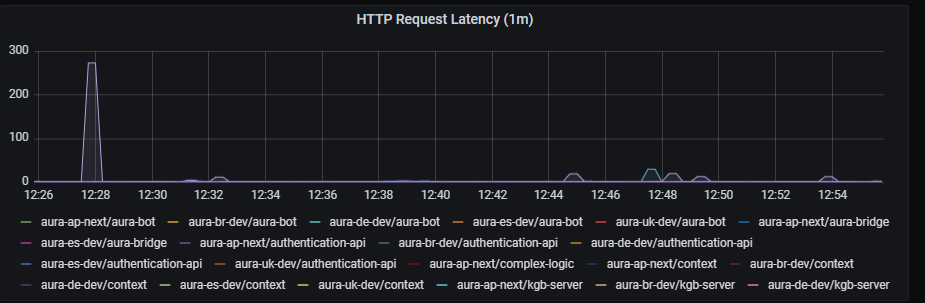
HTTP request latency graph shows mean latency time aggregated by one minute.
sum by (app, kubernetes_namespace)(rate(http_request_duration_seconds_sum{app=~'(aura-bot|aura-bridge|authentication-api|complex-logic|context|nlp|tac|thanos-querier)'}[1m])) /
sum by (app, kubernetes_namespace)(rate(http_request_duration_seconds_count{app=~'(aura-bot|aura-bridge|authentication-api|complex-logic|context|nlp|tac|thanos-querier)'}[1m]))
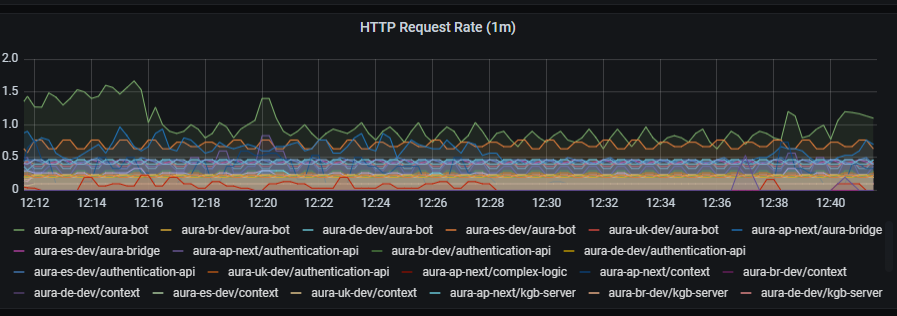
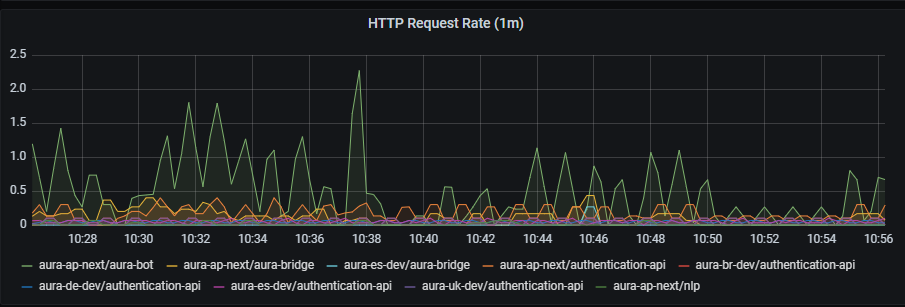
HTTP requests rate graph shows number of requests aggregated by one minute.
sum by (app, kubernetes_namespace) (rate(http_request_duration_seconds_count{app=~'(aura-bot|aura-bridge|authentication-api|complex-logic|context|nlp|tac|thanos-querier)'}[1m]))
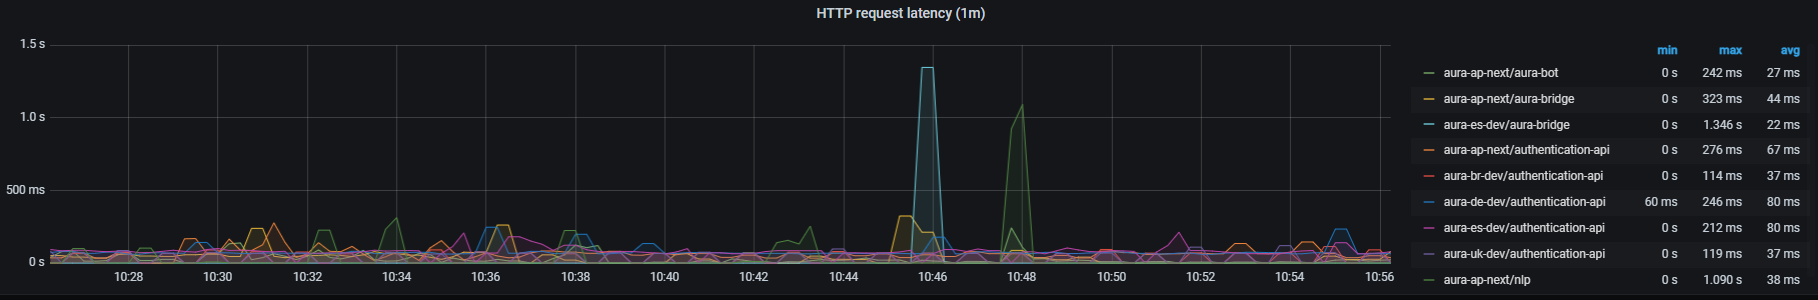
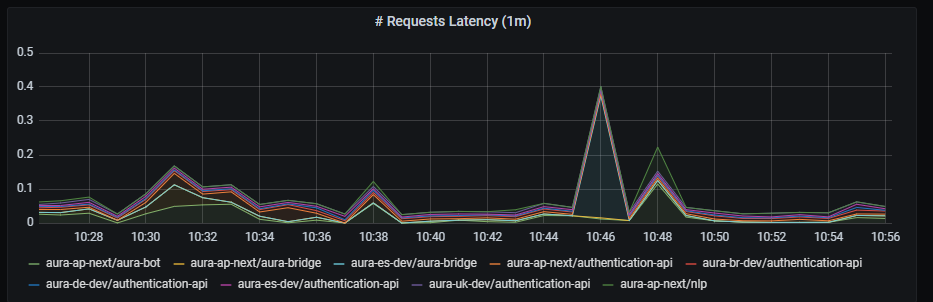
HTTP request latency graph shows request latency aggregated by one minute.
sum by (app, kubernetes_namespace) (rate(http_request_duration_seconds_sum{app=~'(aura-bot|aura-bridge|authentication-api|complex-logic|context|nlp|tac|thanos-querier)'}[1m]))
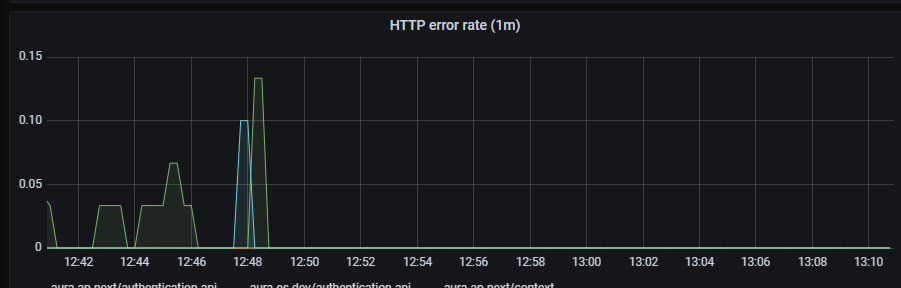
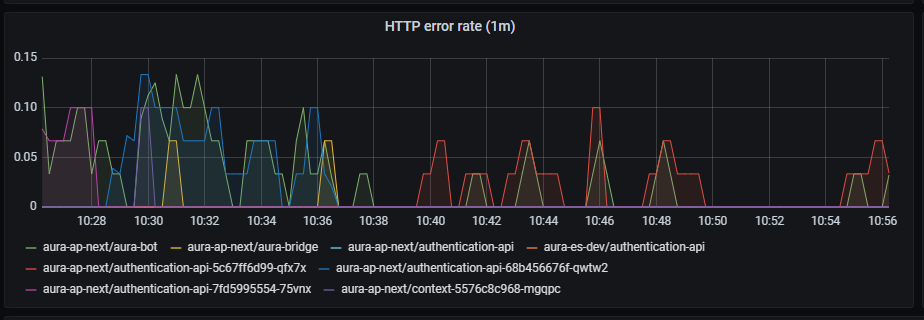
HTTP error rate shows rate of petition errors aggregated by one minute.
sum by (app, kubernetes_namespace) (rate(http_request_duration_seconds_count{app=~'(aura-bot|aura-bridge|authentication-api|complex-logic|context|nlp|tac|thanos-querier)',status_code=~"4..|5.."}[1m]))
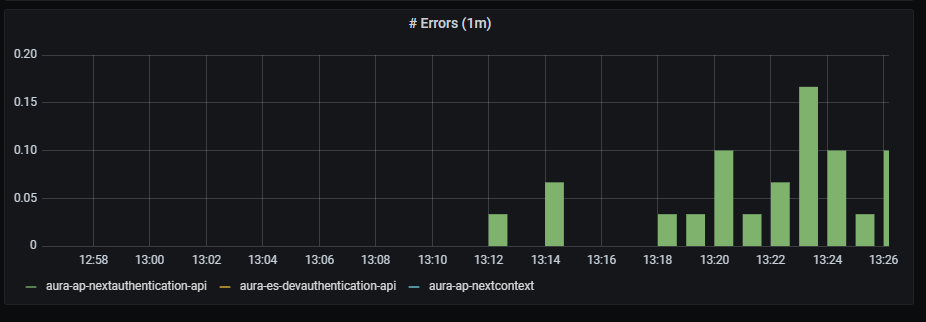
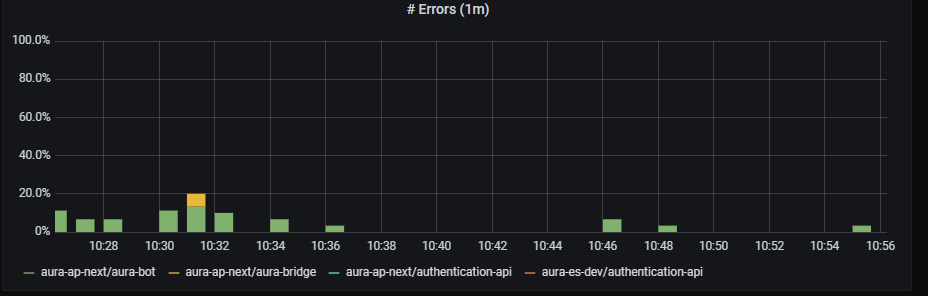
Errors graph shows errors duration aggregated by one minute.
sum(rate(http_request_duration_seconds_count{app=~'(aura-bot|aura-bridge|authentication-api|complex-logic|context|nlp|tac|thanos-querier)',status_code=~"4..|5.."}[1m])) by (app, kubernetes_namespace)
Information provided Aura HTTP outbound dashboard
HTTP outbound dashboard monitors outbound traffic to different services.
This outbound traffic can be visualized by channel, thus providing a detailed insight into the specific outgoing traffic from this particular channel. It clearly improves the optimization of strategies for that channel or a performance comparison between different channels.
The available metrics are defined in the following sections.
HTTP request latency graph shows mean latency time aggregated by one minute.
sum by (app,kubernetes_namespace)(rate(outgoing_request_duration_seconds_sum{app=~'.*'}[1m])) / sum by (app,kubernetes_namespace)(rate(outgoing_request_duration_seconds_count{app=~'.*'}[1m]))
HTTP requests rate graph shows requests rate per second, aggregated by one minute.
sum by (app,kubernetes_namespace) (rate(outgoing_request_duration_seconds_count{app=~'.*'}[1m]))
HTTP request latency graph shows request latency rate per second, aggregated by one minute.
sum by (app,kubernetes_namespace) (rate(outgoing_request_duration_seconds_sum{app=~'.*'}[1m]))
HTTP error rate shows request errors rate per second, aggregated by one minute
sum by (app,kubernetes_namespace) (rate(outgoing_request_duration_seconds_count{app=~'.*',status=~"4..|5.."}[1m]))
Errors graph shows errors duration aggregated by one minute.
sum(rate(outgoing_request_duration_seconds_count{app=~'.*',status=~"4..|5.."}[1m])) by (app,kubernetes_namespace)
aura-bot backend latency shows mean latency rate on aura-bot backend, aggregated by one minute.
sum(rate(outgoing_request_duration_seconds_sum{app=~"aura-bot"}[1m])) by (path,kubernetes_namespace)/sum(rate(outgoing_request_duration_seconds_count{app=~"aura-bot"}[1m])) by (path,kubernetes_namespace)
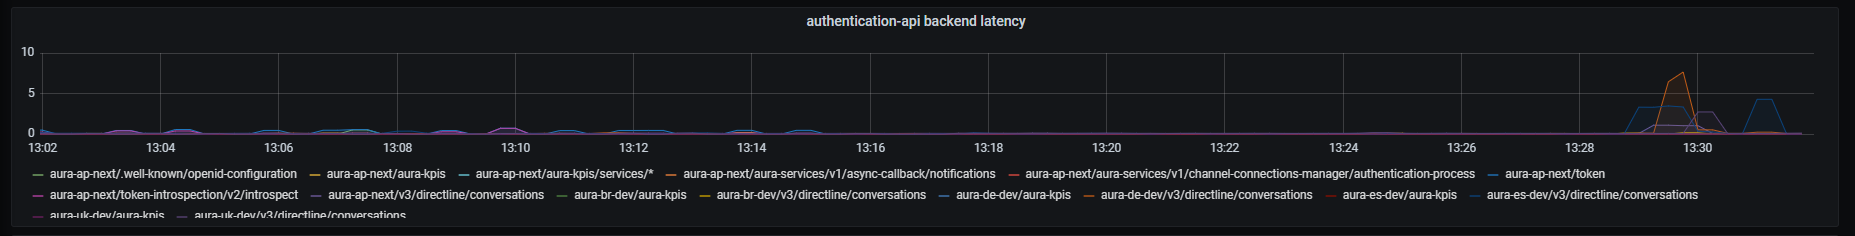
aura-authentication-api backend latency shows mean latency rate on aura-authentication-api backend, aggregated by one minute.
sum(rate(outgoing_request_duration_seconds_sum{app=~"authentication-api"}[1m])) by (path,kubernetes_namespace)/sum(rate(outgoing_request_duration_seconds_count{app=~"authentication-api"}[1m])) by (path,kubernetes_namespace)
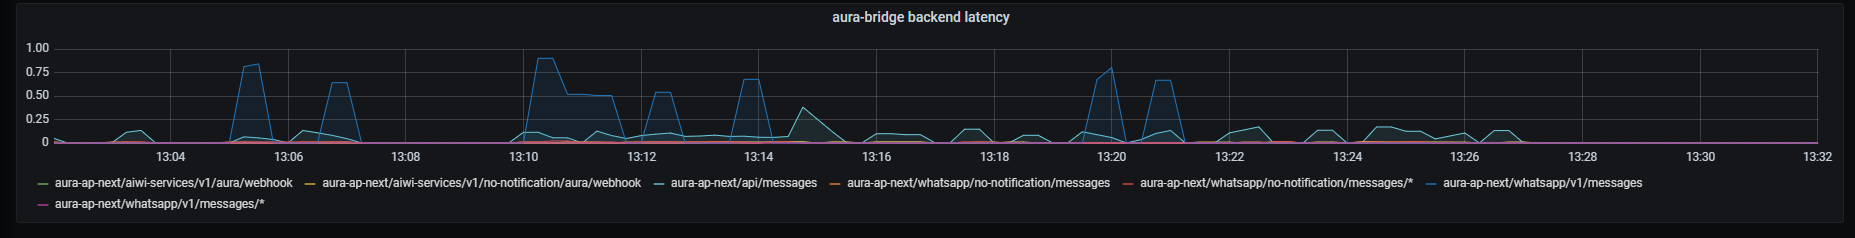
aura-bridge backend latency shows mean latency rate on aura-bridge backend, aggregated by one minute.
sum(rate(outgoing_request_duration_seconds_sum{app=~"aura-bridge"}[1m])) by (path,kubernetes_namespace)/sum(rate(outgoing_request_duration_seconds_count{app=~"aura-bridge"}[1m])) by (path,kubernetes_namespace)
Information provided by Pod resources dashboard
This is a unique dashboard to obtain the most basic information about how the environment pods behavior is.
To get the information about each pod, the dashboard counts on a filter with the following fields:
namespace: list of all the available namespaces of your deployment.pod: list of pods running in the selected namespace.container: list of containers running in the selected pod.DS_PROMETHEUS: Prometheus data source to be used. By default, Prometheus.Once selected, the following graphs are printed, with the data of the pod.
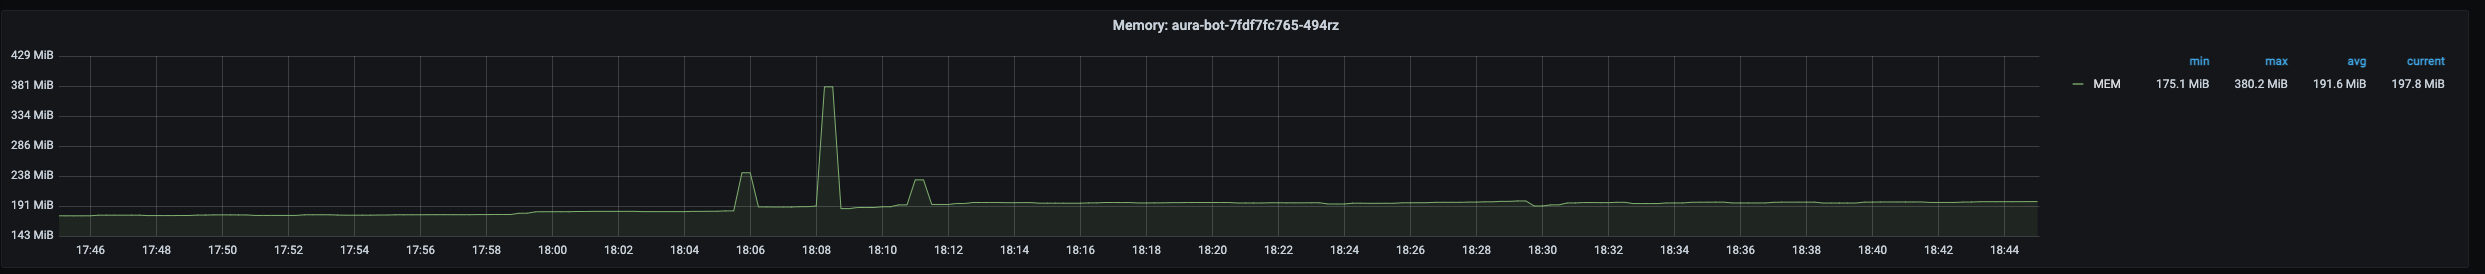
Pod memory panel shows a time series with the current memory consumption in the selected pod. It also shows the current, maximum, minimum and average memory consumption of the Pod.
The x-axis shows the time series and the y-axis shows the amount of memory consumed by the pod.
The queries used to get the panel information are:
sum(kube_pod_container_resource_requests_memory_bytes{namespace="aura-<env>",pod="aura-bot-<id>"})
sum(kube_pod_container_resource_limits_memory_bytes{namespace="aura-<env>",pod="aura-bot-<id>"})
sum(container_memory_working_set_bytes{namespace="aura-<dev>",container!="POD",container!="",pod!="", pod="aura-bot-<id>"})
An example of this panel is shown below:
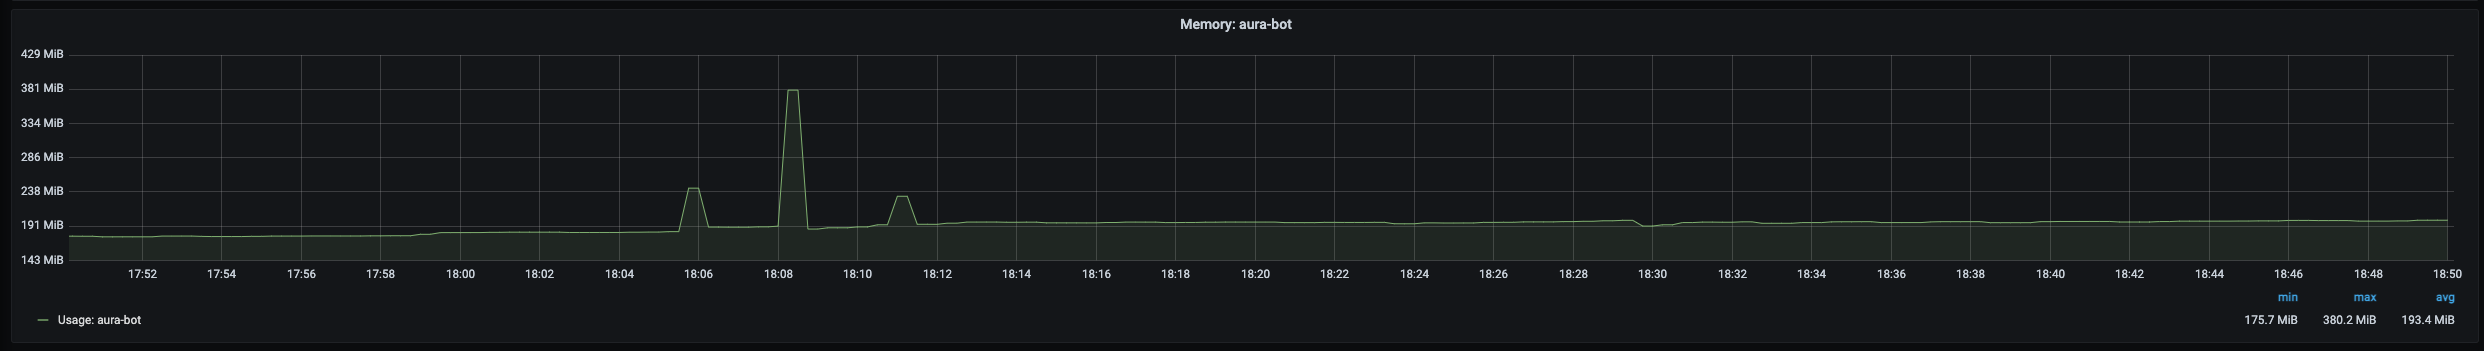
Container memory panel shows a time series with the current memory consumption the selected container. It also shows the current, maximum, minimum and average memory consumption of the container.
The x-axis shows the time series and the y-axis shows the amount of memory consumed by the container.
The queries used to get the panel information are:
sum(kube_pod_container_resource_requests_memory_bytes{namespace="aura-<env>",pod="aura-bot-<id>",container="aura-bot"})
sum(kube_pod_container_resource_limits_memory_bytes{namespace="aura-<env>",pod="aura-bot-<id>",container="aura-bot"})
sum(container_memory_working_set_bytes{namespace="aura-<dev>",container!="POD",container!="",pod!="", pod="aura-bot-<id>",container="aura-bot"}) by (container)
An example of this panel is shown below:
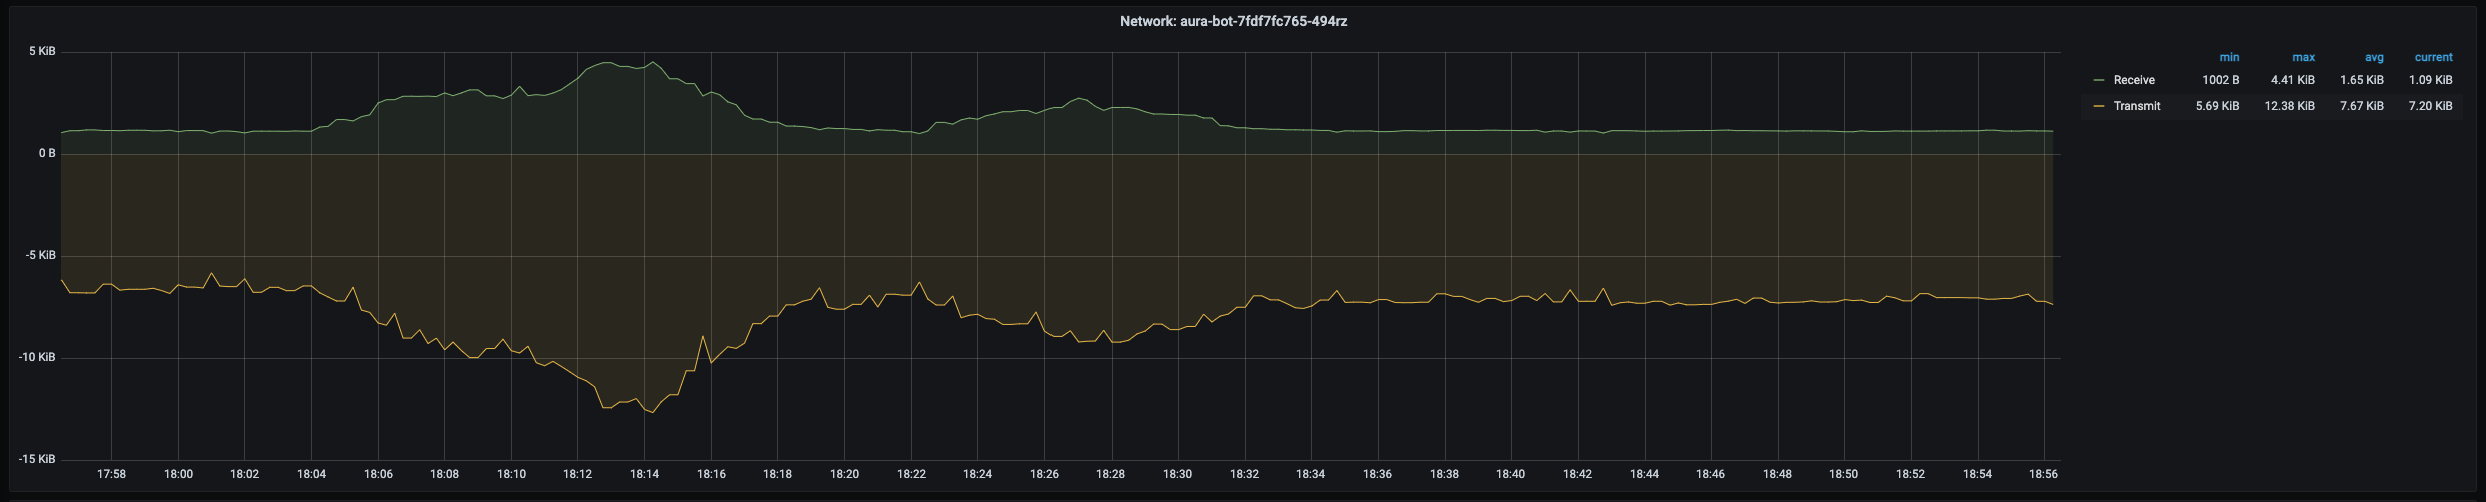
Pod network panel shows a time series with the current I/O network consumption of the selected pod. It also shows the current, maximum, minimum and average network consumption of the pod.
The x-axis shows the time series and the y-axis shows the amount of bytes consumed by the pod.
The queries used to get the panel information are:
sum(rate(container_network_receive_bytes_total{namespace="aura-<env>",pod="aura-bot-<id>"}[5m]))
sum(rate(container_network_transmit_bytes_total{namespace="aura-<env>",pod="aura-bot-<id>"}[5m]))
An example of this panel is shown below:
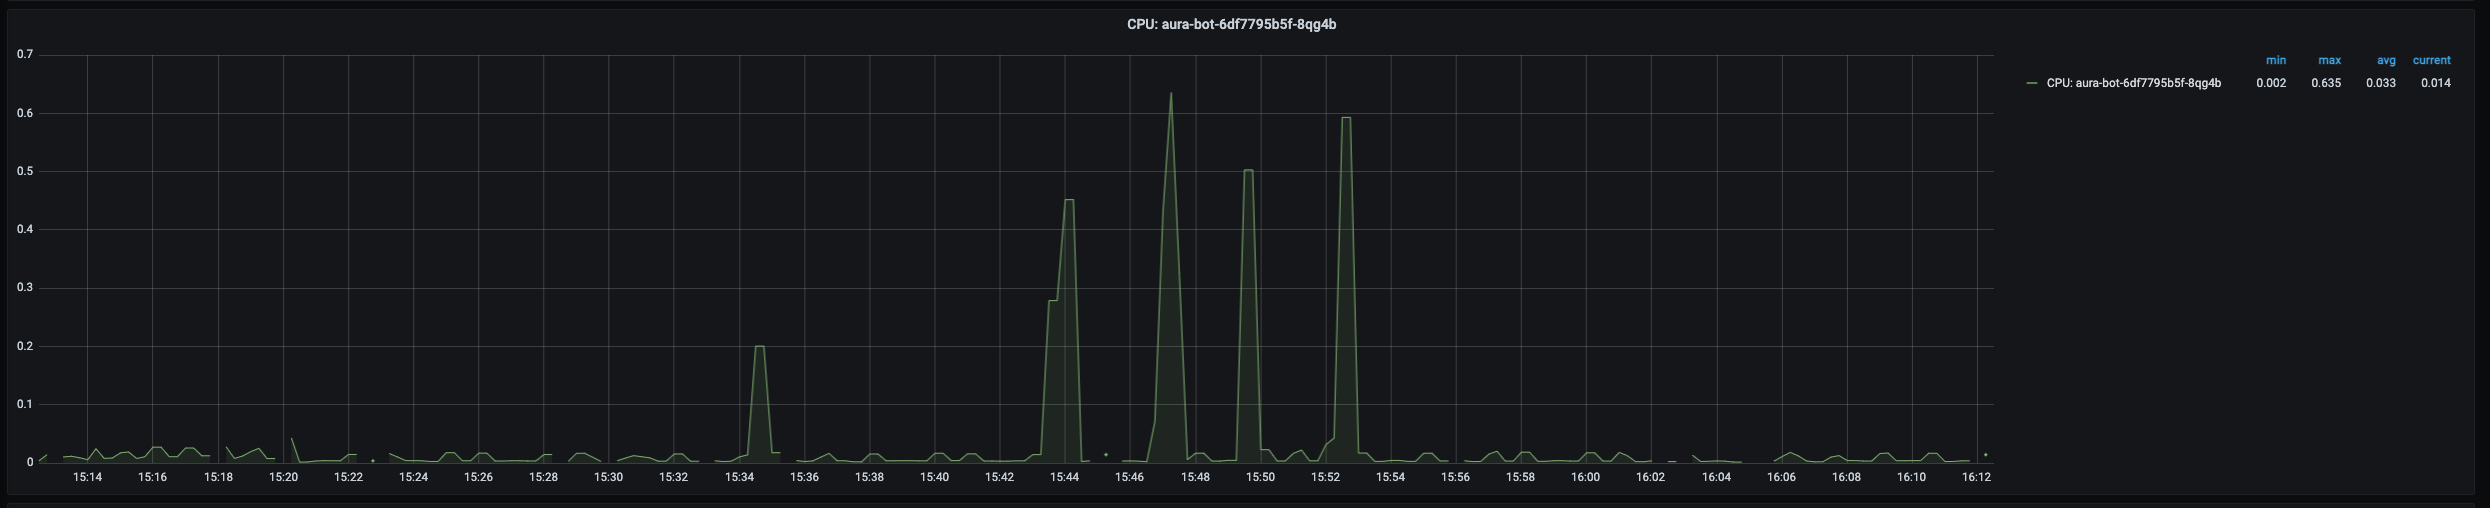
Pod CPU panel shows a time series with the current CPU consumption of the selected pod. It also shows the current, maximum, minimum and average CPU consumption of the pod.
The x-axis shows the time series and the y-axis shows the percentage of CPU used by the pod.
The queries used to get the panel information are:
sum(kube_pod_container_resource_requests_cpu_cores{namespace="aura-<env>",pod="aura-bot-<id>"})
sum(kube_pod_container_resource_limits_cpu_cores{namespace="aura-<env>",pod="aura-bot-<id>"})
sum(rate(container_cpu_usage_seconds_total{namespace="aura-<env>",container!="POD",container!="",pod!="", pod="aura-bot-<id>"}[1m]))
An example of this panel is shown below:
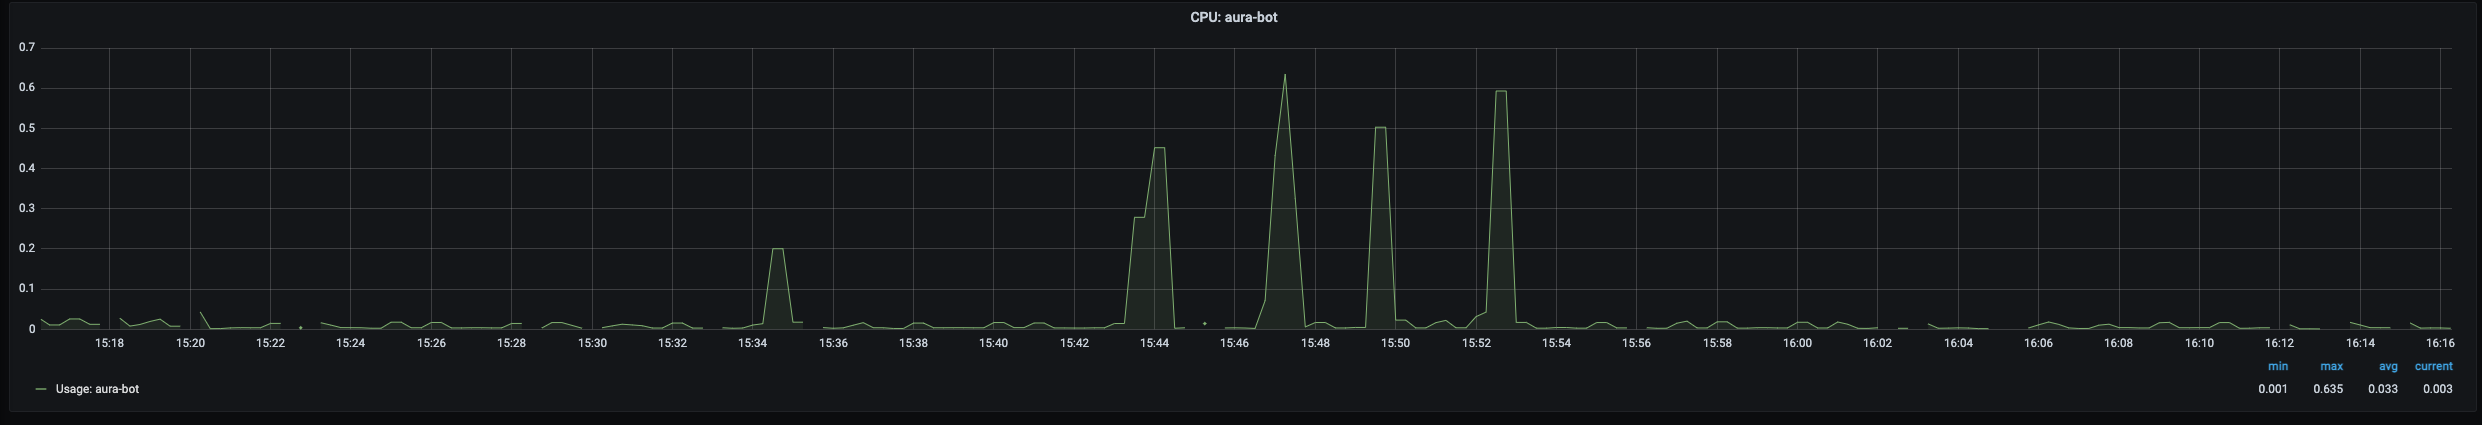
Container CPU panel shows a time series with the current CPU usage of the selected container within the pod. It also shows the current, maximum, minimum and average CPU usage of the container.
The x-axis shows the time series and the y-axis shows the percentage of CPU used by the container.
The queries used to get the panel information are:
sum(kube_pod_container_resource_requests_cpu_cores{namespace="aura-<env>",pod="aura-bot-<id>",container="aura-bot"})
sum(kube_pod_container_resource_limits_cpu_cores{namespace="aura-<env>",pod="aura-bot-<id>",container="aura-bot"})
sum(rate(container_cpu_usage_seconds_total{namespace="aura-<env>",container!="POD",container!="",pod!="", pod="aura-bot-<id>",container="aura-bot"}[1m]))
An example of this panel is shown below:
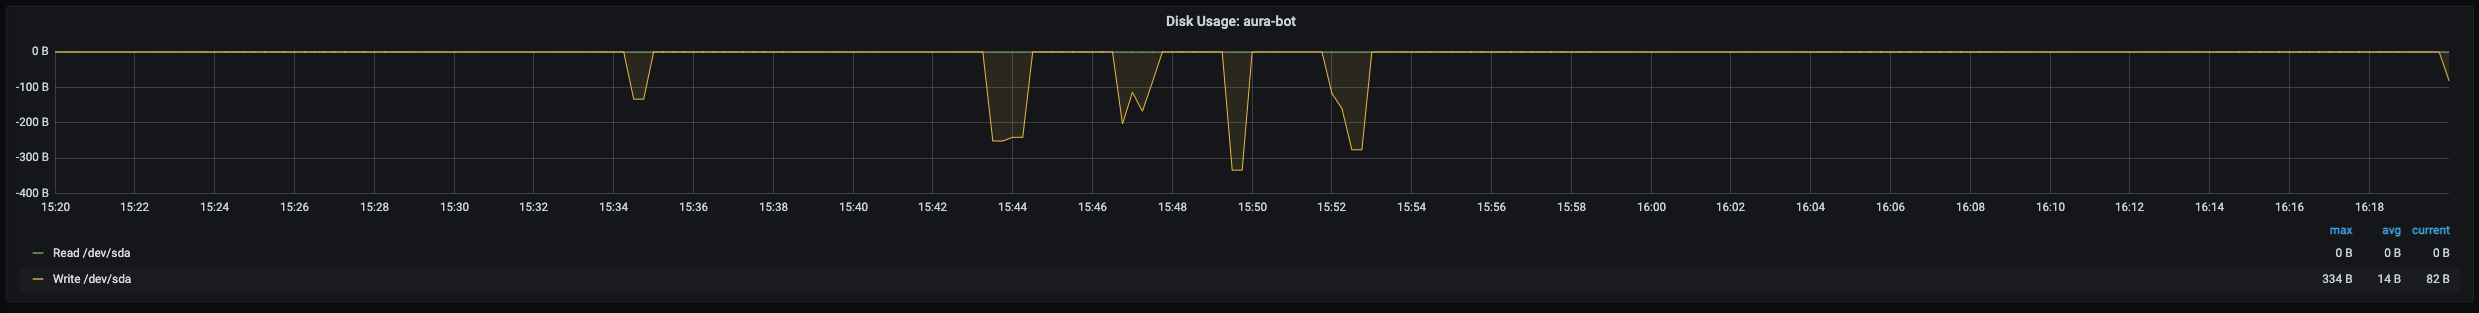
Container Disk panel shows a time series with the current disk usage of the selected container within the pod. It also shows the current, maximum, minimum and average disk usage of the container.
The x-axis shows the time series and the y-axis shows the amount of disk used by the container.
The queries used to get the panel information are:
sum(rate(container_fs_reads_bytes_total{namespace="aura-<env>",pod="aura-bot-<id>",container="aura-bot"}[1m])) by (container,device)
sum(rate(container_fs_writes_bytes_total{namespace="aura-<env>",pod="aura-bot-<id>",container="aura-bot"}[1m])) by (container,device)
An example of this panel is shown below:
Pods network errors panel shows a time series with the percentage of errors in network access of the pod. It also shows the current, maximum, minimum and average number of errors of the pod, related to errors while receiving and transmitting data to the network.
The x-axis shows the time series and the y-axis shows the percentage of errors of the pod network accesses.
The queries used to get the panel information are:
sum(rate(container_network_receive_packets_total{namespace="aura-<env>",pod="aura-bot-<id>"}[5m])) / sum(rate(container_network_receive_errors_total{namespace="aura-<env>",pod="aura-bot-<id>"}[5m])) * 100
sum(rate(container_network_receive_packets_total{namespace="aura-<env>",pod="aura-bot-<id>"}[5m])) / sum(rate(container_network_receive_packets_dropped_total{namespace="aura-<env>",pod="aura-bot-<id>"}[5m])) * 100
sum(rate(container_network_transmit_packets_total{namespace="aura-<env>",pod="aura-bot-<id>"}[5m])) / sum(rate(container_network_transmit_errors_total{namespace="aura-<env>",pod="aura-bot-<id>"}[5m])) * 100
sum(rate(container_network_transmit_packets_total{namespace="aura-<env>",pod="aura-bot-<id>"}[5m])) / sum(rate(container_network_receive_packets_dropped_total{namespace="aura-<env>",pod="aura-bot-<id>"}[5m])) * 100
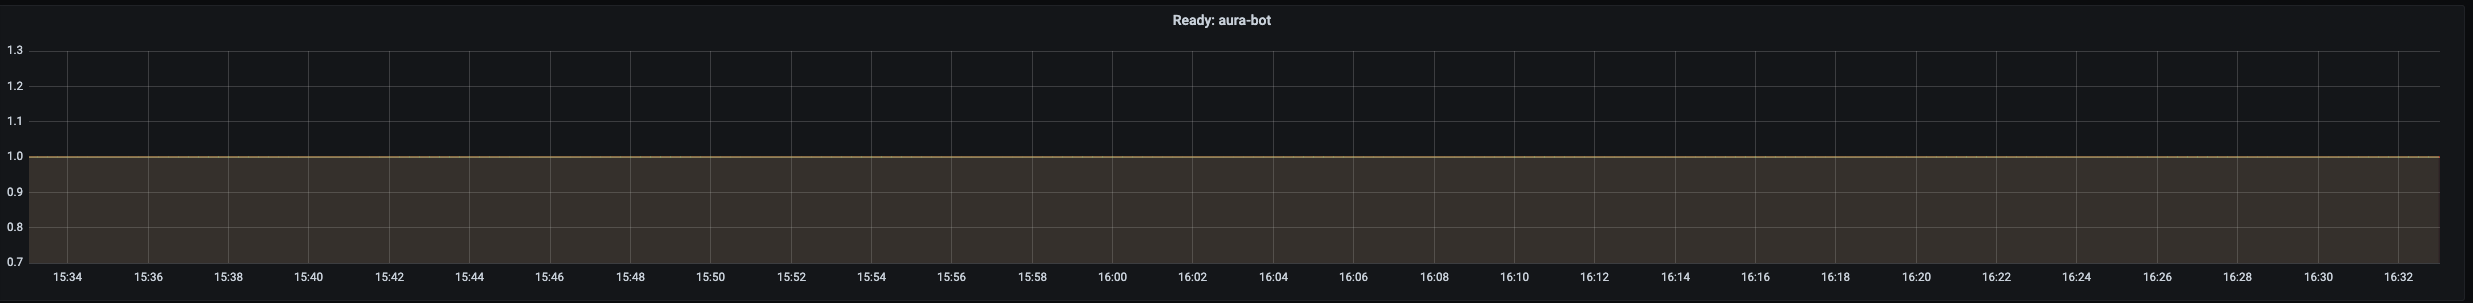
This section consists of 5 panels: ready, created, number of restarts, last terminated reason, waiting reason and the description of the image running in the container.
Ready panel shows a time series with heartbeat of the container. If there are no errors, it should be a flat line in 1.0.
The x-axis shows the time series and the y-axis shows the answer of the heartbeat of the container: 1 is a correct answer.
The queries used to get the panel information are:
kube_pod_container_status_ready{namespace="aura-<env>",pod="aura-bot-<id>",container="aura-bot"}
An example of this panel is shown below:
Pod created panel shows the timestamp when the selected pod was created.
The queries used to get the panel information are:
kube_pod_created{namespace="aura-<env>",pod="aura-bot-<id>"} * 1000
An example of this panel is shown below:
This panel shows the reason why the pod entered the terminated status.
This panel shows the reason why the pod entered the waiting status.
Info panel shows the images running in the containers of the selected pod.
The queries used to get the panel information are:
kube_pod_container_info{namespace="aura-<env>",pod="aura-bot-<id>"}
An example of this panel is shown below:
