This is the multi-page printable view of this section.
Click here to print.
Return to the regular view of this page.
Monitor Aura system
Monitor Aura system
The operation of your Aura system can be monitored in a continuous basis. Discover Aura monitoring tools, the different logs and metrics that are generated and how to implement an alert system.
Introduction
Aura monitoring system is crucial to control how Aura system works internally, in order to keep the service functional and, moreover, to understand the behavior of our clients, leading to evolve Aura accordingly.
Monitoring is based in the generation by different Aura components of logs and metrics, that are stored for their subsequent analysis and decision-making based on the obtained results. Both logs and metrics together create a complementary observability foundation to have an essential knowledge of the system performance in predictable and unpredictable ways.
Within this process, key external monitoring tools are used, such as ElasticSearch, Kibana and Grafana.
Stages in Aura monitoring process
Sections below show, at a glance, the steps and recommended tools both for logs and metrics management and include links to the corresponding documents for more details.
Aura logs management
Logs are files generated by different Aura components that record specific single events, warnings and errors as they occur.
-
Logs generation
Different Aura components generate logs every time a relevant event happens.
-
Logs storage
Aura logs are stored in Elasticsearch.
-
Logs visualization and analysis
Logs can be managed through different tools:
- Kibana: basic operational logging analyzer of Aura.
- Moreover, two additional tools, fluentd and Grafana can be used for specific aspect related to logs management.
📃 Read here detailed information regarding Aura logs management.
Aura metrics management
Metrics offer an aggregated view of Aura performance based on meaningful aggregated logs. They are typically generated at fixed-time intervals and represent a specific aspect of the monitored system.
-
Metrics generation
Different Aura components generate metrics periodically based on aggregated logs.
-
Metrics storage
Once generated, Aura metrics are pooled by Prometheus, which is in charge of gathering and exposing them.
-
Metrics analysis
Aura metrics are analyzed in order to have a meaningful interpretation of data and to obtain an overall evaluation of Aura’s performance.
For the management of metrics, we recommend using Aura dashboards, which are generated in Grafana. These dashboards can be retrieved by making queries to the system.
📃 Read here detailed information regarding Aura metrics management.
Aura alerts
Prometheus has a list of alert rules that are part of the platform configuration and can be editable.
📃 Discover the alerts currently set for Aura system in Aura alerts document.
1 - Aura Analytics 1.1.
Aura Analytics 1.1.
Description of Aura Analytics 1.1, the monitoring dataflow that allows active listening in Aura
Introduction
This document contains a description of a joint dataflow between LCDO OB teams and Aura Global Team for processing Aura log files created in production environment (i.e., coming from actual Aura users) in order to create PPDs (Privacy-Preserving Datasets). All this process is known as Active Listening.
The dataflow produces as a result, among other elements, an analytics component, named as Aura Analytics Dashboard, that can be used to gather statistics on the production system and to analyze user’s behavior. The latest version 1.1 of this dashboard is described in the current document.
The main objectives of the unified dataflow are:
- Consolidate the processing of Aura logs into a framework.
- Provide LCDOs and Aura Global Team with a unified common source for analytics, in a privacy-preserving way.
- Enable extensibility of the dataflow.
In this framework, the current documents provide:
The target audience of this document includes the following roles both in LCDO Teams and Aura Global Team:
- Data Scientists and Product teams, that wish to access Aura logs information and perform analytics on them.
- Operation teams, for the architectural description and the requirements on OB environments.
Aura Analytics versions
Release 1.0.
The first release 1.0. sets up the basic paths, deploys the PPD infrastructure and produce:
- Version 1.0. of the OB Analytics system, which includes the OB Dashboard.
- The first version of pre-processed datasets (clean PPDs) for training and analytics at Aura Global.
As mentioned, this version enables OBs to go further by:
-
Enhancing the OB Dashboard with new visualizations, as they seem fit (given that panels and dashboards can be exported and imported, it is possible to share new ones across all OBs, as they are developed).
-
Processing the PPD files as desired (they are standard CSV files, which can be ingested in alternative platforms if desired). Restrictions on them are softer than on the original logs due to the anonymization process they have been subjected to, although they are still subjected to management precautions (a code of conduct is being prepared for that).
Release 1.1.
Version 1.1. introduces the following changes:
- The table of data has been enlarged with these new fields:
AURA_ID, STATUS_CD, sesId, sesSize, sesDuration.
- An expanded list of test users is used, so that the
userType column contains more identifications.
- The code for data ingestion into a local Kibana, which previously consisted on a single Python script, has been turned into a full Python package to be installed, due to its increasing complexity.
The prerequisites for the use of version 1.1. of Aura Analytics Dashboard are set below:
1.1 - Architecture
Aura Analytics 1.1. architecture
Technical architecture of Aura Analytics 1.1.
Architecture description
The following figure shows a full overview of Aura Analytics Dashboard architecture and operation, which is also described below:
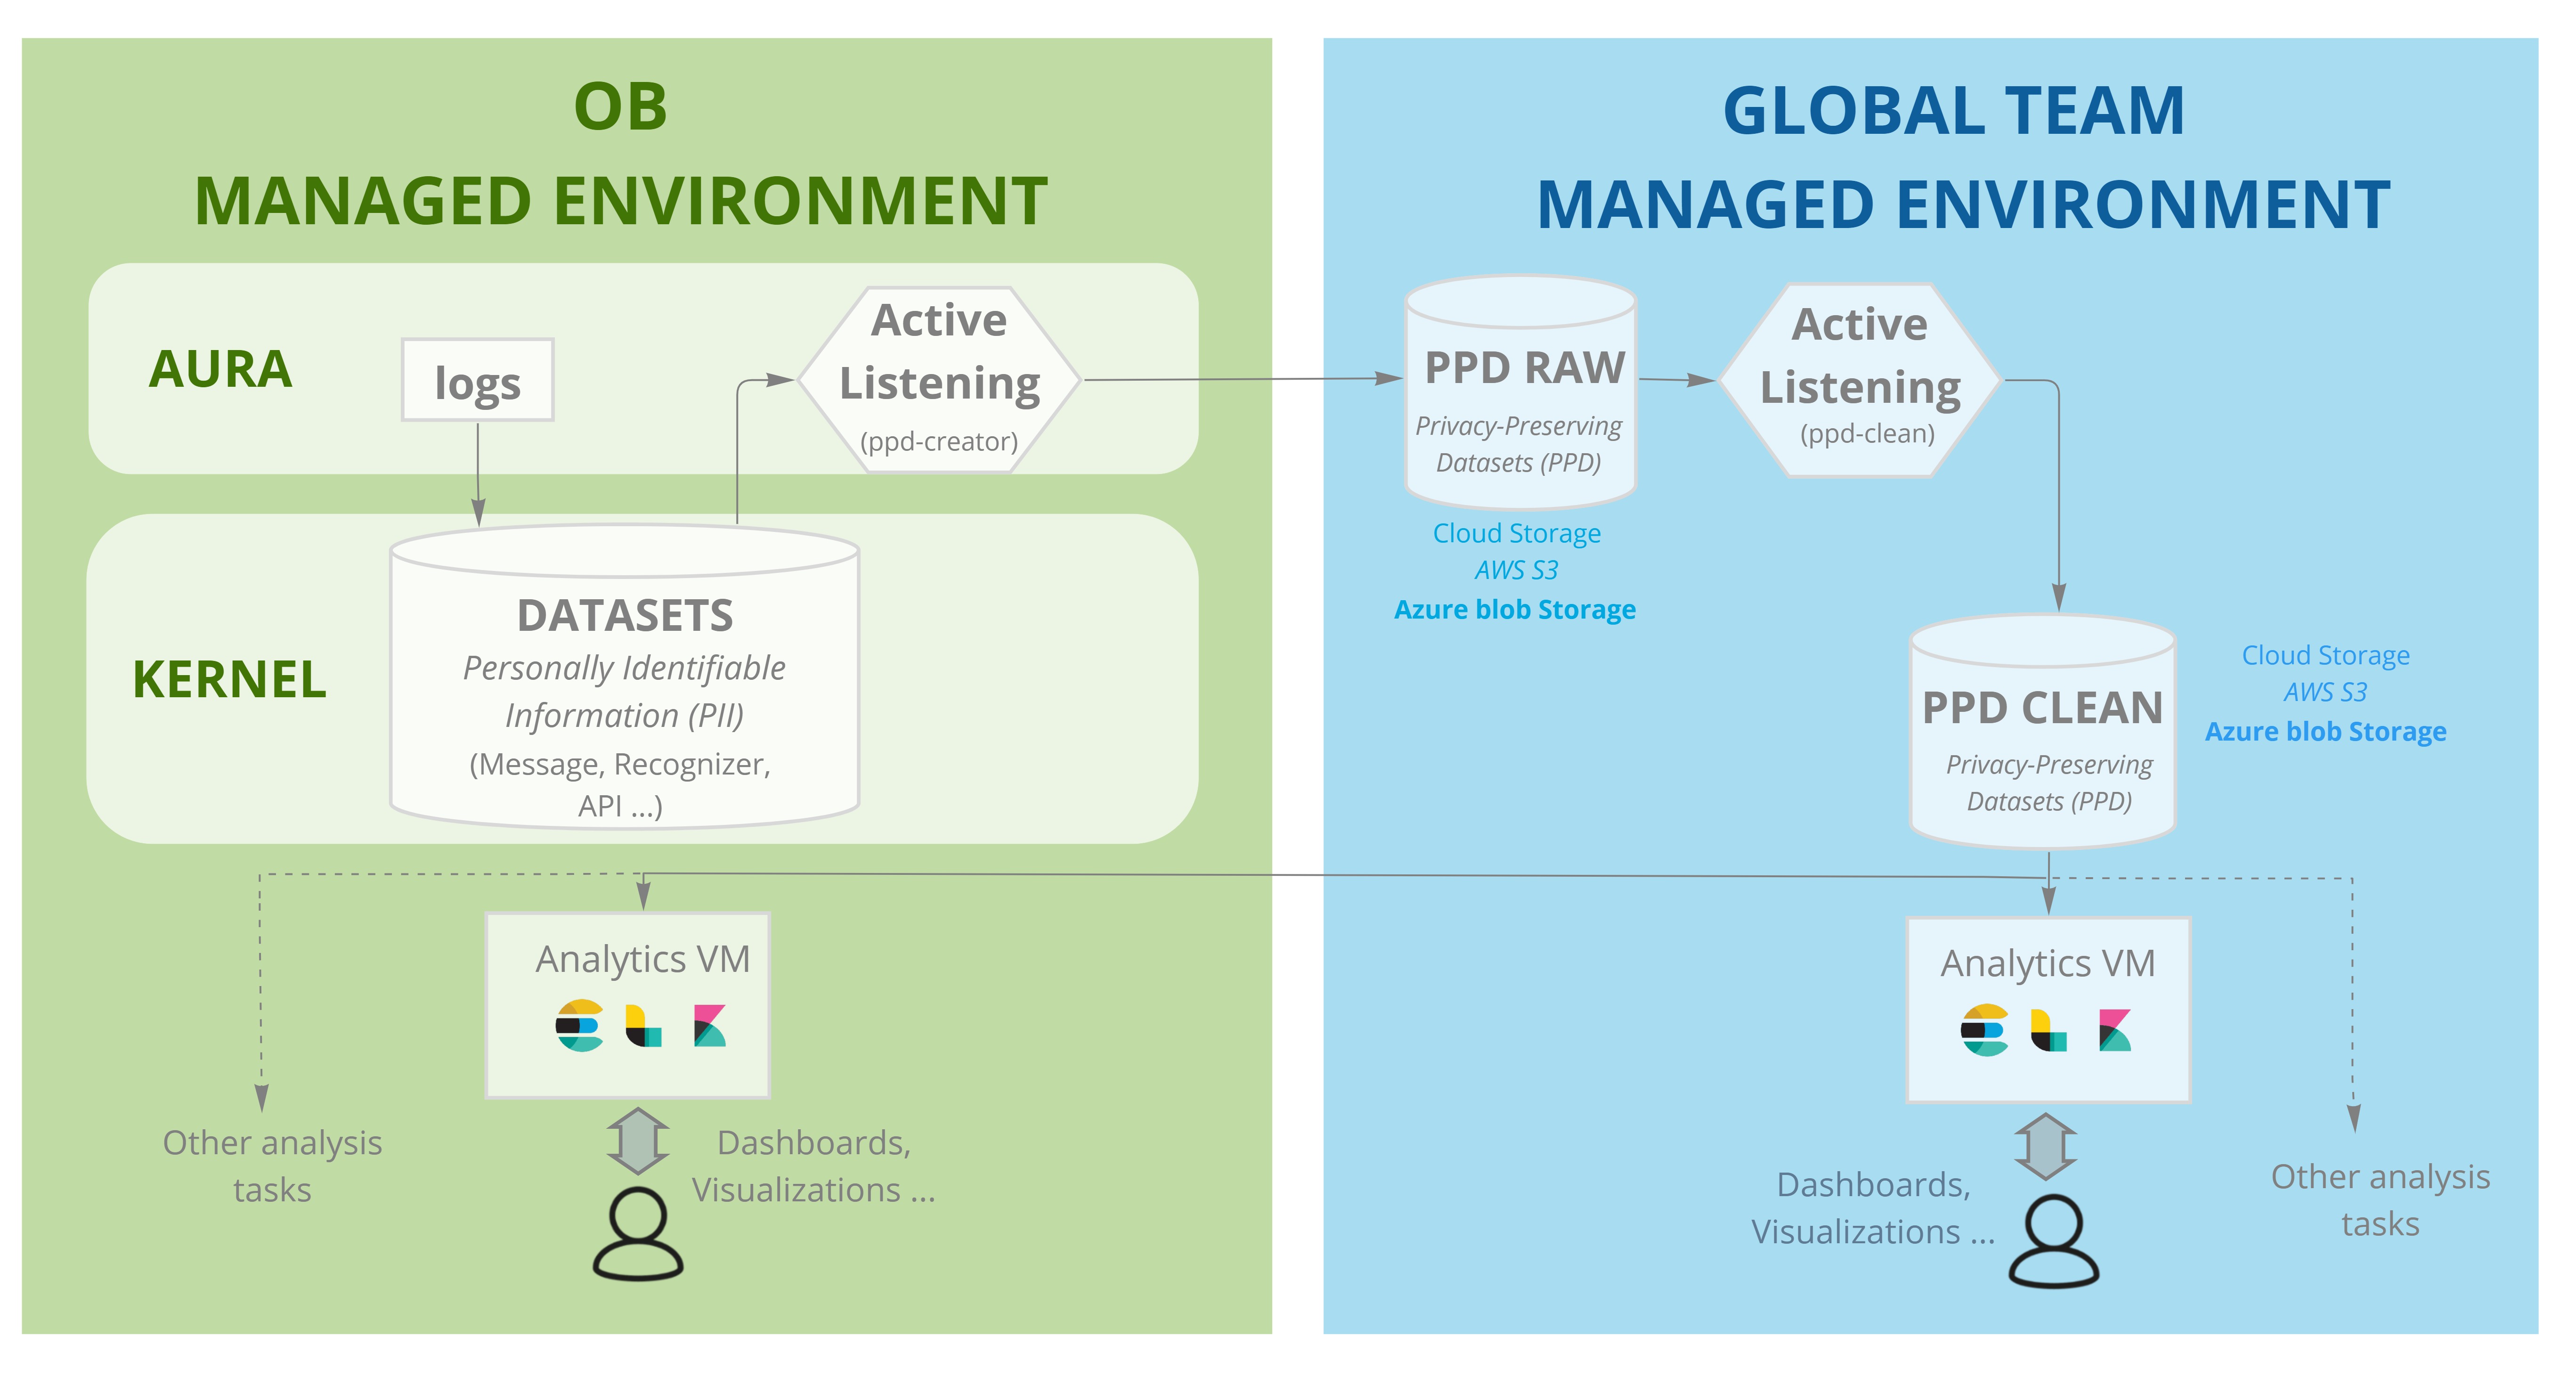
-
Aura logs generated in local instance are converted to datasets and transferred to local Kernel via the standard procedure and with the established frequency (typically, daily).
-
Once there, the “Active listening” process flow fires up daily. Through a specialized process that runs on an Aura local instance and with access to the stored datasets in the Kernel local storage space:
- PII (Personally Identifiable Information) is removed or encrypted.
- The result is transferred to a bucket/blob set up for this task and managed by Global Aura team.
- Here, the PPDs (Privacy-Preserving Datasets) are created. Currently, only
MESSAGE, RECOGNIZER and API datasets are involved in this process.
In order to convert PII data to PPD, every field in these datasets can be:
- a. Not transferred.
- b. Pseudo-anonymized. In this situation, the field is transformed through a cryptographic hashing process using a secret set up by the OB.
- c. Anonymized fragments of the field (e.g., credit card number, email, etc.). The field is processed to detect specific patterns and replaces them with a specific tag (
idemail, idpassport, etc.). The list of anonymization strings is agreed with each OB.
- d. Transferred as is.
-
After that, the Raw PPD Datasets stored in bucket/blog managed by the Global Team are processed generating clean PPD Datasets in order to adapt them to the analytics tools.
-
From that space, the clean PPD Datasets can be:
-
Accessed by the Aura Global Team that use them for several tasks, with the purpose of evaluating Aura quality and taking the best decisions regarding to product evolution:
- Perform analytics on Aura behavior and prototype Analytics Dashboard features
- Improve Aura Platform capabilities (e.g., adapting machine learning models)
-
Accessed by a Local Aura Team, ingesting the data to a dedicated server managed by the OB with analytics and data visualization capabilities. In order to do that, the Aura Global Team provides a component with the ELK (elasticsearch, logstash & kibana) preconfigured with a set of dashboards that can be deployed and adapted by the OB team.
All the code involved in this process can be found in Github. Particularly:
1.2 - OB analytics
OB analytics
Description of the OB OB Analytics subsystem that can be managed by OBs.
Introduction
The OB Analytics subsystem is an optional component in the dataflow, which enables the management of clean PPDs (Privacy-Preserving Datasets) by LCDOs for the analysis of Aura behavior.
In order to work with OB Analytics subsystem, the following items must be fulfilled:
-
The legal agreement for log management and creation of PPDs must be signed between the OB and Aura Global Team.
-
The mechanism for PPD creation and transfer must be installed. This requires the deployment of a piece of software (provided by Aura Global Team) inside the OB cloud, with access to the repository (AWS bucket or Azure Blob Storage) holding Aura logs.
-
A virtual machine must be deployed on the OB cloud to hold the OB Dashboard. This virtual server must be provisioned by the OB on the same cloud environment (provider and region, e.g., AWS West Europe) than the Kernel cloud, but separated from it in terms of access rights (placing it in the same cloud enables saving transfer costs from the cloud provider for PPD access).
Architecture and installation
The basic infrastructure of the OB Analytics subsystem consists on a Virtual Machine that is fed with the extracted and cleaned PPDs. This virtual machine is set up with a proposed stack of tools based on the open-source ELK framework (See figure in Architecture document).
-
Elastic Search: indexing database.
-
Logstash: ingester for PPD data, configured to upload the anonymized clean PPD tables into Elastic Search.
-
Kibana: visualization tool offering dashboards and panels created over Elastic Search data.
The OB is required to set up the base VM, for which an Ubuntu 18.04 system is advised.
On top of this base system, Aura Global Team provides an installation kit that includes:
- The pre-processing and ingesting configuration for feeding clean PPD data into logstash.
- The indexing configuration for Elastic Search.
- Certain prototype dashboards and panels for Kibana.
- Basic security provisions (providing web-based secure access to the dashboard).
Once installed, the system automatically ingests any new clean PPD being produced, so that the index and dashboards remain up to date.
In principle, the PPD creation process specifies daily production, since Aura logs are sent to Kernel once a day. This means that information about Aura behavior and user actions on one given day will be available in the dashboards on the following day.
The provided system and installed dashboards are only visualization examples for clean PPDs. The system allows the creation of additional panels that may provide complementary insights on clean PPD elements and OBs are encouraged to explore data as they see fit.
Dashboards can be exported and reimported in a different system, so in addition to the LCDO team adding new analysis features, it is possible to provide later updates to the OB Analytics system. These updates can be provided by the Aura Global Team or shared between OBs.
Outside the dashboard stack, it is also possible to process clean PPD with alternative tools (PPDs are essentially CSV files with a defined structure, so they can be processed with a variety of tools).
Kibana dataflow
The Aura Analytics dashboard follows a standard ELK deployment:
-
An Elastic Search index has been created. It is called aura-message-COUNTRY, and its index schema contains a cleaned version of the AURA MESSAGE table (which registers input and output messages). For details on the fields that this index contains, go to the document Data model.
-
A Logstash configuration ingests into this index the cleaned sets of datapoints that are produced daily as a result of the transfer and processing of Aura logs. This is usually done in the early morning (which will then upload data for the previous day).
-
A Kibana index pattern has been created, matching the uploaded Elastic Search index.
An Elastic Search index is how the data is stored inside the DB; a Kibana index pattern is how it is visualized in the interface. Typically, Kibana index patterns match Elastic Search indices, but it is, for example, possible to create a Kibana index pattern that matches more than one Elastic Search index and hence combines different data sources.
-
A small set of visualizations have been pre-installed in Kibana over that index pattern, as a means to get a default peek on the index data. See the section preinstalled visual elements to check them.
This configuration is deployed on the Kibana default space (the only one available on a freshly created Aura Analytics dashboard). If there is the need to create additional spaces, to better organize visualizations, then the Elastic Search index pattern needs to be installed into those additional spaces.
Preinstalled visual elements
Kibana offers many possibilities to visualize the ingested data and there are many resources and tutorials around explaining its mechanics. We therefore refer to the official Kibana documentation, or tutorials available on the web, for generic information.
In the particular case of the Aura Analytics deployment, there is an Elastic Search index that gets automatically ingested daily. It is called Aura-message-COUNTRY and contains a cleaned version of the AURA MESSAGE table (which registers input and output messages).
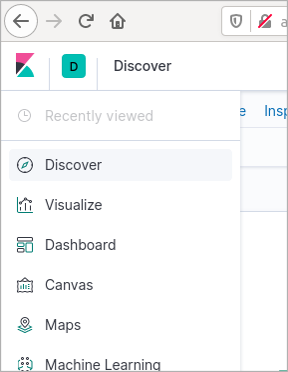
Over this index, three types of panels/visualizations have been preinstalled, to provide a starting point:
- Discover panel
- Visualizations
- Dashboards
These preinstalled elements are described in the following subsections. To access them, select the appropriate icon in the left navigation panel.
Discover panel
The Discover panel in Kibana is an essential tool where one can perform queries to an Elastic Search index (and save those searches if desired), and explore users’ interactions with Aura in detail log by log, these being filtered by:
- Search terms or conditions
- A time interval
- Additional filters applied to the query results
- A set of index fields to show in the result table
These 4 steps are represented in the following figure:
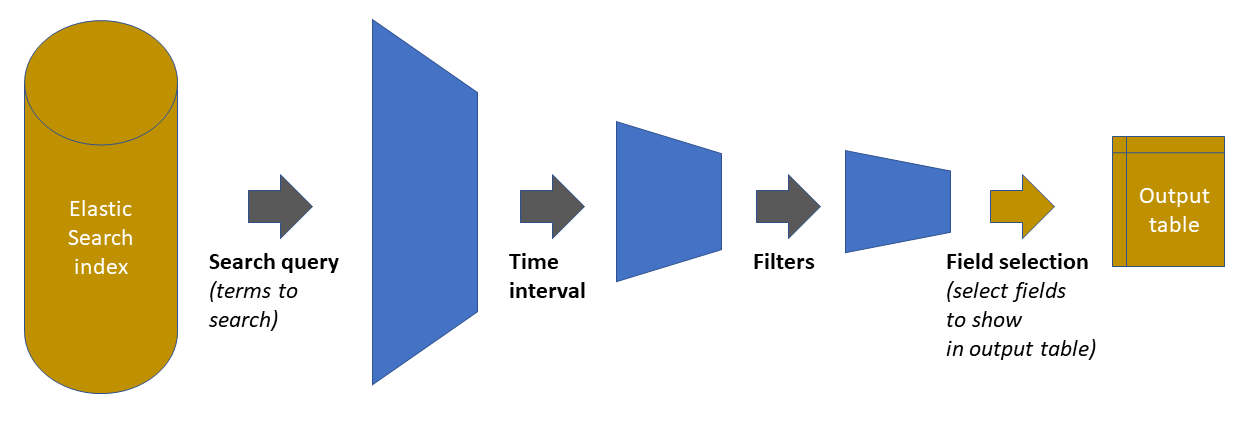
As shown in the previous figure, the starting point is the Elastic Search index holding all the data. The three first steps in the chain reduces the amount of data handled, by pruning out elements that do not satisfy the defined condition. The fourth step is just a display adjustment: on the final dataset, define which of the available fields will be shown on the output table that appears in the panel. However, the retrieved data contains all fields (clicking on any of the rows will show them).
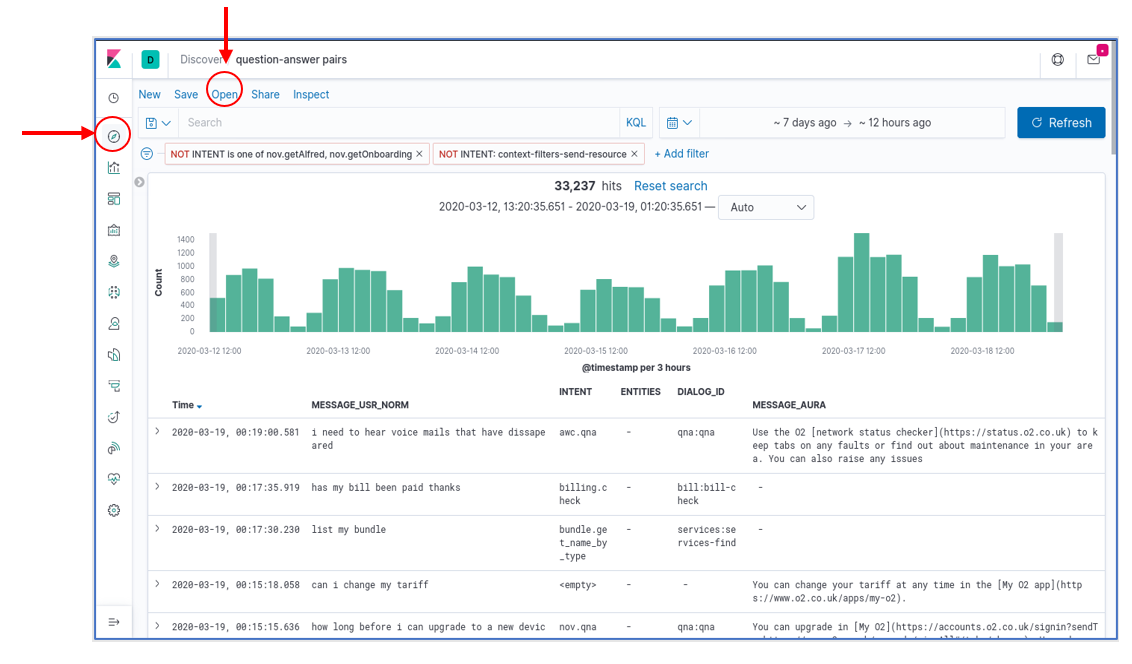
In the Aura Dashboard default set, there is one Discover panel preinstalled. It is called question-answer pairs and has the following characteristics:
- A blank query (i.e., provide all the results)
- A time interval for the last 7 days
- A “only user” filter: it filters out all intents that correspond to non-user queries (suggestions, help commands from the client application, etc.)
- A visualization that includes: the timestamp, the (cleaned) user message, the detected aura intent, associated entities (if applicable), the dialog that was invoked and Aura’s response
This figure shows a snapshot of this panel. To load it, select the Discover tool in the left navigation bar and then click on the “Open” menu option in the top menu bar. A list of saved panels will be shown, together with the already mentioned “question-answer pairs”.
Once the panel is loaded, each one of the aforementioned four elements can be freely modified. For example, the interface allows:
- Adding new filters with the “+Add Filters” button
- Deactivating the current filters by pressing over the predefined filter and clicking over the “Temporarily Disable” option
- Modifying the query interval with the “calendar” button or “Dates Box”
- Adding a specific query on a given index field(s) by using the “Search Box”, instead of the (default) blank query.
Discover panels can be saved as named objects, to be later loaded at will. So, if needed, any panel (a modified panel or a newly created one) can be saved with a new name to have it available for later loading.
Visualizations
A total of 7 visualizations come preinstalled with the base Aura Dashboard. The list can be obtained from the “visualizations” item in the left menu bar, as shown in the figure, and they are:
- Three “Stats” type visualizations, which provide general statistics on platform usage.
- Four “User” type visualizations, which provide insights on user behavior.
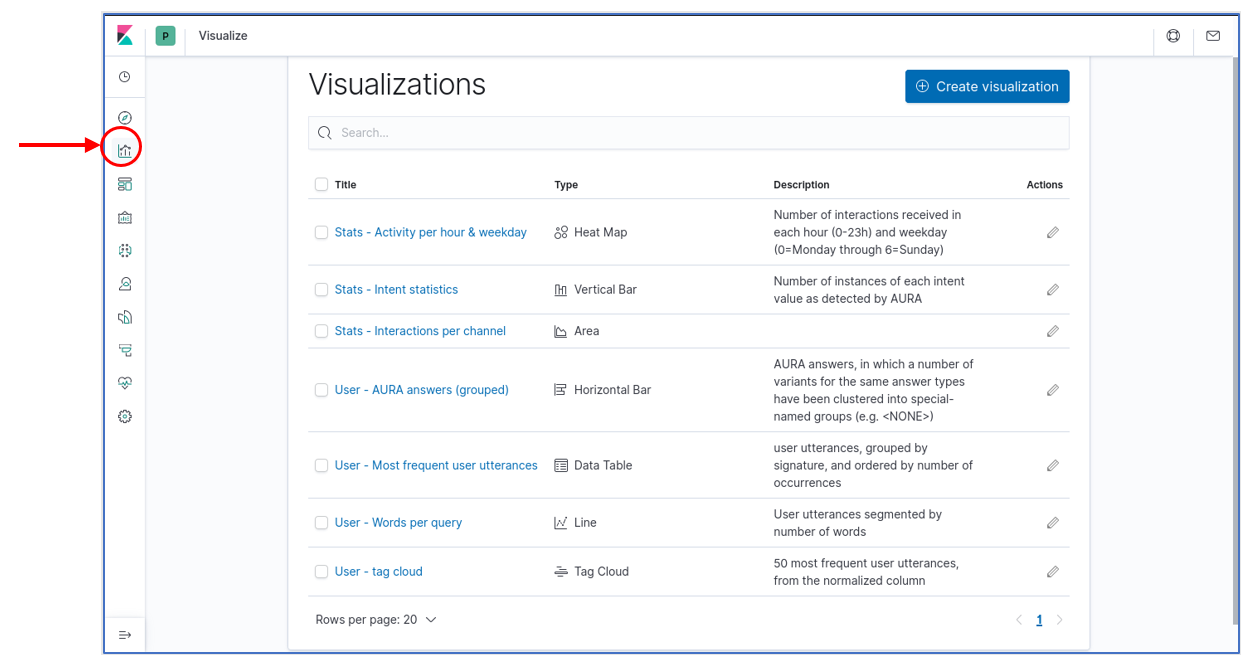
Note that this distinction between “User” and “Stats” is purely conceptual and based on the fields that have been used to generate the visualizations that, from the point of view of Kibana, are all regular visualizations. Those visualizations can be instantly loaded by clicking on their names. But they can also be integrated into dashboards, as described in the next section.
Dashboards
A dashboard in Kibana is essentially a spatial arrangement of visualizations. For example, to construct a dashboard, just place visualizations into a page, resizing them as required, so they can be observed in a single place.
It is interesting to know that in a dashboard all visualizations are linked. So that if, for example, time interval is changed, or a filter is added using the interface, these modifications affect all visualizations in the dashboard and all of them get updated.
Elements in the dashboard visualizations can also generate instant filters by clicking on graphs or table elements. Those filters are then added to the top of the page as a filter and, therefore, can then be modified or removed.
The Aura Analytics default installation preloads two dashboards. Those are available for selection when we click on the “dashboard” icon in the left navigation bar:
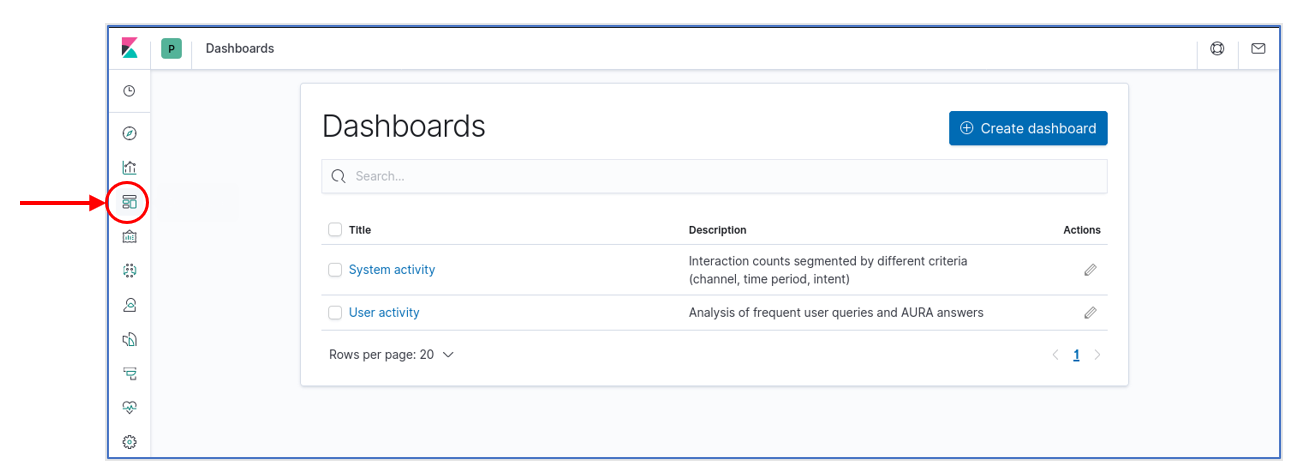
There are different types of dashboards, described in the following sections.
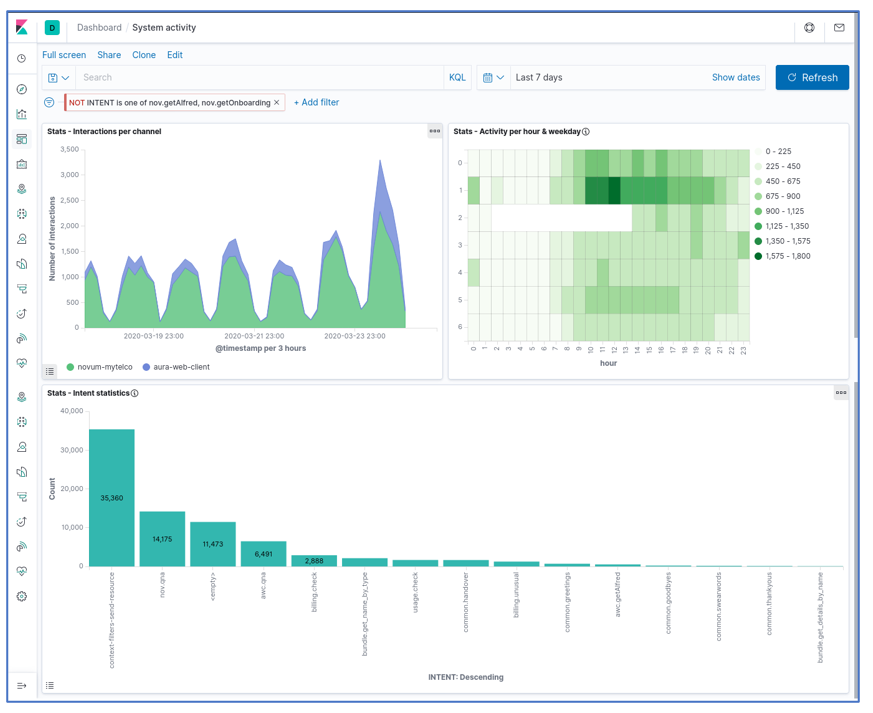
System dashboard
This dashboard integrates the three predefined “Stats” visualizations (generic statistics):
- A timeline of interactions (user messages sent and answered), segmented by channel
- A heatmap of interactions by weekday and time of day (hour)
- A bar graph classifying the interactions produced in the period by detected intent
The following figure shows a screenshot of this dashboard:
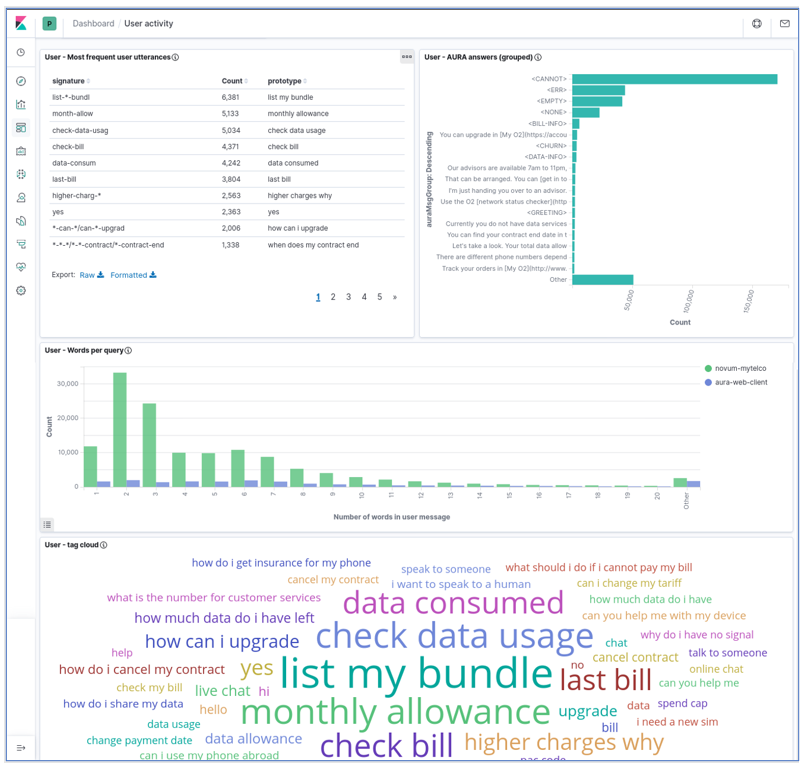
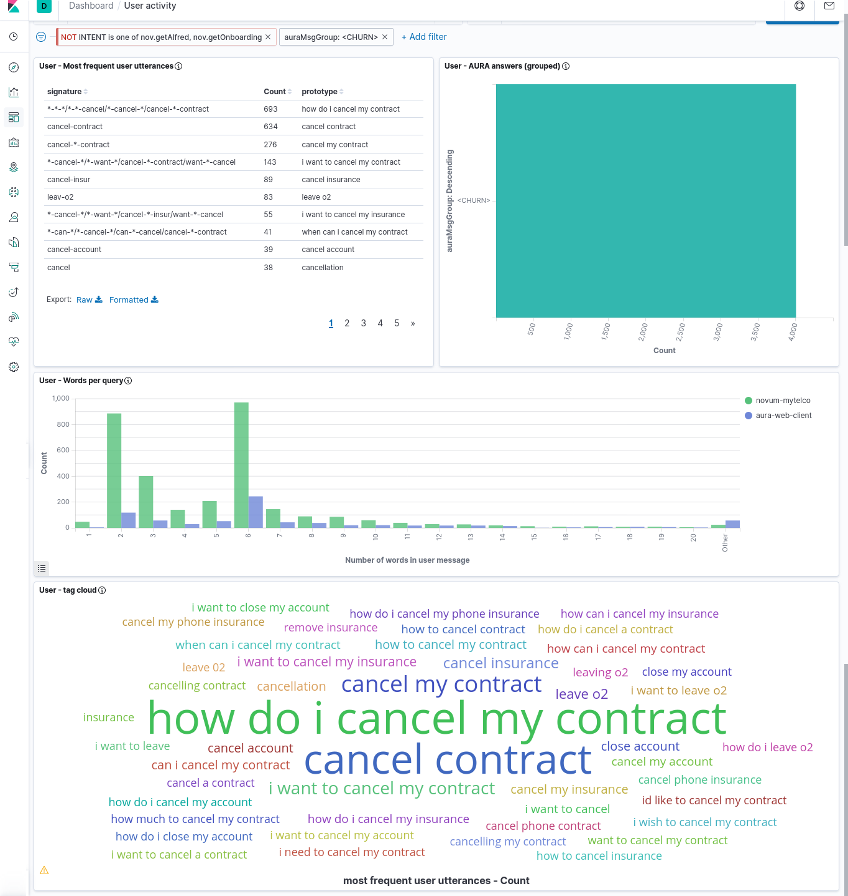
User dashboard
The user dashboard contains the four visualizations:
- Most Frequent User Utterances: list of the most frequent user’s sentences (in the time interval and filter active at the moment). It uses the
usrMsgSig field to group together very similar utterances.
- Aura Answer Groups: list of the most frequent answers that Aura generates, grouped by the semantic categories in
AuraMsgGroup field.
- Words per query: distribution of sizes for the user messages, measured as number of words in the utterance and segmented by channel.
- Tag cloud: set of most frequent user utterances, as a tag cloud in which the font size represents the utterance frequency. The
MESSAGE_USR_NORM field is used for its representation, so it contains normalized utterances.
The next screenshots show the dashboard with all these visualizations (it is a large dashboard, so typically it needs scrolling to visualize all its components).
Note that those four visualizations are linked as they correspond to the same subset of the data (as given by filters and time interval) but they are NOT linked at the individual item level (i.e., a given most frequent user utterance in the left table does not correspond to any specific Aura answer in the right bar graph).
Instead, the dashboard can be manipulated by selecting one specific item in any of the visualization and this will create a filter for the others. For instance, as the following image shows, if we select <CHURN> in the Aura answer group visualization, we can see in the others the user utterances that led Aura to generate that answer (i.e., an answer about contract cancelation).
1.3 - Data model
Aura Analytics data model
Data model of Aura Analytics 1.1. that can be used as the base for building new elements
Introduction
New elements can be built (or the current elements modified) by making use of the available fields in Kibana through the ingested Elastic Search index.
In this document, we provide a reference of the schema that the index follows, so that it can be used to build such new visualizations, or to better understand the existing ones.
Elements in the Aura-message data model have 3 different types:
-
Numeric: single numbers, integer or real. Suitable for numerical statistics, such as averages, or for plotting variation across time in graphs.
-
Keyword: they are opaque strings, i.e., terms that cannot be searched within (it is not possible to look for words inside a keyword field). They can, however, be used to create some term-level queries, such as prefix queries (find all instances that begin with) and they usually work great for aggregations, since most of them are categorical variables (fields that only have a limited number of possible values) and can therefore be bucketed and counted.
-
Text: these fields are divided into separate terms (words), and some pre-processing is done to them before indexing to improve access though an Elastic Search analyzer. Text fields cannot be used in aggregated visualizations, since they cannot be grouped. They are most useful for queries, because they allow searching for fragments (only a few words) and fuzzy searches.
Fields list
The following table lists all the fields available in the Aura-message-COUNTRY Elastic Search index, together with their type and a brief description.
The most relevant ones include a more detailed description in the section fields explanations.
Note that some fields of text type have a mirror field of type keyword, with the same content. Having the same data indexed in two different ways at the same time (as text and as keyword) enables to perform different types of analysis by choosing the right field.
The “Raw” column indicates if this field is already present in the Aura raw PPD files:
-
Yes: field contained in raw PPDs.
-
No: generated field, produced when creating clean PPDs. They can be recognized as lowercase fields.
-
Partial: It exists in the raw PPDs, but in a somehow different shape.
| Field |
Type |
Raw |
Contents |
| CORR_ID |
keyword |
yes |
Unique identifier for each interaction |
| VERSION_ID |
keyword |
yes |
Aura Platform version |
| CHANNEL_CD |
keyword |
yes |
Identifier for the channel this interaction corresponds to |
| STATUS_CD |
keyword |
yes |
Internal code related to operation status |
| AURA_ID_GLOBAL |
keyword |
yes |
(Mostly) unique identifier for the user |
| AURA_ID |
keyword |
yes |
(Mostly) local identifier for the user |
| INTENT |
keyword |
yes |
Detected user intent, including “system” intents |
| MESSAGE_USR |
text |
partial |
Text request sent by the user |
| MESSAGE_USR_NORM |
text |
no |
A normalized version of MESSAGE_USR |
| MESSAGE_USR_NORM.keyword |
keyword |
no |
A keyword version of MESSAGE_USR_NORM, to enable aggregating on it |
| MESSAGE_AURA |
text |
partial |
Text message sent by AURA to the user |
| MESSAGE_AURA.keyword |
|
partial |
Keyword version of MESSAGE_AURA, to enable aggregating on it |
| MODALITY_CD_USR |
text |
partial |
Modality of the user message |
| MODALITY_CD_AURA |
text |
partial |
Modality of Aura response |
| ENTITIES |
text |
yes |
Comma-separated list of the entities recognized in the user message |
| DIALOG_ID |
text |
yes |
Identifier for the dialog that produced Aura response |
| DIALOG_ID.keyword |
keyword |
yes |
Keyword version of DIALOG_ID, to enable aggregating on it |
| DURATION_NU |
number |
yes |
Elapsed time, in ms, between the reception of the user message and the moment the response is generated to be sent to the channel |
| userType |
keyword |
no |
A single char identifier that characterizes the user as a test user |
| usrMsgWc |
number |
no |
Message word count: number of words contained in the user message |
| usrMsgSig |
keyword |
no |
Message signature: a string that helps clustering user messages |
| AuraMsgGroup |
keyword |
no |
Cluster the Aura response belongs to |
| weekday |
number |
no |
Day of the week the interaction happened (0=Monday to 6=Sunday) |
| hour |
number |
no |
(Integer) hour the interaction happened |
| country |
keyword |
partial |
Two-letter code for the country |
| sesId |
keyword |
no |
Session information |
| sesSize |
number |
no |
Session information |
| sesDuration |
number |
no |
Session information |
Fields explanations
This subsection contains more detailed descriptions of some of the key fields in the schema.
AURA_ID_GLOBAL
This element (mostly) uniquely identifies the user generating the interaction.
Note the concrete value of this field is not the same as the actual identifier used within Aura and uploaded to Kernel: for privacy reasons, the identifier was hashed when generating the PPD and has no resemblance to the original one. The correspondence is however maintained across time, so it is possible to analyse user behavior.
The “mostly” qualifier reflects one quirk of the original Aura identifier: it is generated with a dependence to the authentication method used by the channel, so if two channels follow different authentication methods (e.g., MobileConnect vs. User/Password) then the AURA_ID_GLOBAL identifier for the same user will be different. In summary:
-
The identifier stays the same for a given user across time.
-
Different users will not have the same identifier.
-
But the same user could produce two different identifiers if connected to two channels that use a different authentication method.
AURA_ID
This is a “local” identifier, i.e., one that is generated inside the channel according to specific channel characteristics and it is not tied as much as AURA_ID_GLOBAL to user authentication.
Its main disadvantage is its transient nature: the same user, on the same channel, could generate different AURA_ID strings when connecting different times on a different session. Therefore, for user accounting and tracing, AURA_ID_GLOBAL is usually preferred.
However, there are instances in which AURA_ID works better, namely for anonymous access (when the user is not authenticated). This depends on the channel:
- In the WhatsApp channel, the initial use of the channel will be anonymous from the Aura side (i.e., no authentication is done), hence
AURA_ID_GLOBAL will also be empty (at least until the user authenticates, which depends on the use case). But in this channel, AURA_ID has a permanent value, linked to the WhatsApp user, so here it is a good substitute for a persistent id, even for unauthenticated users.
MESSAGE_USR
This field includes the message sent by the user.
It has been partially processed to enhance anonymization by removing some standard identifiers contained in it with <idxxx> strings (e.g., phone numbers appear as <idphone>).
Removal is done mostly through regular expressions, so there might be occasional glitches (such as identifying as phone a number that does not really correspond to a phone, just because it follows the phone number pattern).
MESSAGE_USR is a field of text type. As such, it is searchable: it is possible to search for specific words the user might have said.
Furthermore, it has been processed through an ElasticSearch analyzer adapted to the specific language used. This means that searches are able to match related words (e.g., plural versions of a singular query word, or verb conjugations). Phrase searches are also possible (by using double quotes around the phrase). If a phrase (several words) is used as a query without the quotes, ElasticSearch interprets it as a query for any of the words, so it will return all data elements that contain any of the words in the query.
In Kibana, more sophisticated text searches can be made by switching Lucene query syntax: proximity queries (words close to each other), fuzzy searches (query words allowing typos), wildcards, etc.
MESSAGE_USR_NORM
This is a normalized version of MESSAGE_USR, in which the user text has been streamlined by:
- Converting all the sentence to lowercase
- Removing all punctuation
- Removing any extra spaces
Furthermore, this field is not processed through a language-dependent analyzer as MESSAGE_USR is, so queries on this field must match words exactly. It is still a text type field. However, the same query language can be used.
MESSAGE_AURA
This contains the text message generated by Aura and sent to the user as response to the user query. It is a text type field, so it is possible to search for specific words in it.
In the current version of Aura KPIs logs, this field only contains the text response. Some Aura use cases do not generate a purely textual message, but a more elaborated one (e.g., a card with text and graphics). These complex answers are inserted as attachments into Aura’s response to the channel and since attachments are not logged into the MESSAGE field, this field will appear empty in those cases. So, an empty MESSAGE_AURA field does not necessarily mean that Aura did not provide an answer. As an alternative for those situations, looking at the DIALOG_ID field (or INTENT) may give a hint of the type of answer that Aura delivered.
MODALITY_CD_USR
This field contains the modality in which the user sent the message.
It is a slightly transformed field because there are some variations across Aura versions and, in order to unify it, the modalities are consolidated into only four different keywords: audio (spoken message), text (written free-text message) o form (commands sent via automatic processing or menus).
DIALOG_ID
This field contains the identifier for the user case dialog module at the aura-bot Framework that was selected to construct the Aura response.
Dialog identifiers have two components (library and dialog) separated by a colon e.g., services:service-usage
This field uses a custom analyser that splits the identifier at the colon, generating two terms. This makes possible to construct queries with one of the terms, e.g., “give me all the elements for the domain services”. But being a text field makes it impossible to do aggregations on it, so it cannot be used for statistics like bar charts (use DIALOG_ID.keyword for that).
DURATION_NU
This number reflects the time that took Aura to understand, process and respond to the user message. It is the difference (in milliseconds) between the timestamp of the moment the user message was received and the timestamp in which Aura’s response was finalized and sent to the channel.
Note that it is not a complete end-to-end delay time from the user’s point of view, since it does not include either the time it took the request to arrive to Aura through the channel or the time it took the response to travel back through the channel and get rendered at the client application (those times are outside Aura, and as such not registered by it).
Session information includes the fields: sesId, sesSize, sesDuration.
These fields are generated by running a process over the time series formed by interactions from each user at each channel.
A session is automatically identified as a consecutive list of such user’s interactions, each separated from the next by a time interval shorter than 5 minutes. Once each session is identified, it is tabulated and labelled with three fields:
-
sesId: string, forming a unique identifier for the session. It should be considered as an opaque identifier and the guarantee is that no other session in the data stream carries the same identifier.
As an aside, interactions that do not correspond to actual user interactions (because no user could be identified or because the datapoint corresponds to an interaction not triggered by the user) are all labelled with a <void> sesId.
-
sesSize: number of interactions this session contains. This is labelled only for the first interaction in the session, all other interactions carry a 0 in this field. Non-sessions such as the ones with <void> sesId will be left empty. This facilitates computing averages or other statistics on valid sessions, by just first filtering out all zero and empty values.
-
sesDuration: time duration for each session, counted from the instant the first user message was received, to the instant the last Aura message was sent. For single-interaction sessions its value will be the same as DURATION_NU, for multiple interactions it will contain the time interval between all of them.
As with sesSize, only the first interaction in a session is annotated with sesDuration; the remaining interactions will be assigned a 0 value (and interactions that do not correspond to a session will be left empty). Therefore, to compute statistics on sesDuration, remove the 0 and empty values first.
userType
This field may be used, in certain cases, to help identify rows that do not correspond to real users but to test users (internal users that belong to test/QA teams and whose behaviour is, therefore, not representative of actual Aura users).
The field contains a single character, which is s for standard (real) users, and can be Q or T for QA/Test users respectively (there are also lowercased versions q and t, referring to unconfirmed test users).
Note that test user identification is not available on every country, since it depends on having a register of the AURA_GLOBAL_ID identifiers that QA/Test users authenticate and this is not always available.
usrMsgSig
This field is not useful by itself. Instead, it is intended to be used to help grouping together very similar user utterances. It does so by generating a signature of the utterance that is (hopefully) insensitive to small variations in the sentence.
This is an experimental field; it might change if we reach a variant that is better suited for its purpose.
The way to generate this signature is by following these steps with the utterance:
-
Start with the normalized utterance (i.e., MESSAGE_USR_NORM).
-
Perform stemming (removal of word suffixes) on all the words. This makes bills and bill the same word.
-
Substitute words from a fixed list of very common, uninformative tokens (stopwords) by an asterisk. For example, this converts both “get my bill” and “get the bill” to the same phrase “get * bill”.
-
Group words in sets of 3 elements (trigrams) and sort them alphabetically. This removes the global structure of the sentence, while retaining local structure.
The resulting string is a non-understandable version of the original utterance (hence, it cannot be used by itself), but the fact that several very similar utterances produce the same signature helps cluster those utterances. An example is one of the preinstalled visualizations “Most Frequent User Utterances” which uses this field to group very similar utterances.
Another example is provided in the following figure, which shows message utterances generating the same signature:
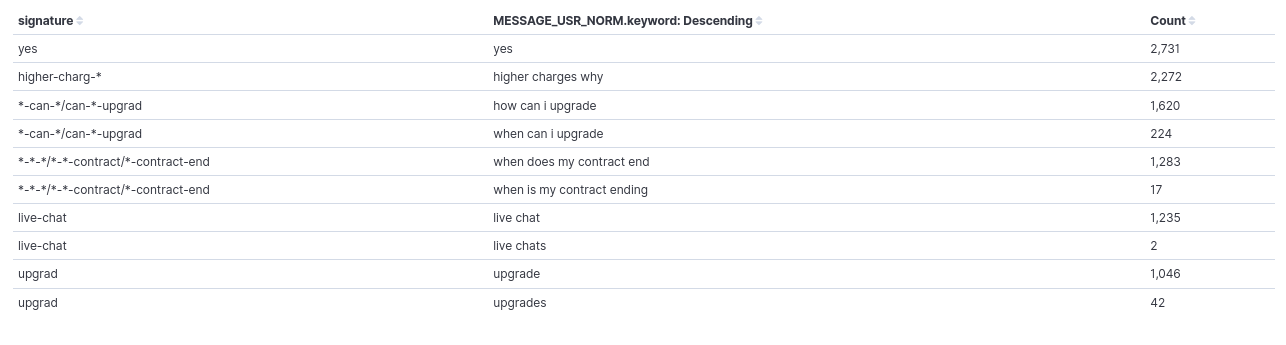
As it can be seen, the signature is the same for “how can I upgrade” and “when can I upgrade”, “when does my contract end” and “when is my contract ending”, and “live chat” & “live chats”. So, they would be counted together when aggregating by signature.
The procedure has its limitations and, as explained, it is experimental, so we are trying to improve it, but it can already alleviate a bit the inherent variability in user expressions.
AuraMsgGroup
Messages produced by Aura are as generated by its text resource database. In some cases, the same category of message produces different output texts, maybe because the message includes some user-dependent parameter or because the text database contains several variants of the same text (and Aura picks one at random).
The AuraMsgGroup field is a keyword field that helps categorize Aura answer by abstracting away some of this variation. It classifies the response given by Aura into two types of elements:
-
Generic group: a name such as <NONE>, <GREETING> or <NOTFOUND>, which corresponds to a response category (see Table 3)
-
Truncated answer: for answers that do not have a defined generic group, as a fallback the literal answer text is inserted, after substituting all numbers in it with a placeholder and truncating it (i.e., retain only the first characters).
The following table contains the generic groups defined so far. They correspond to the most frequent Aura messages. It is country-dependent, since it also depends on the use cases deployed in each country. As said above, responses not falling into these groups will be assigned a truncated version of the response text.
Note that th emost frequent Aura messages list can be enlarged with time. Also, the correspondence between Aura messages and groups is not static, if the text database is updated with new variants, it will be necessary to also update the translation table in the PPD cleaner process that generates this field.
| Group |
Meaning |
| EMPTY |
No textual answer from Aura (see note in Section MESSAGE_AURA for the usual meaning of no text answer) |
| NONE |
Aura says it did not understand the user utterance |
| ERR |
There was a processing error of some kind at Aura side, and the request could not be fulfilled |
| GREETING |
Aura is greeting the user |
| GOODBYE |
Aura is acknowledging a conversation end |
| YOU-ARE-WELCOME |
Aura is accepting a compliment |
| CHURN |
Aura recognizes the user intention to terminate a contract |
| NOTFOUND |
Aura tried to search for some bit of data concerning the user query, and could not find it |
| CANNOT |
Aura cannot fulfil the user request because of insufficient information (in the query, or on user data) |
| BILL-INFO |
The user requested information about her bill, and Aura is returning it |
| DATA-INFO |
The user requested information about her data usage, and Aura is returning it |
: The list can be enlarged with time. Also, the correspondence between Aura messages and groups is not static, if the text database is updated with new variants, it will be necessary to also update the translation table in the PPD cleaner process that generates this field.
1.4 - Annex: Dataset fields
Annex: Dataset fields detail
Explanation of the process that each field of the data model is going through towards a clean PPD
Introduction
The objective of the following tables is to explain the process that each field is going through within this flow:
AURA DATASET PPD_RAW PPD_CLEAN
-
Each cell of the table explains the process that the data field is undergoing in this specific moment before it gets to the concrete stage (table column).
-
For example, the field GLOBAL_AURA_ID is undergoing a “hashing” before it gets stored in PPD_RAW. After this, the “hashed data” is progressed without any further processing to PPD_CLEAN.
Tables used in the Active Listening process are described in the following sections. They belong to the Aura Entities database.
MESSAGE dataset
Message dataset (stored in local Kernel)
| # |
FIELD |
DESCRIPTION |
PPD RAW |
PPD CLEAN |
| 1 |
USER_ID |
Unique user ID in the OB systems |
NOT
transferred |
NOT
transferred |
| 2 |
MSG_DT |
Timestamp of the data |
|
|
| 3 |
MSG_ID |
Unique ID of the message |
|
NOT
transferred |
| 4 |
ACTION_CD |
Code of the action that produces the data |
|
NOT
transferred |
| 5 |
AURA_ID |
User logging ID in Aura. The user will have a new Aura_id each time she logs in Aura. |
Hashed |
|
| 6 |
PHONE_ID |
Phone number of the user |
NOT
transferred |
NOT
transferred |
| 7 |
CHANNEL_CD |
Code of the channel where the action happened |
|
|
| 8 |
SUBSCRIPTION_CD |
Code of the subscription type of the user in the OB |
|
NOT
transferred |
| 9 |
DOMAIN_CD |
Code of the domain where the action happened |
|
NOT
transferred |
| 10 |
CATEGORY_CD |
Code of the category where the action happened |
|
NOT
transferred |
| 11 |
COUNTRY_CD |
Code of the country |
|
NOT
transferred |
| 12 |
CORR_ID |
Correlator ID of the request that produces this data |
|
|
| 13 |
IS_CACHED |
Shows if the entity content was already cached or not |
|
NOT
transferred |
| 14 |
STATUS_CD |
Status code of the action, if meaningful |
|
|
| 15 |
REASON |
Result of the action in error case, code of the error |
|
NOT
transferred |
| 16 |
VERSION_ID |
Aura version that produces this data |
|
|
| 17 |
LANG_CD |
Language configured by the user for communication |
|
NOT
transferred |
| 18 |
TZ_CD |
Timezone where the communication happened |
|
NOT transferred |
| 19 |
DURATION_NU |
Duration in milliseconds of the action |
|
|
| 20 |
MESSAGE |
Content of the message |
Anonymized |
|
| 21 |
DIALOG_ID |
Id of the dialog where the message happens |
|
|
| 22 |
CONVERSATION_ID |
Id of the conversation where the message happens |
|
NOT
transferred |
| 23 |
WIN_RECOGNIZER_CD |
Code of the recognizer that wins for this message |
|
NOT
transferred |
| 24 |
WIN_RECOGNIZER_SCORE_NU |
Score of the recognizer that wins for this message |
|
NOT
transferred |
| 25 |
INTENT |
Selected intent |
|
|
| 26 |
ENTITIES |
List of entities determined by the recognizer |
|
|
| 27 |
MODALITY_CD |
How does the user communicate with Aura |
|
|
| 28 |
AURA_ID_GLOBAL |
Identifies the same user_id logged with the same authentication method |
Hashed |
|
| 29 |
ACCOUNT_NUMBER |
Unique account number of the user |
NOT
transferred |
NOT
transferred |
RECOGNIZER dataset
Recognizer dataset stored in local Kernel
| # |
FIELD |
DESCRIPTION |
PPD RAW |
PPD CLEAN |
| 1 |
USER_ID |
Unique user ID in the OB systems |
NOT transferred |
NOT transferred |
| 2 |
RECOGNIZER_DT |
Timestamp of the data |
|
|
| 3 |
RECOGNIZER_ID |
Unique ID of the recognizer |
|
|
| 4 |
ACTION_CD |
Code of the action that produces the data |
|
NOT transferred |
| 5 |
AURA_ID |
User logging ID in Aura. The user will have a new Aura_id each time she logs in Aura. |
Hashed |
|
| 6 |
PHONE_ID |
Phone number of the user |
NOT transferred |
NOT transferred |
| 7 |
CHANNEL_CD |
Code of the channel where the action happened |
|
|
| 8 |
DOMAIN_CD |
Code of the domain where the action happened |
|
NOT transferred |
| 9 |
CATEGORY_CD |
Code of the category where the action happened |
|
NOT transferred |
| 10 |
COUNTRY_CD |
Code of the country |
|
NOT transferred |
| 11 |
CORR_ID |
Correlator ID of the request that produces this data |
|
|
| 12 |
IS_CACHED |
Shows if the entity content was already cached or not |
|
NOT transferred |
| 13 |
STATUS_CD |
Status code of the action, if meaningful |
|
|
| 14 |
REASON |
Result of the action in error case, code of the error |
|
|
| 15 |
VERSION_ID |
Aura version that produces this data |
|
|
| 16 |
LANG_CD |
Language configured by the user for communication |
|
NOT transferred |
| 17 |
TZ_CD |
Timezone where the communication happened |
|
NOT transferred |
| 18 |
DURATION_NU |
Duration in milliseconds of the action |
|
|
| 19 |
SCORE_NU |
Score returned by the recognizer |
|
|
| 20 |
INPUT |
User input sent to the recognizer. Null if incoming message is an AuraCommand |
Anonymized |
|
| 21 |
OUTPUT |
Complete output generated by the recognizer |
|
|
| 22 |
INTENT |
Intent returned by the recognizer |
|
|
| 23 |
ENTITIES |
Entities returned by the recognizer due to the intent |
|
|
| 24 |
COMMON_THRESHOLD_NU |
Common threshold used to determine the best answer of all recognizers |
|
NOT transferred |
| 25 |
THRESHOLD |
Specific threshold of the specific recognizer being executed |
|
NOT transferred |
| 26 |
EXPECTED_INTENT |
Intent expected to be returned by the recognizer |
|
NOT transferred |
| 27 |
EXPECTED_ENTITIES |
Entities expected to be returned by the recognizer due to the intent |
|
NOT transferred |
| 28 |
AURA_ID_GLOBAL |
Identifies the same user_id logged with the same authentication method |
Hashed |
|
| 29 |
ACCOUNT_NUMBER |
Unique account number of the user |
NOT transferred |
NOT transferred |
This Markdown table can be directly used in your GitHub Markdown files.
API dataset
API request dataset (stored in local Kernel)
| # |
FIELD |
DESCRIPTION |
PPD RAW |
PPD CLEAN |
| 1 |
USER_ID |
Unique user ID in the OB systems |
NOT transferred |
NOT transferred |
| 2 |
REQUEST_DT |
Timestamp of the data |
|
|
| 3 |
REQUEST_ID |
Unique ID of the request |
|
|
| 4 |
ACTION_CD |
Code of the action that produces the data |
|
NOT transferred |
| 5 |
AURA_ID |
User logging ID in Aura. The user will have a new Aura_id each time she logs in Aura |
Hashed |
NOT transferred |
| 6 |
PHONE_ID |
Phone number of the user |
NOT transferred |
NOT transferred |
| 7 |
CHANNEL_CD |
Code of the channel where the action happened |
|
NOT transferred |
| 8 |
DOMAIN_CD |
Code of the domain where the action happened |
|
NOT transferred |
| 9 |
CATEGORY_CD |
Code of the category where the action happened |
|
NOT transferred |
| 10 |
COUNTRY_CD |
Code of the country |
|
NOT transferred |
| 11 |
CORR_ID |
Correlator ID of the request that produces this data |
|
|
| 12 |
IS_CACHED |
Shows if the entity content was already cached or not |
NOT transferred |
NOT transferred |
| 13 |
STATUS_CD |
Status code of the API request |
|
|
| 14 |
REASON |
Result of the action in error case, code of the error |
|
|
| 15 |
VERSION_ID |
Aura version that produces this data |
|
NOT transferred |
| 16 |
LANG_CD |
Language configured by the user for communication |
|
NOT transferred |
| 17 |
TZ_CD |
Timezone where the communication happened |
|
|
| 18 |
DURATION_NU |
Duration in milliseconds of the action |
|
|
| 19 |
HOST |
Host of the API |
|
|
| 20 |
PATH |
Specific path of the API being called |
|
NOT transferred |
| 21 |
HTTP_STATUS |
HTTP status of the server response |
|
NOT transferred |
| 22 |
RESPONSE |
Response body |
Anonymized |
|
| 23 |
AURA_ID_GLOBAL |
Identifies the same user_id logged with the same authentication method |
Hashed |
NOT transferred |
| 24 |
ACCOUNT_NUMBER |
Unique account number of the user |
NOT transferred |
NOT transferred |
| 25 |
REQUEST |
Request body |
|
|
2 - Aura Analytics 2.0.0
Aura Analytics 2.0.0
Description of Aura Analytics 2.0.0, the monitoring tool designed and managed by Aura Global Team that allows active listening in Aura
What is Aura Analytics 2.0.0?
Active listening is defined as a key process that involves a continuous monitoring of Aura performance based on real logs from the users to analyze them and gather insights on the efficiency and effectiveness of Aura as a system and also to track the interaction of our users with Aura.
In this framework, Aura Analytics 2.0.0 is a tool used by Aura Global Team that uses active listening with the ultimate goal of improving Aura quality, as it generates accurate information to carry out both corrective and predictive actions and to decide how Aura should evolve in the future.
How does Aura Analytics 2.0.0 work?
-
The process is built upon Aura users logs generated in production environment
-
From these logs, Aura Analytics 2.0.0 create PPDs (Privacy-Preserving Datasets)
-
Datasets are processed, enabling the visualization through dashboards and the extraction of statistical insights
-
The Aura Global Team consumes this data to support decision-making processes
Target users
-
The Aura Global Team is the target user of the Aura Analytics 2.0.0 tool, responsible for its design and management as well as for the interpretation of results for decision-making.
-
OBs should allow the generation of datasets from their Aura users logs in their local environment just by installing and executing a single process, as shown in the document Guidelines for OBs.
Index of documents
Aura Analytics 2.0.0 includes the following documents:
Aura Analytics versions
Release 1.0.0
The first release 1.0.0. sets up the basic paths, deploys the PPD infrastructure and produce:
- Version 1.0.0. of the OB Analytics system, which includes the OB Dashboard.
- The first version of pre-processed datasets (clean PPDs) for training and analytics at Aura Global.
As mentioned, this version enables going further by:
-
Enhancing the analytics dashboard with new visualizations.
-
Processing the PPD files as desired (they are standard CSV files, which can be ingested in alternative platforms if desired). Restrictions on them are softer than on the original logs due to the anonymization process they have been subjected to, although they are still subjected to management precautions (a code of conduct is being prepared for that).
Release 1.1.0
Version 1.1.0. introduces the following changes:
- The table of data has been enlarged with these new fields:
AURA_ID, STATUS_CD, sesId, sesSize, sesDuration.
- An expanded list of test users is used, so that the
userType column contains more identifications.
- The code for data ingestion into a local Kibana, which previously consisted on a single Python script, has been turned into a full Python package to be installed, due to its increasing complexity.
Release 2.0.0
Version 2.0.0 introduces the following changes:
- In 2.0.0 version, Aura Analytics has undergone a refactor to improve its structure and make it easier to understand, maintain and extend in the future.
- Aura Analytics 2.0.0 simplifies the deployment and execution process.
- But one of the most significant enhancements in Aura Analytics 2.0.0 is its capability to manage both processed and to-process files centrally in one place (database).
The prerequisites for the use of Aura Analytics 2.0.0 are set below:
- Recommended tool for data visualization: ELK stack
2.1 - Architecture
Aura Analytics 2.0.0. architecture
Technical architecture of Aura Analytics 2.0.0 and description of main processes and components
Architecture overview
Aura Analytics 2.0.0 contains two different environments:
-
OB local environment: Processes in this side are managed by the OB, that should install and execute certain processes related to the PPD-Creator for the creation of raw datasets.
-
Global environment: Processes here are managed by Aura Global Team for data recovery, processing and generation of dashboards and statistics. The output includes data and metrics to be consumed by Aura Global Team for decision-making.
Aura Analytics 2.0.0 architecture flowchart
The following diagram shows an overview of Aura Analytics 2.0.0 architecture, including the environments involved and the main components and processes, which are fully described in succeeding sections.
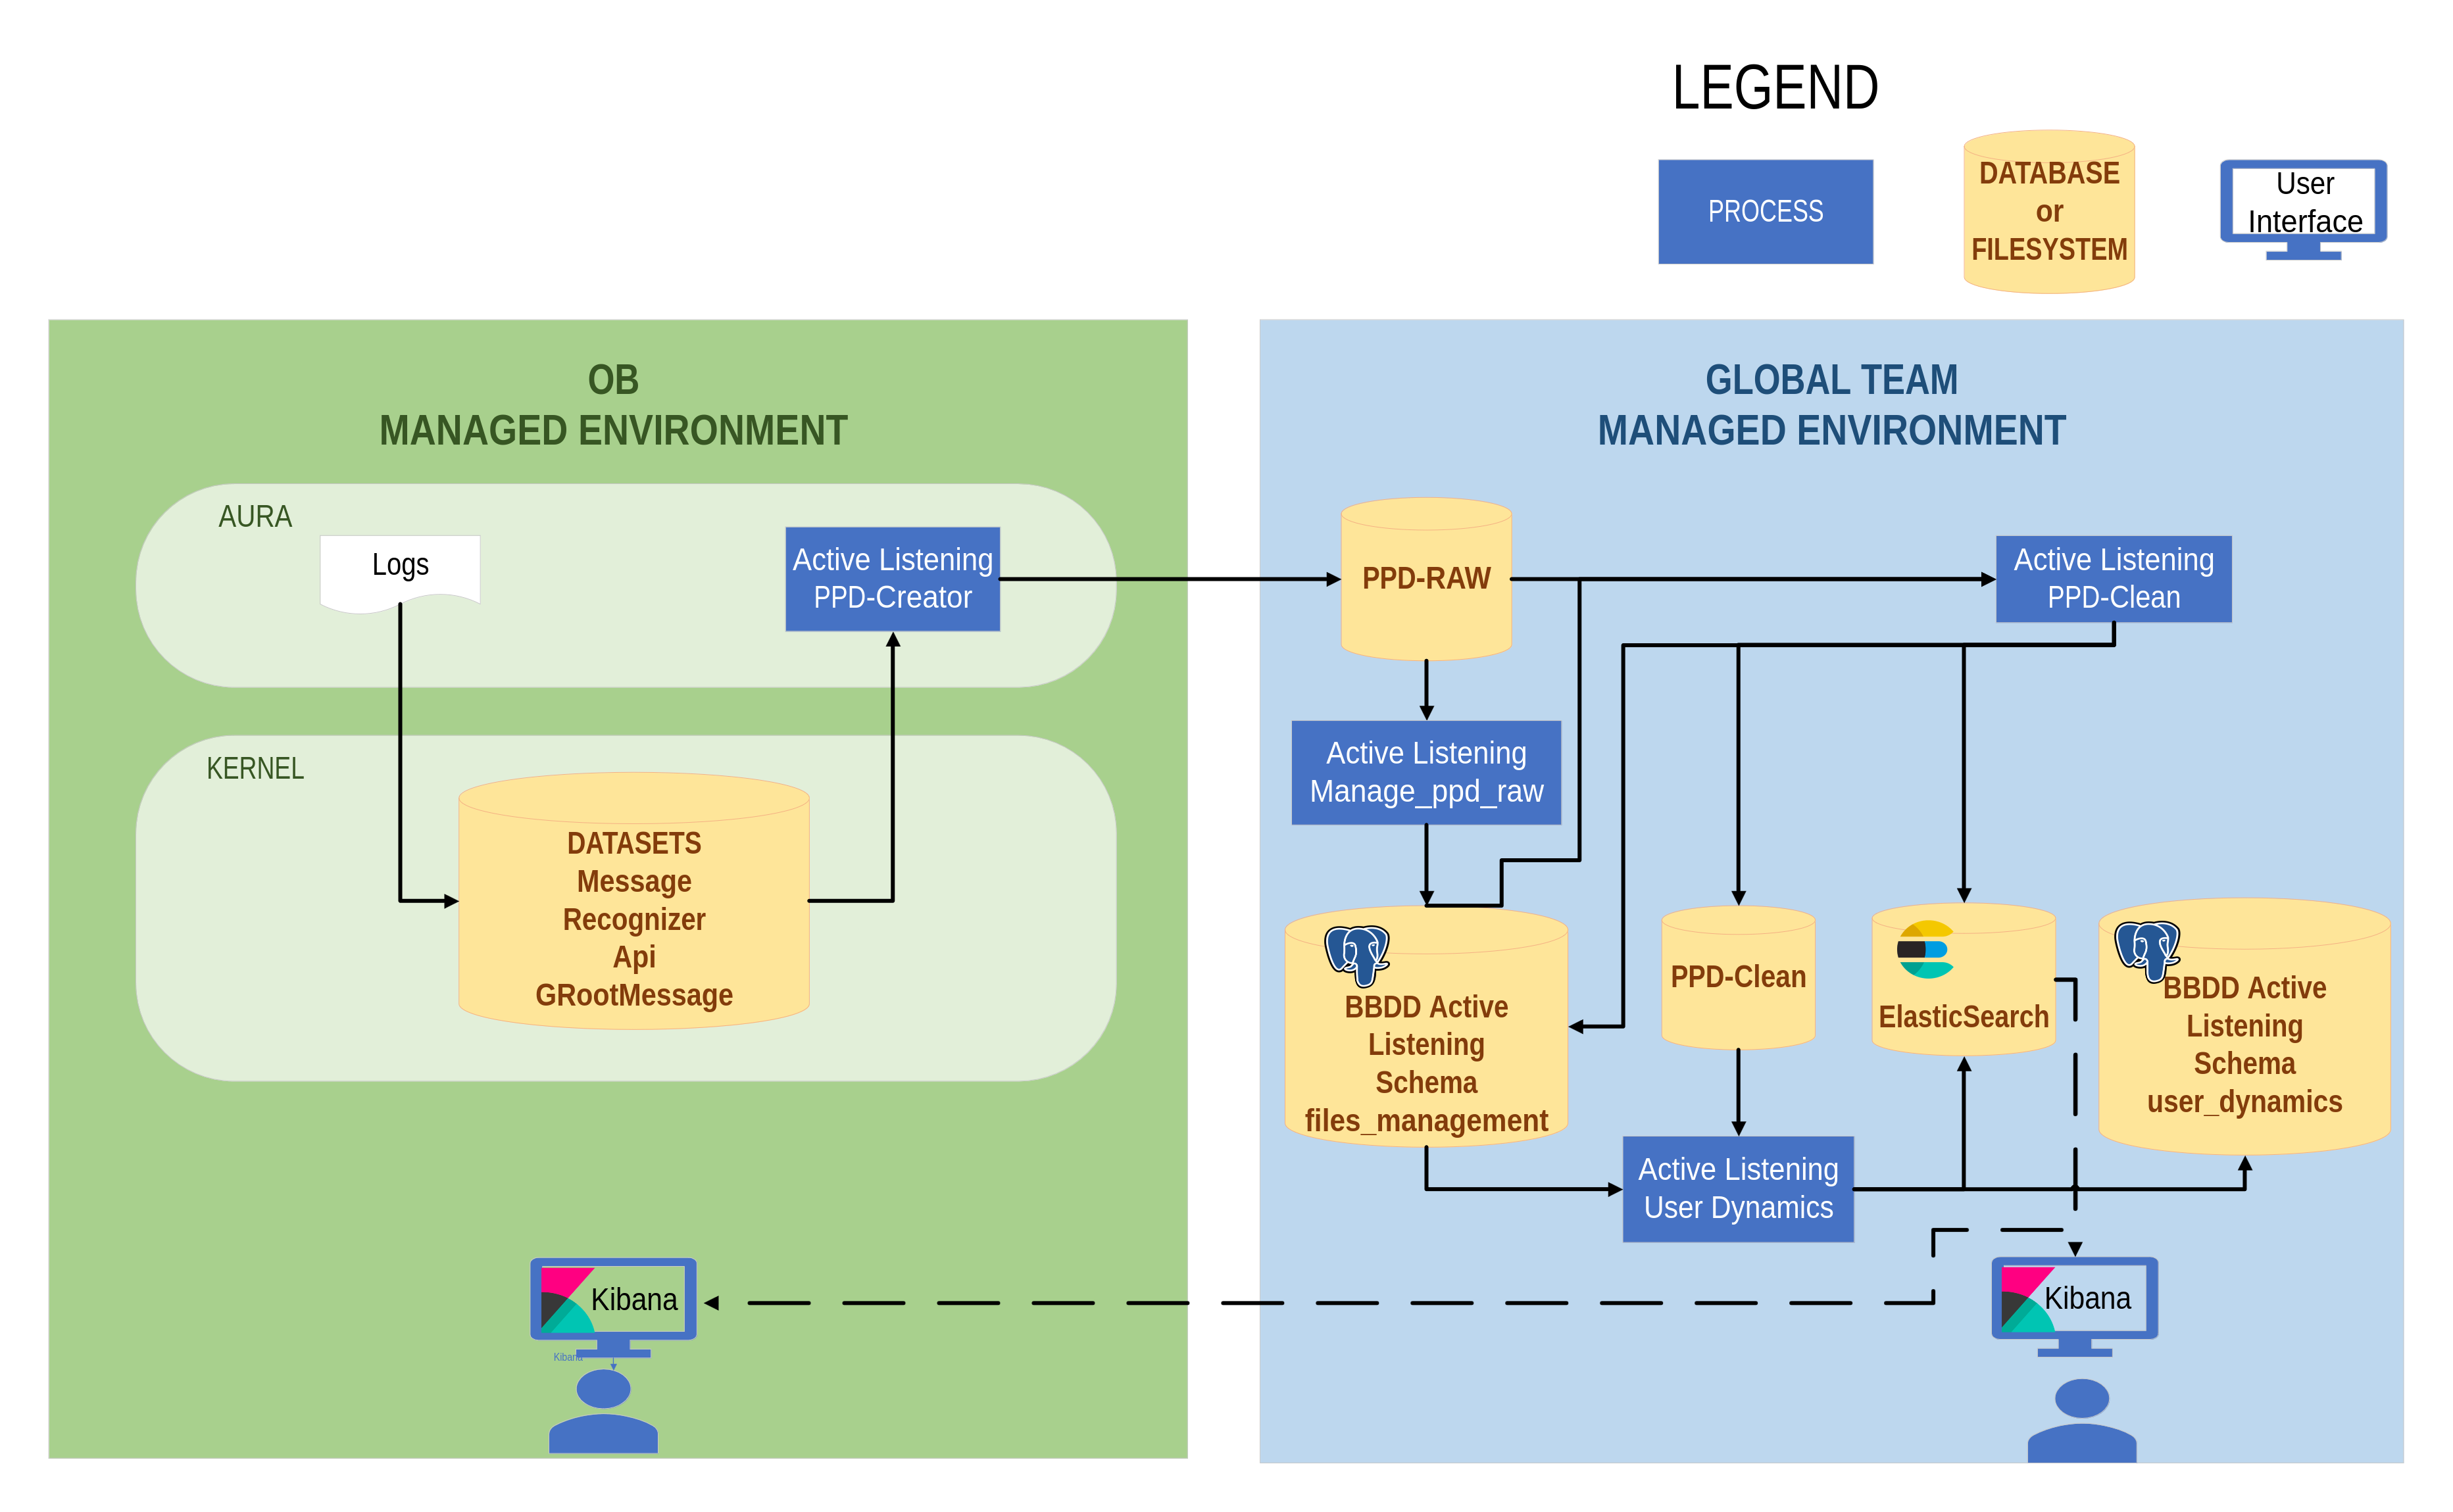 Figure 1. Aura Analytics 2.0.0 Architecture flowchart
Aura Analytics 2.0.0 processes
PPD-Creator process
The PPD-Creator is a Python module for the creation of PPD-Raw datasets.
It is the only component that belongs to the OB environment. The OB should install it and is responsible for its execution. The PPD-Raw datasets will be stored in the destination blob PPD-RAW.
This process reads the files included in OB MANAGED INSTANCES columns of the tables in Annex: Dataset fields. The result of this process is the PPD RAW columns of the tables in the above-mentioned annex.
The main tasks executed by the PPD-Creator are summarized below:
- Reads the Aura log files in a Kernel Blob.
- Anonymize the sensible fields (
AuraID, AuraGlobalID, and personal information of user sentence such as DNI, phone numbers, etc).
- Save the anonymized files to another directory of blob (PPD-Raw).
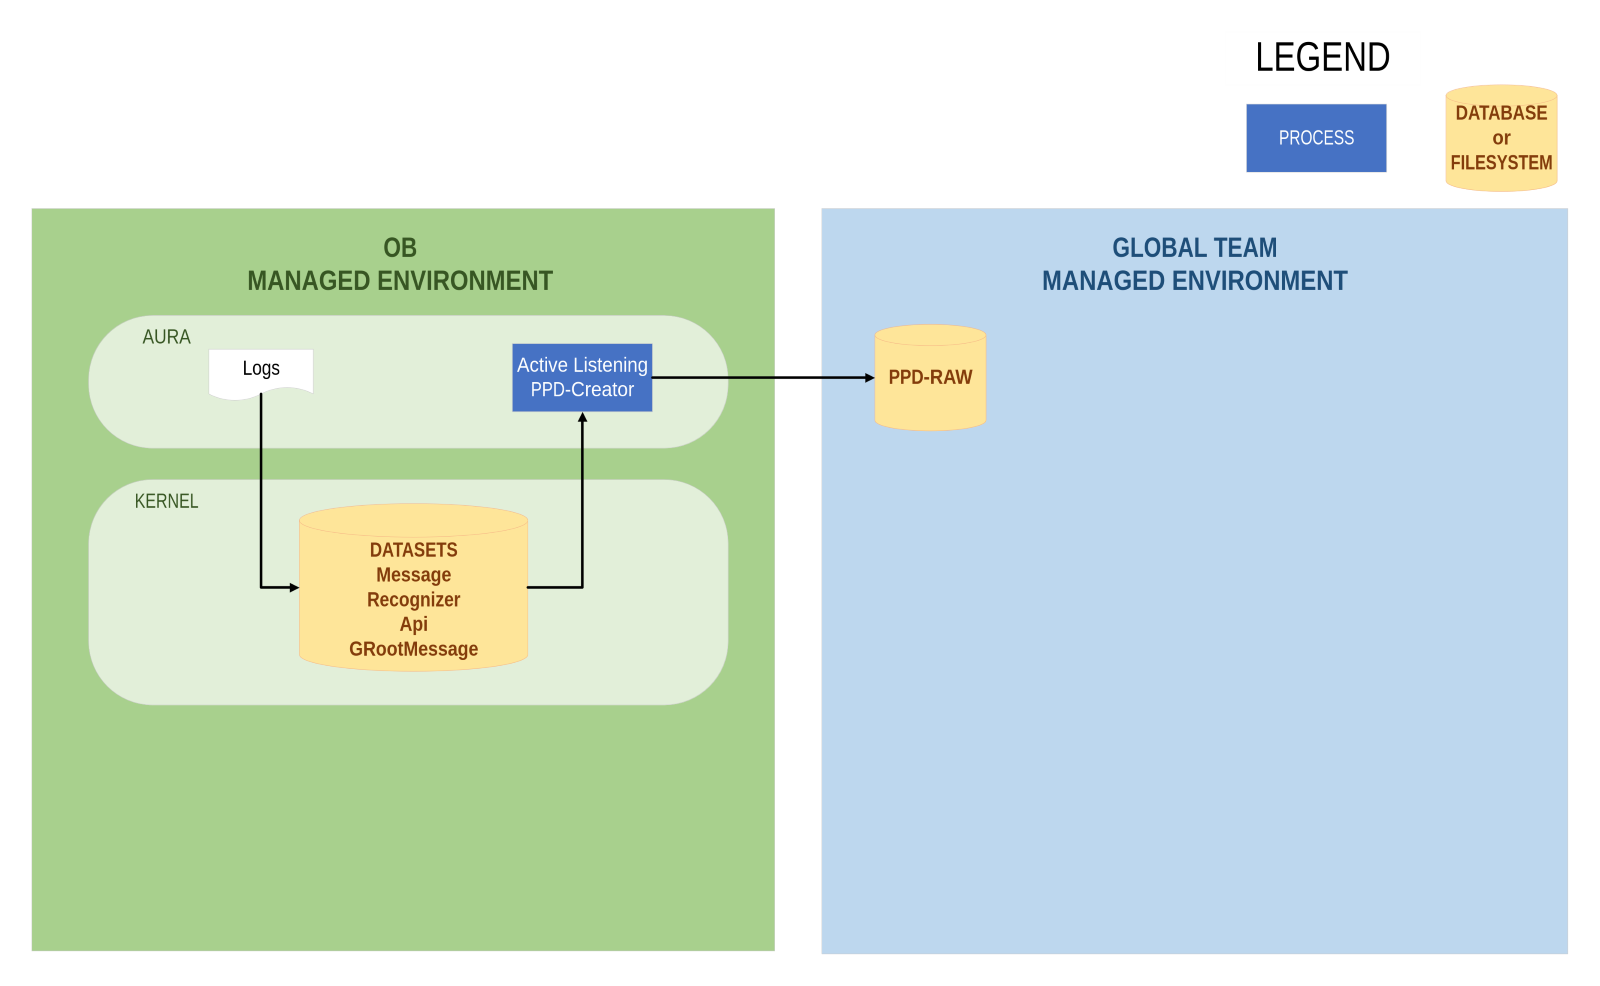 Figure 2. PPD-Creator process
The PPD-Creator anonymizes the following data, in the different OBs:
| ES |
UK |
| dni |
creditcard |
| nie |
insurance |
| phone |
postcode |
| email |
imei |
|
phone |
|
imsi |
|
email |
|
twitter |
|
passport |
Manage PPD-Raw process
The Manage PPD-Raw process inserts the PPD-Raw path files (output from PPD-Creator) to PostgreSQL table for files management data centric:
- It reads the output of PPD-Creator JSON file
- Afterwards, it saves the paths to PostgreSQL server
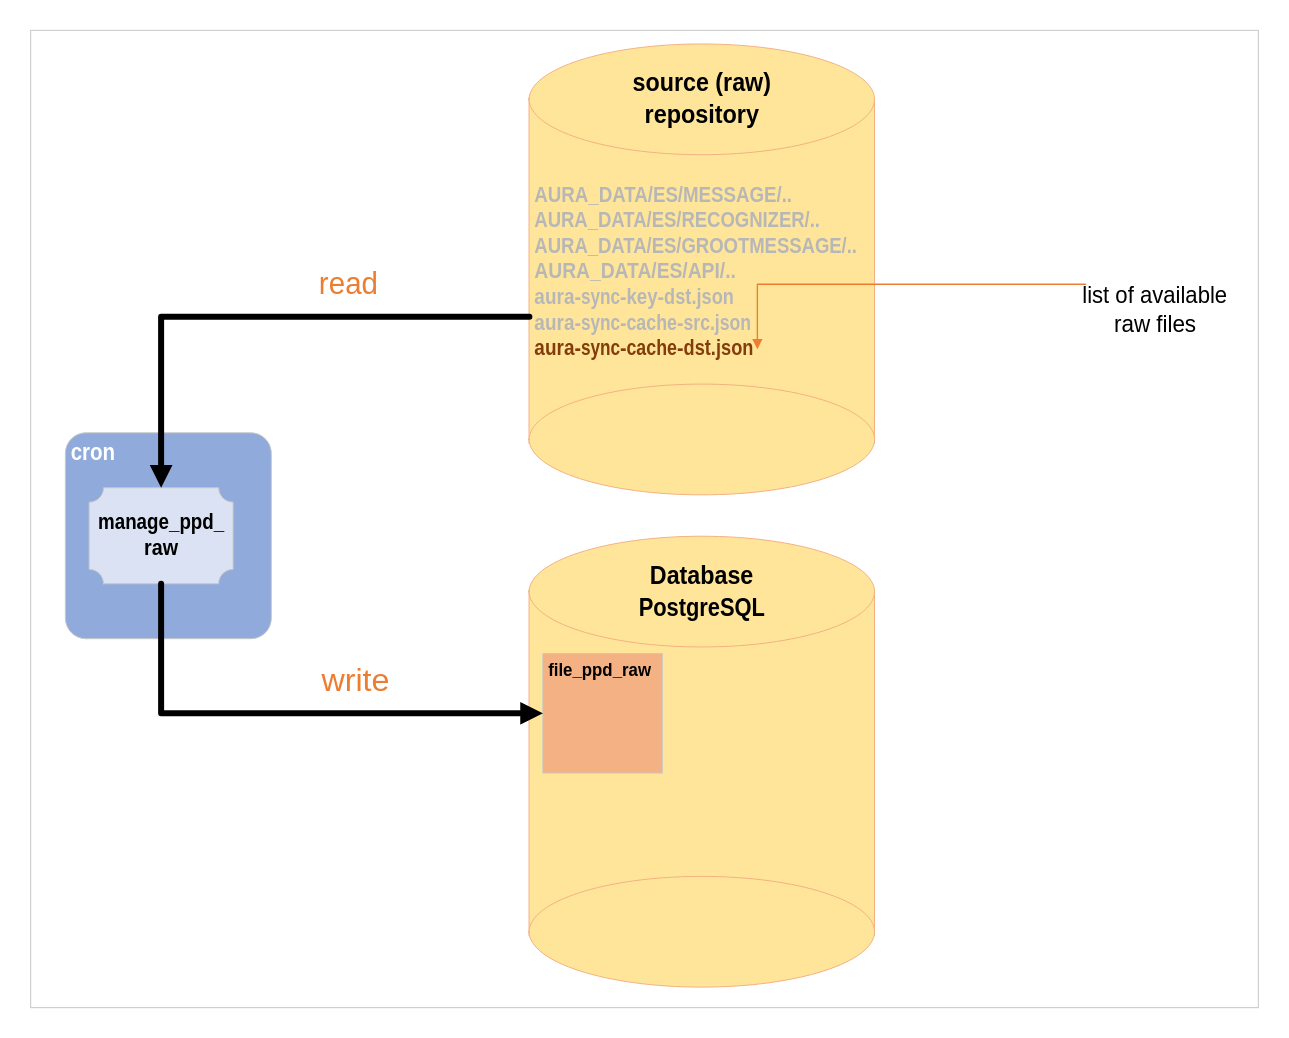 Figure 3. Manage PPD-Raw process
PPD-Clean process
The PPD-Clean is a Python package used to clean PPD-Raw datasets.
Firstly, this process locates the directory where the PPD-Raw files are located, reads the corresponding files and processes them.
Once the process is finished, it writes to the files_processed table in the database and saves them in the PPD-Clean directory.
The main tasks executed by the PPD-Clean are summarized below:
- Apply transformations to columns
- Extract the explicit frustration
- Calculates the Nones n-grams
- Save the data in Directory or blob, PostgreSQL server and ElasticSearch for visualization
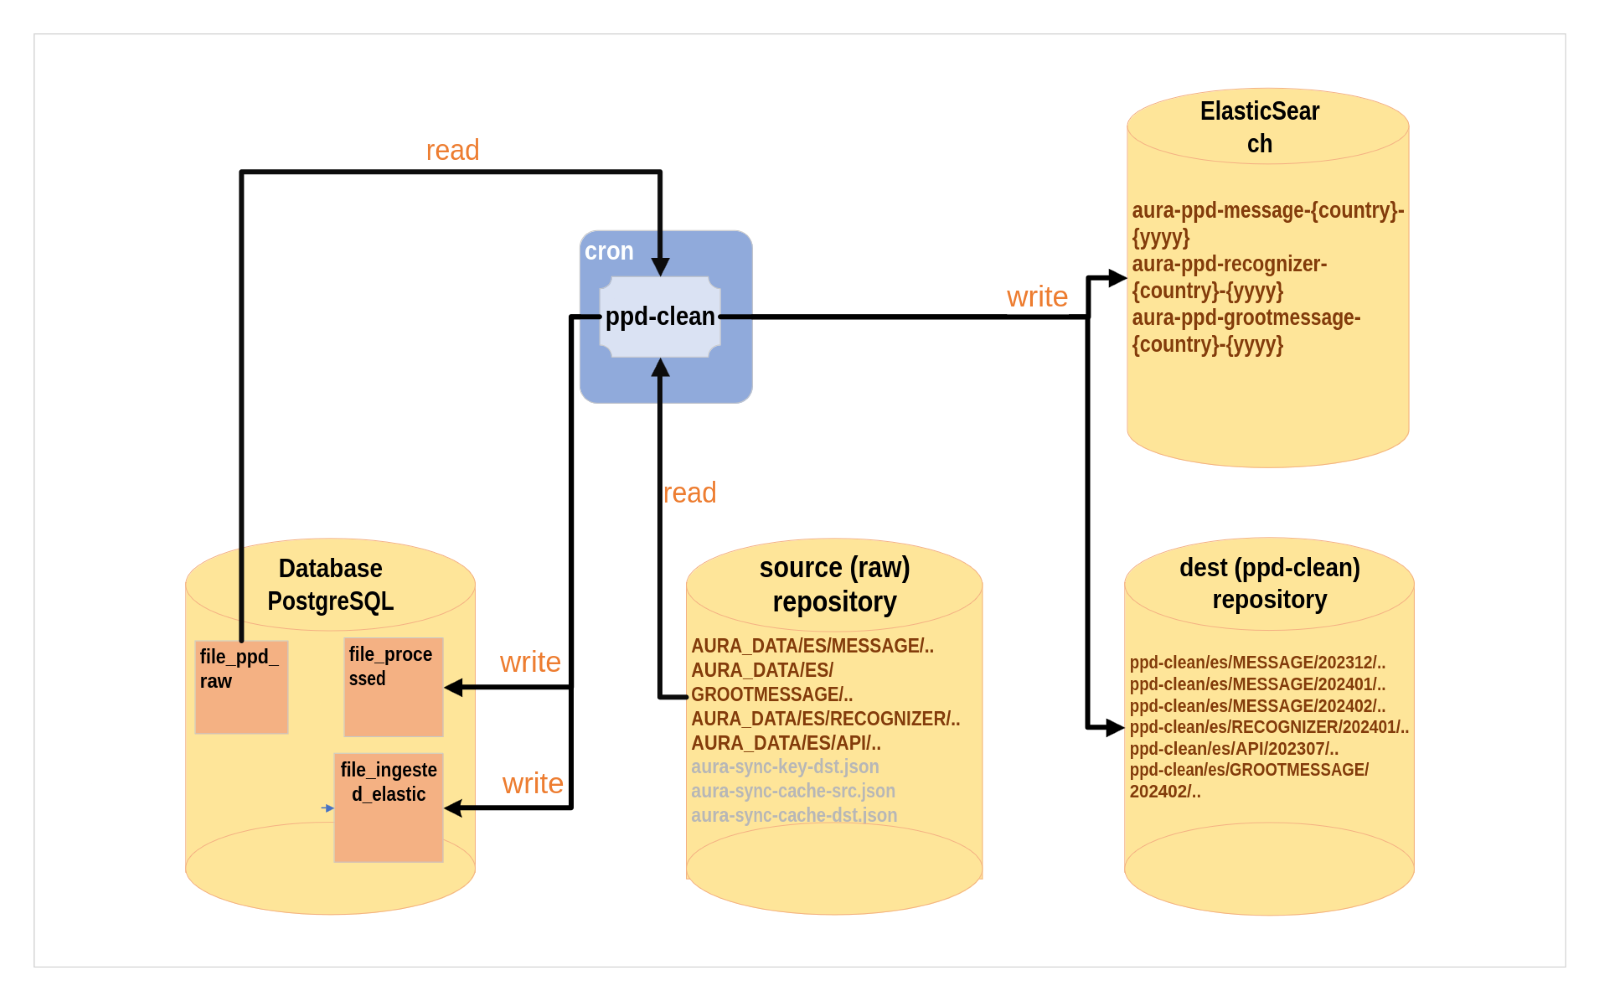 Figure 4. PPD-Clean process
User Dynamics process
User dynamics is a script used to measure the user’s behavior through metrics. It extracts statistics on the recurrence of users in Aura in a monthly basis.
The processes executed are summarized below:
- User dynamics reads the
file_processed table of the database and the all PPD-Clean files stored for 1 month.
- It extracts metrics regarding new users, recurrent users, lost users and recovered users.
- Afterwards, it saves these metrics in the
User_dynamics schema, in a PostgreSQL database, within the tables connections, daycount, user and channel.
- Data is also saved in ElasticSearch.
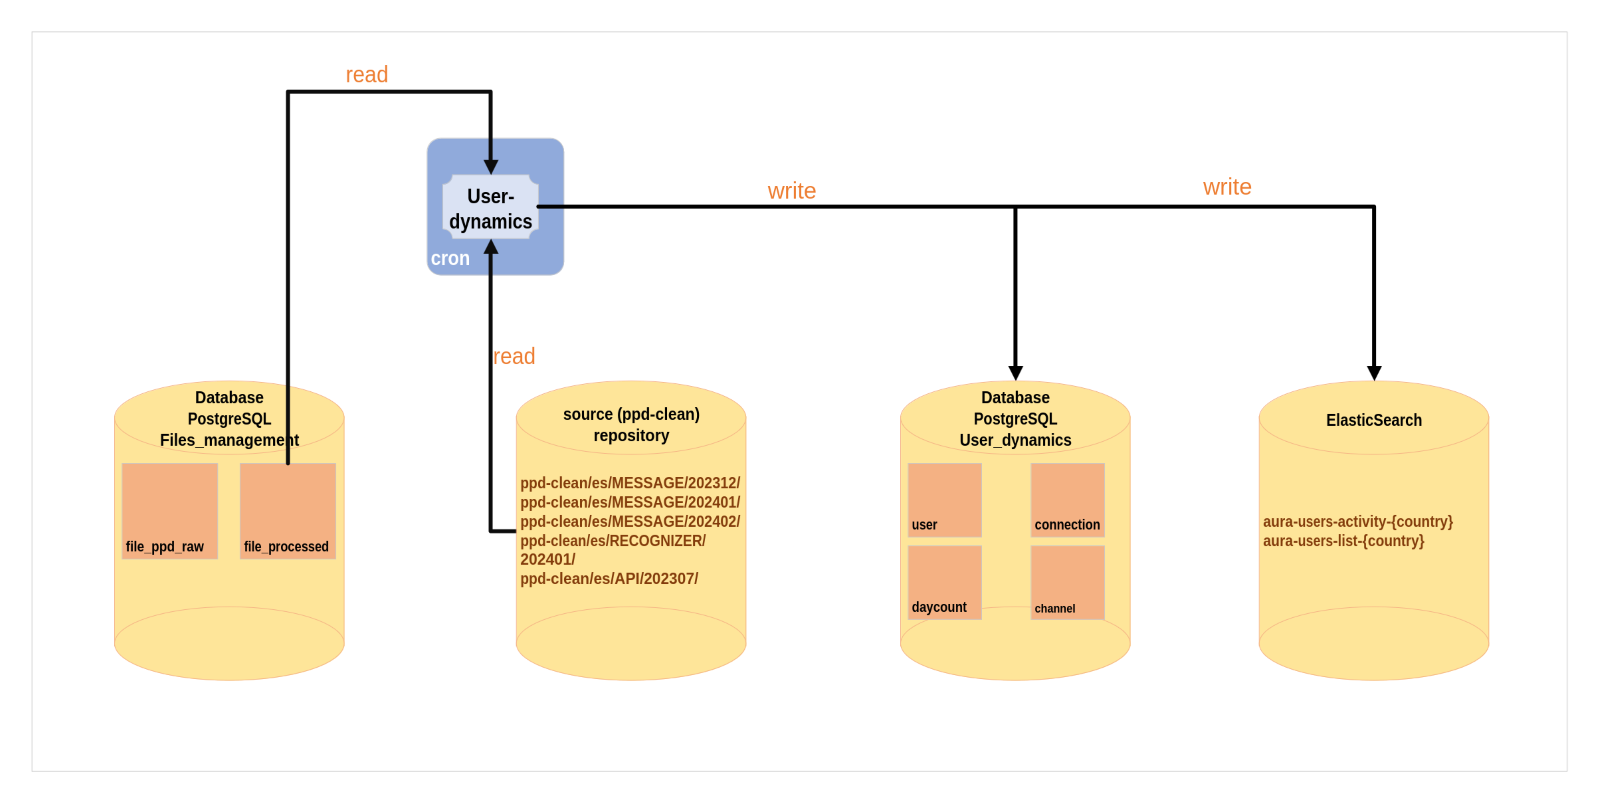 Figure 5. User Dynamics process
Components
Active Listening Database
The Active Listening Database is a PostgreSQL database that stores the processed and to-process files centrally in one place. It is used by the PPD-Clean and User Dynamics processes to store the processed data and metrics.
Schema files management
Currently, in the Active Listening project, we have input and output files for each of the processes and files that are processed. With the proposed database solution through the files management database, a more efficient management of raw files is achieved:
- The PPD-Creator process transfers files from the OB to a shared blob.
- The transferred files are written to a file in that blob called
aura-sync-cache-dst.json.
- The manage_ppd_raw process will read the
aura-sync-cache-dst.json file from the PPD-Raw folder and ingest the records into the FILE_PPD_RAW table of the database.
- It will also insert into the
EMPTY_DATA_FILES table the days that are not found in the JSON file. This table is necessary for logging metrics in Prometheus. This process will run daily.
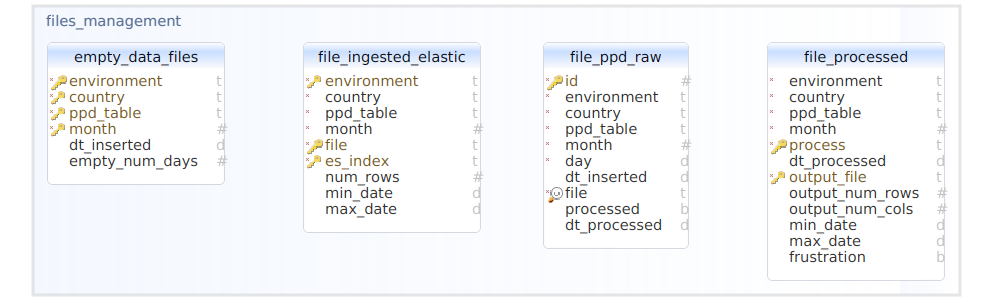 Figure 6. Files management database
Schema user dynamics
The User Dynamics process generates the statistics of Aura users, number of daily active users and types of users, with 4 categories: new, recurring, lost and recovered.
- The Channel table contains all the channels in Aura that have been processed by the User Dynamics process.
- The
User table contains the unique Aura users in each environment and country.
- The
Daycount table contains the number of total users for each day, indicating how many of them are new, recurring, recovered or lost users, the number of weekly unique recurring users and the number of monthly unique recurring users.
- The
Connection table has the status of the user for each day (whether it is new, recurring, lost or recovered).
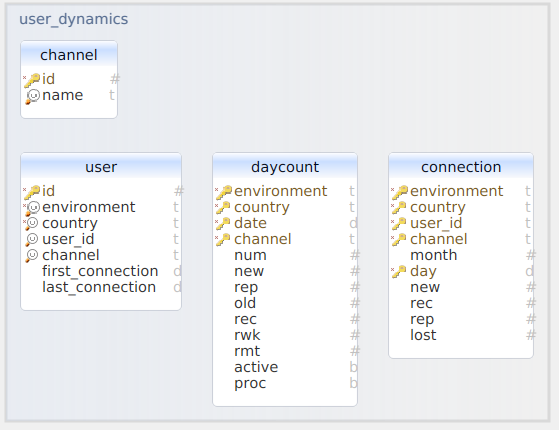
Figure 7. User dynamics database
Aura Analytics Dashboard
Aura Analytics 2.0.0 produces as a result, among other elements, an analytics component named Aura Analytics Dashboard that is the one used by Aura Global Team to gather statistics on the production system and to analyze user’s behavior.
This Analytics Dashboard is based on the ELK stack that contains:
- ElasticSearch: distributed search and analytics engine at the heart of the Elastic Stack. It allows the storage of data and its subsequent indexing, search and analysis.
- Kibana: provides a visualization tool that includes dashboards and panels created over the ElasticSearch data. Users interactively explore, visualize and share insights into data and manage and monitor the stack.
Once installed:
- An ElasticSearch index is created. It is called
aura-ppd-ENTITY-COUNTRY-YEAR, and its index schema contains a cleaned version of the AURA MESSAGE, RECOGNIZER or API tables (which registers input and output messages).
- A Kibana index pattern is created, matching the uploaded ElasticSearch index.
- A pre-defined set of visualizations are installed in Kibana over that index pattern, as a means to get a default peek on the index data. See the section pre-installed analytics dashboard.
- The system automatically ingests any new clean PPD being produced in the ElasticSearch database, so that the index and dashboards remain up to date.
In principle, the PPD creation process specifies daily production, since Aura logs are sent to Kernel once a day. This means that information about Aura behavior and user actions on one given day will be available in the dashboards of the following day.
As mentioned above, the Aura Analytics Dashboard is conceived to be used by Aura Global Team. However, OBs can install locally the ELK stack or any other visualization tool for data consumption. Access to the document Local data visualization for further details.
2.2 - Operation
Aura Analytics 2.0.0 operation
Discover Aura Analytics 2.0.0 operation at a glance
Introduction
Based on Aura Analytics 2.0.0 architecture, the current documents provides an overview of its global operation.
Take the Aura Analytics 2.0.0 architecture flowchart as a reference to follow each step of the dataflow described below:
-
Aura logs generated in local instance are converted to datasets and transferred to local Kernel via the standard
procedure and with the established frequency (typically, daily).
Once there, the Active listening process flow fires up daily.
-
PPD-Creator: This is the first process that runs, and it is the only one executed in the OBs’ environment. It
retrieves Kernel data, anonymizes all sensitive data that could identify users, and then transfers this data to
an environment shared with the Aura Global team.
-
Manage-PPD-Raw: This is the first process executed from the global environment. It solely stores the
paths of the data transferred by the PPD-Creator into a PostgreSQL database to keep a record of which data has been
transferred.
-
PPD-Clean: This process runs from the global environment. Once the data is anonymized, it is processed to
extract additional features (such as user frustration or the extraction of n-grams from user phrases about iterations
that do not have an intent).
-
Once the data is processed, a path is saved in the environment and also in ElasticSearch to create dashboards that tracks Aura usage by its customers.
-
User-Dynamics: This is the last process, also executed in global environment. It is responsible for extracting
statistics about users’ recurrence and the number of users per day. Among that, it identifies new users, recurring
users (those making iterations every day), recovered users (those who have stopped using Aura at some point and have
returned to the system) and lost users (those who have stopped using Aura in 3 months).
Examples of different dashboards are included below:
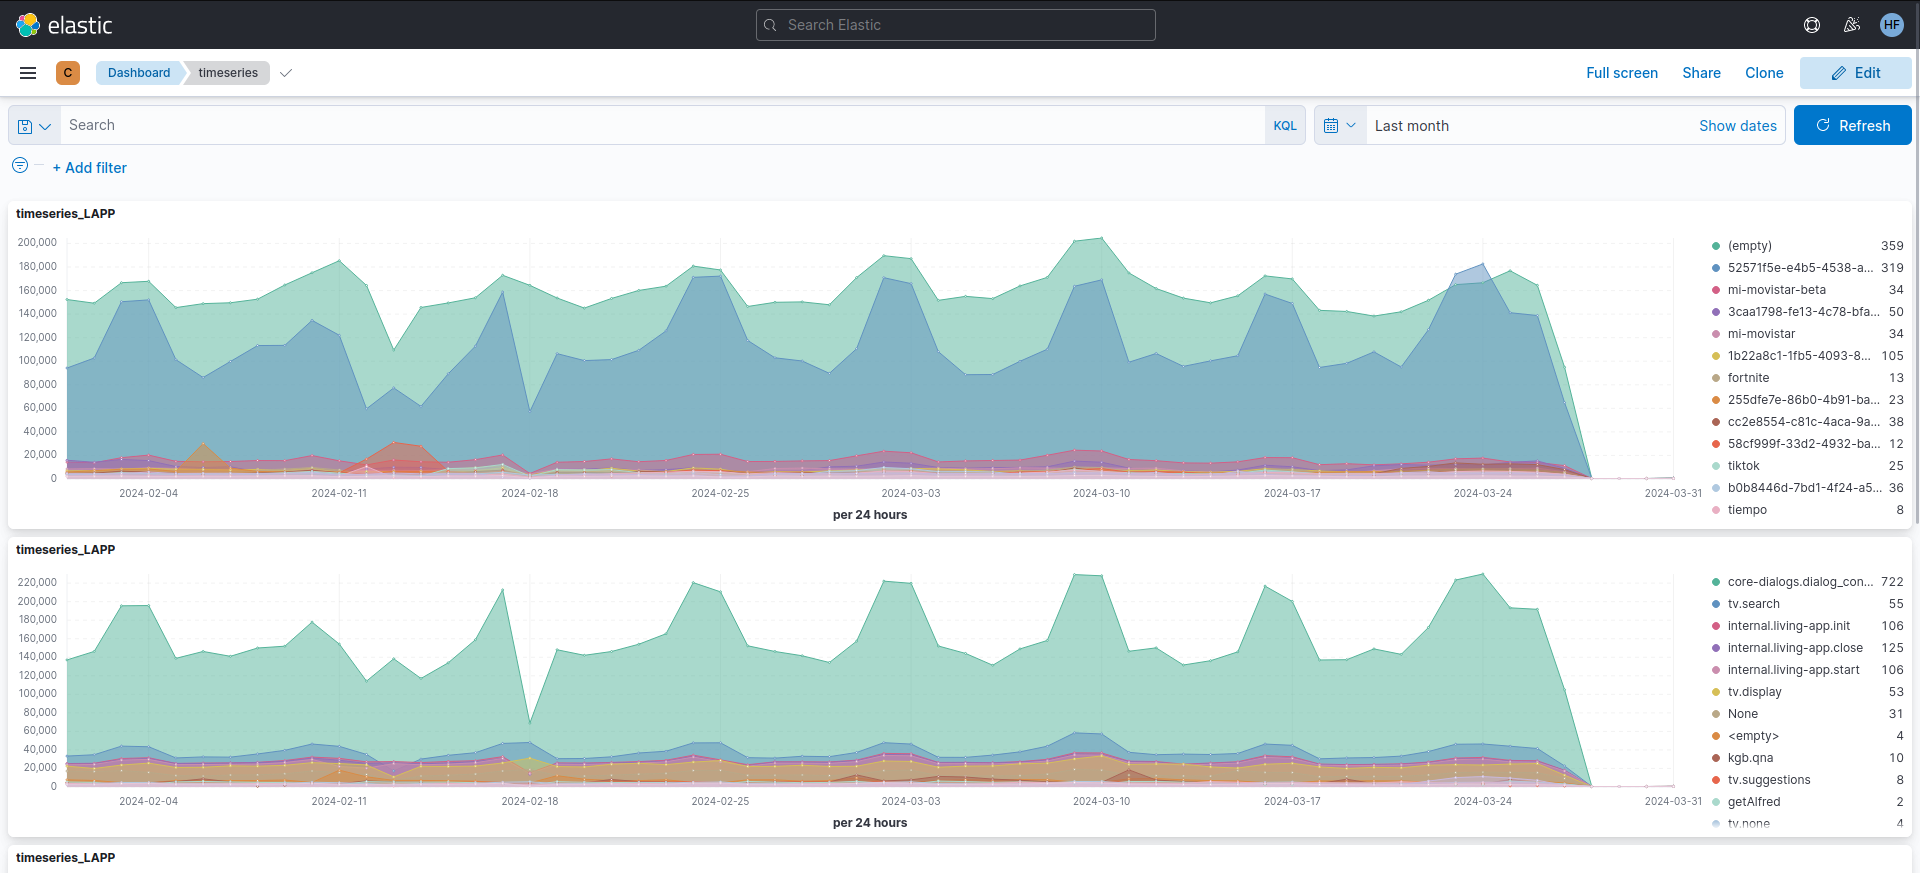 Figure 1. Users dashboard
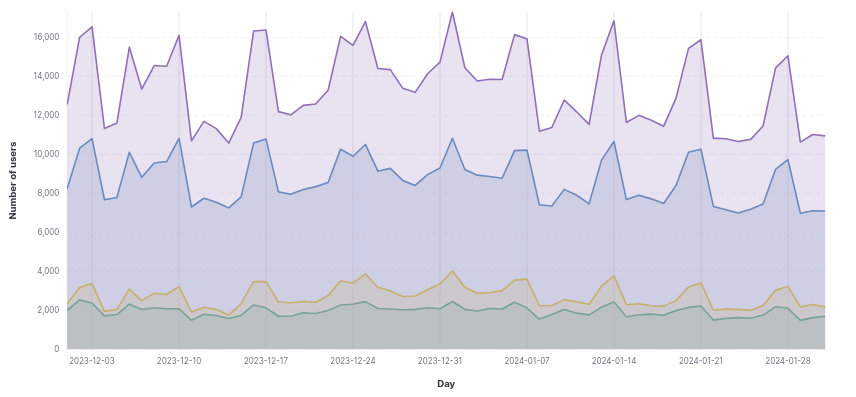 Figure 2. Daily users dashboard
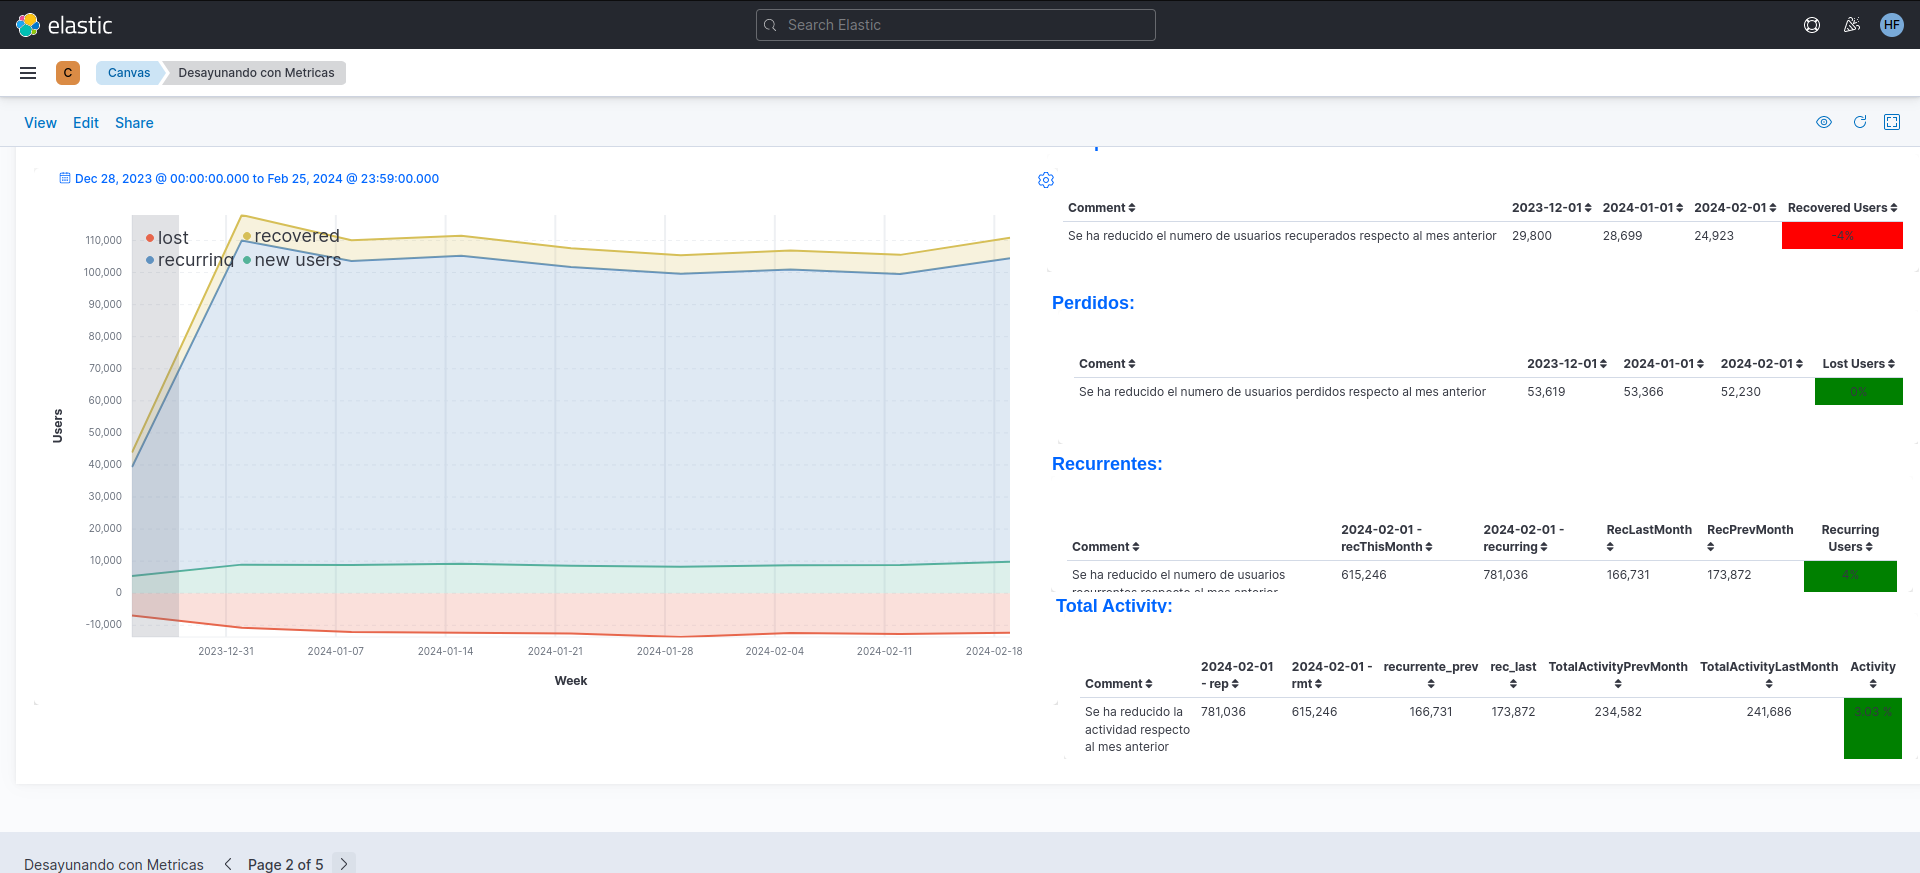 Figure 3. Weekly users dashboard
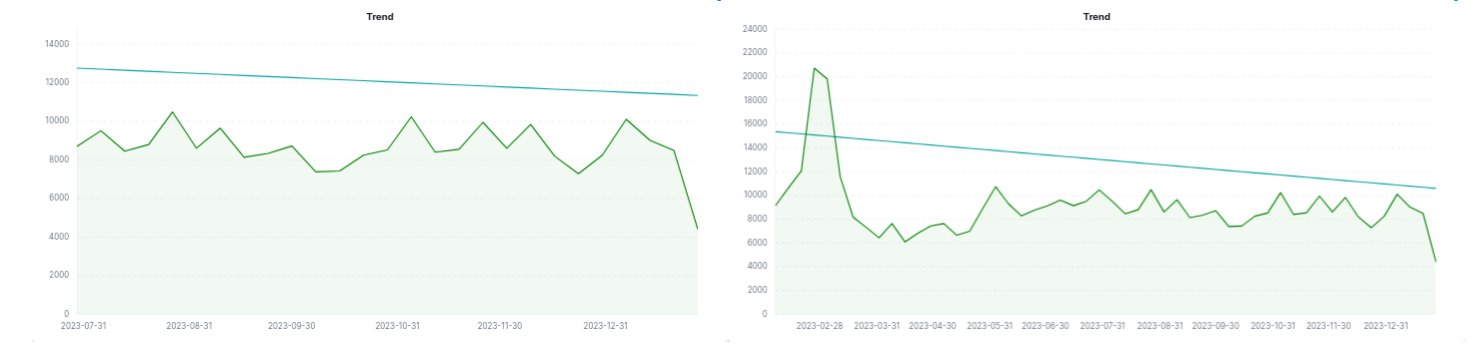 Figure 4. Trends dashboards
2.3 - Guidelines for OBs
Guidelines for OBs
Guidelines for OBs to allow the generation of datasets from their Aura users logs in local environment
Introduction
As seen in the Aura Analytics 2.0.0 architecture flowchart, Aura Analytics 2.0.0 contains two different environments: the OB local environment, managed by the OB and the Global one, managed by Aura Global Team.
Within this framework, the current guidelines are tailored towards OBs, indicating how to install and execute the PPD-Creator, for the creation and processing of PPD RAW datasets.
Once it is carried out, the subsequent processes of Aura Analytics 2.0.0 are executed in global environment by Aura Global Team.
Installation of PPD-Creator
The OB must install and store the PPD-Creator in a specific destination blob PPD-RAW and is responsible for its execution.
Guidelines are included in installer Aurak8s documentation: Active listening deployment.
Execution of PPD-Creator
The execution of the PPD-Creator must be done by the OBs, previous to its installation.
Parameters to launch the PPD-Creator
These are the parameters that the PPD-Creator takes from Kernel:
Mandatory parameters:
| Parameter |
Description |
Example |
--src-type |
Source type |
‘aws’, ’local’, ‘azure’ |
--src-name |
Source folder name (raw files) |
/directory/data/ |
--dst-type |
Destination type |
‘aws’, ’local’, ‘azure’ |
--dst-name |
Destination folder name (raw files processed) |
/directory/data/output |
--country |
Customize for a lang_country pair |
es |
--table |
Table to process {message, grootmessage, recognizer, api} |
MESSAGE |
--environment |
Environment to process (ap-one, ap-two, prod) |
ap-one |
| OPERATIONS |
|
|
--transfer |
File processing: transfer, anonymize and group files |
|
--copy |
Raw file copy – no processing |
|
--copy-fix |
File copy + apply small fixes |
|
--show |
Show available files; no action performed |
|
Optional parameters:
| Parameter |
Description |
--src-user |
Access key for the source folder |
--src-pass |
Source access secret |
--src-encryption |
Encryption key for data in source |
--dst-user |
Access key for the destination folder |
--dst-pass |
Destination access secret |
--dst-encryption |
Encryption key for data in destination |
--cloud-type |
Cloud type (‘aws’,’azure’) |
--dry-run |
Process dry-run: no action performed |
--reraise |
Re-raise exceptions on errors |
--options-file |
Read additional options from a file in dest repo |
--verbose |
Verbose level |
--console |
Act as a console app (format logs as console messages, raise on errors) |
--dest-log-skip |
Do not write the logfile at the destination folder |
--dest-log-dir |
Logging subdirectory at destination |
--show-input |
Print out input arguments |
--anon-key/ encryption-key |
Encryption key for anonymization of sensitive columns |
--max-files |
Maximum number of files to process |
--folders/month |
Restrict transfer to certain folders (i.e. months) |
--tables |
Restrict transfer to certain tables |
--reset |
Reset the index and re-process |
--encrypt-index |
Save the index files encrypted or unencrypted (default depends on cloud type) |
--raw |
Copy as raw data instead of text file |
--fix-header |
Fix file header |
--fix-anon |
Fix anonymized fields in API columns |
Launching PPD-Creator
Execute the following command:
docker run aura/ppd-creator --country <country-code> --anon-key <KEY> <source-params> <dest-params>
Example:
docker run aura/ppd-creator \
   --country ar \
   --anon-key as34-dre23-4127 \
   --src-name 4P-bucket-name-for-uk \
   --src-user EF45IHWD34DE4FGA \
   --src-pass k/Erf/6DSWWPjhdde1/abc123def-2331ldf \
   --dst-name aura-ppd-ar \
   --dst-user EF4341sdf3EFGUA1 \
   --dst-pass J/DQW/Sdde5k12ldsf/1abcde12dd1d-123c11 \
   --dst-encryption 1234ab56-12a3-45eb-8e06-8c522cdbb668-75f1b00f-6ca6-4a13-a741-64514cce728b \
   --table message \
   --environment prod \
   --transfer
Output from PPD-Creator
The output includes the following items:
-
BOT_XXXXXX.txt.bz2: raw files (processed).
-
log folder: if the logging options have been configured.
-
aura-sync-cache-dst.json: table/month: processed files (automatically generated in destination). For example:
{
  "AURA_DATA/ES/API/202212/": [
    "BOT_04095750-724e-11ed-9565-53054255c842_ES_API_20221202T150000Z.txt.bz2",
    "BOT_d2e93fc0-7656-11ed-a8eb-49a811568ab3_ES_API_20221207T170000Z.txt.bz2",
    "BOT_987780e0-7660-11ed-ba4a-2dac114c5321_ES_API_20221207T180000Z.txt.bz2"
  ],
  ...
}
-
aura-sync-cache-src.json: table/month: raw files_to_process (source).
For example:
{
"AURA_DATA/ES/API/202212/": [
  "BOT_04095750-724e-11ed-9565-53054255c842_ES_API_20221202T150000Z.txt",
  "BOT_05a5b860-7663-11ed-bbf7-cb8fd9eb3c25_ES_API_20221207T190000Z.txt",
  "BOT_05ae43e0-7663-11ed-a0aa-8b7e0e134809_ES_API_20221207T190000Z.txt",
  "BOT_0d69fb10-7492-11ed-a1fc-95dce7e56901_ES_API_20221205T110000Z.txt"
],
  ...
}
-
aura-sync-key-dst.json: key used to encrypt sensitive fields.
For example:
{
  "sample": "abcd1234-ab12-12ab-ab12-1abc234e56fg"
}
Local data visualization (optional)
As explained before, Aura Global Team will be in charge of the analysis of the generated data through the global tool Aura Analytics Dashboard.
Nevertheless, just in case the OB wants to visualize certain data locally:
- This will be done following a prior agreement with the OB on privacy-related matters.
- Aura Global Team will provide access to the clean data stored in the corresponding PPD-clean blob container.
- The OB can install locally the ELK stack or other alternative tool for data visualization.
- No support will be offered by Aura Global team for this task.
2.4 - Analytics Dashboard
Aura Analytics 2.0.0. Dashboard
Description of Aura Analytics 2.0.0 dashboard used by Aura Global Team to gather statistics on the production system and to analyze user’s behavior.
Aura Analytics 2.0.0 produces as a result, among other elements, an analytics component named Aura Analytics Dashboard that is the one used by Aura Global Team to gather statistics on the production system and to analyze user’s behavior. This Analytics Dashboard is based on the ELK stack.
The dashboards provides a pre-defined set of visualizations, described throughout this document. Nevertheless, it is possible to build additional dashboards using the ELK stack.
Pre-installed analytics dashboard
Kibana offers many possibilities to visualize the ingested data, and there are many resources and tutorials around
explaining its mechanics. We therefore refer to the official Kibana documentation, or the many tutorials available on the Web, for generic information.
In the particular case of Aura Analytics 2.0.0, there is an ElasticSearch index that gets automatically ingested daily.
It is called Aura-message-COUNTRY, and contains a cleaned version of the AURA MESSAGE table (which registers input and
output messages).
Over this index, three types of panels/visualizations have been pre-installed:
- Discover panel
- Visualizations
- Dashboards
Discover
The Discover panel in Kibana is an essential tool for performing queries to an ElasticSearch index (save
those searches, if desired), and explore users’ interactions with Aura in detail log by log, these being filtered by:
Search terms or conditions » A time interval » Additional filters applied to the query results » A set of index fields to show in the result table.
These 4 steps are represented in Figure 1:
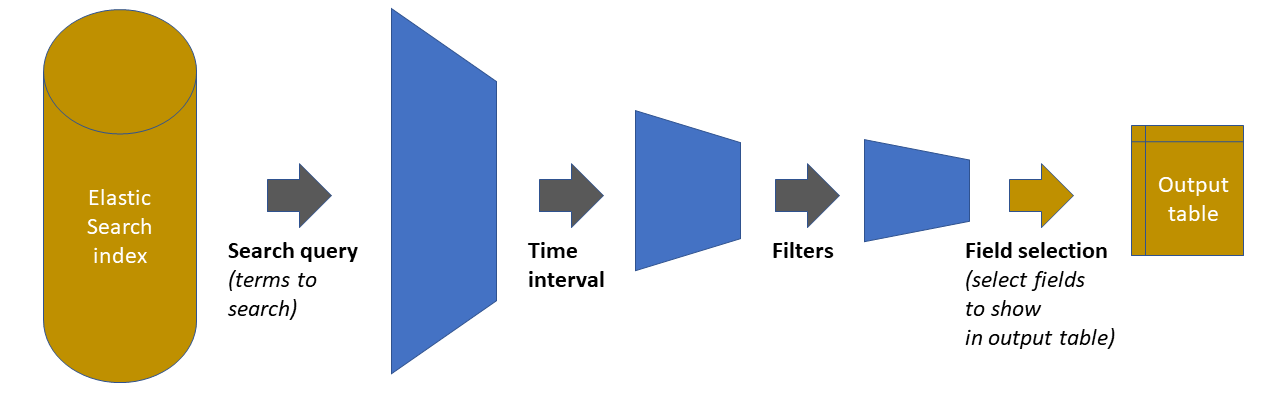 Figure 1. Discover panel
As shown in this figure, the starting point is the ElasticSearch index holding all the data.
Each of the three first steps in the chain reduces the amount of data handled, by pruning out elements that do not satisfy the defined condition. The fourth step is just a display adjustment: on the final dataset, define which of the available fields will be shown on the output table that appears in the panel.
In the Aura Dashboard default set, there is one such Discover panel pre-installed. It is called question-answer pairs and has the following characteristics:
- A blank query (i.e., provide all the results)
- A time interval for the last 7 days
- A “only user” filter: filters out all intents that correspond to non-user queries (suggestions, help commands from the
client application, etc)
- A visualization that includes: timestamp, (cleaned) user message, detected Aura intent, associated
entities (if applicable), dialog that was invoked and Aura’s response.
Figure 2 shows a snapshot of this panel.
To load it, select the Discover tool in the left navigation bar, and then click on the “Open” menu option in the top
menu bar. A list of saved panels will be shown, with this one in it named “question-answer pairs”.
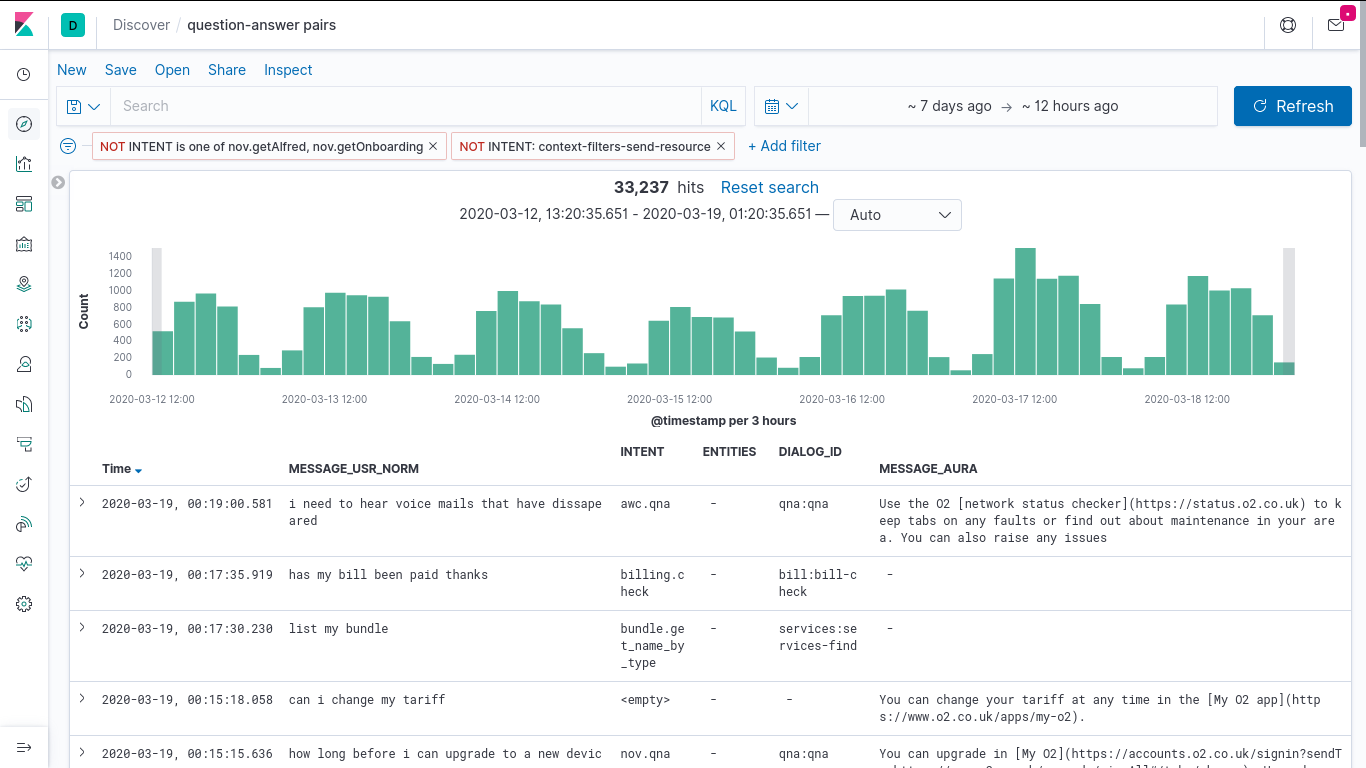 Figure 2. Question-answer pairs panel
Once the panel is loaded, each one of the aforementioned four elements can be freely modified, for example, the interface allows:
- Adding new filters with the “+Add Filters” button
- Deactivating the current filters by pressing over the predefined ones and clicking over the “Temporarily Disable” option
- Modifying the query interval with the “calendar” button or “Dates Box”
- Adding a specific query on a given index field(s) by using the “Search Box”, instead of the (default) blank query
Discover panels can be saved as named objects, to be later loaded at will. So, if needed, any panel (a modified panel or
a newly created one) can be saved with a new name, to have it available for later loading.
Visualizations
A total of 7 visualizations come pre-installed with the base Aura Dashboard. The list can be obtained from the
visualizations item in the left menu bar, shown in Figure 3:
- Three “Stats” type visualizations, which provide general statistics on platform usage.
- Four “User” type visualizations, which provide insights on user behavior.
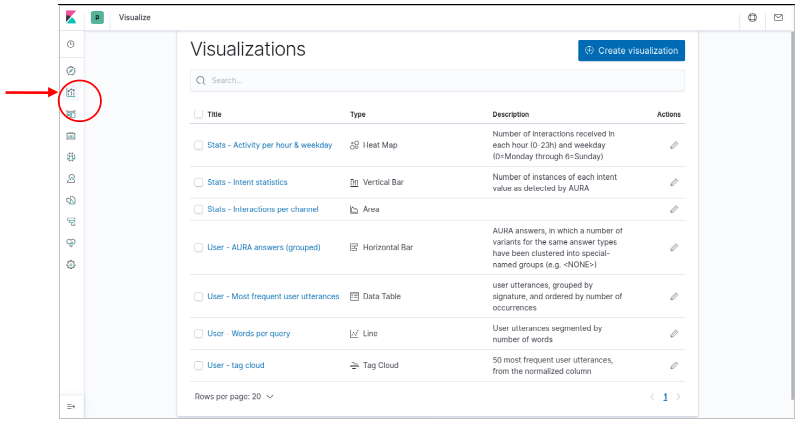 Figure 3. Preinstalled visualizations dashboard
Note that this distinction between “User” and “Stats” is purely conceptual and based on the fields that have been used to generate the visualizations as from the point of view of Kibana, they are all regular visualizations.
Those visualizations can be instantly loaded by clicking on their names. But they can also be integrated into dashboards, which is described in the next section.
Dashboards
A dashboard in Kibana is essentially a spatial arrangement of visualizations. For example, to construct a dashboard, we just
place visualizations into a page, resizing them as we wish, so we can observe all of them in a single place afterwards.
Within a dashboard all visualizations are linked. For example, if we change the time interval or add a filter using the interface, this modification affects all visualizations in the dashboard, and all of them get updated.
Elements in the dashboard visualizations can also generate “instant filters” by clicking on graphs or table elements. Those filters are added to the top of the page as a filter afterwards and can be modified or removed.
The Aura Analytics default installation preloads two dashboards. Those are available for selection when we click on the
Dashboard icon in the left navigation bar:
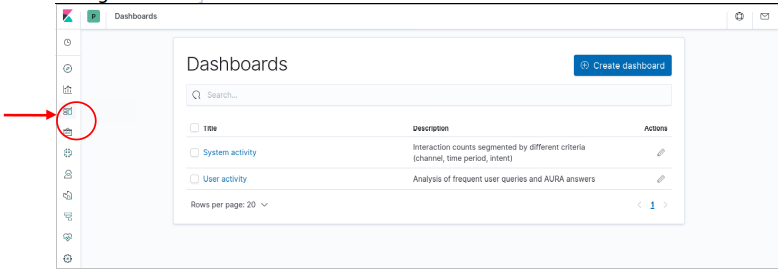 Figure 4. Aura analytics default dashboards
Nones dashboard
This dashboard integrates the n-grams extracted from PPD-Clean process.
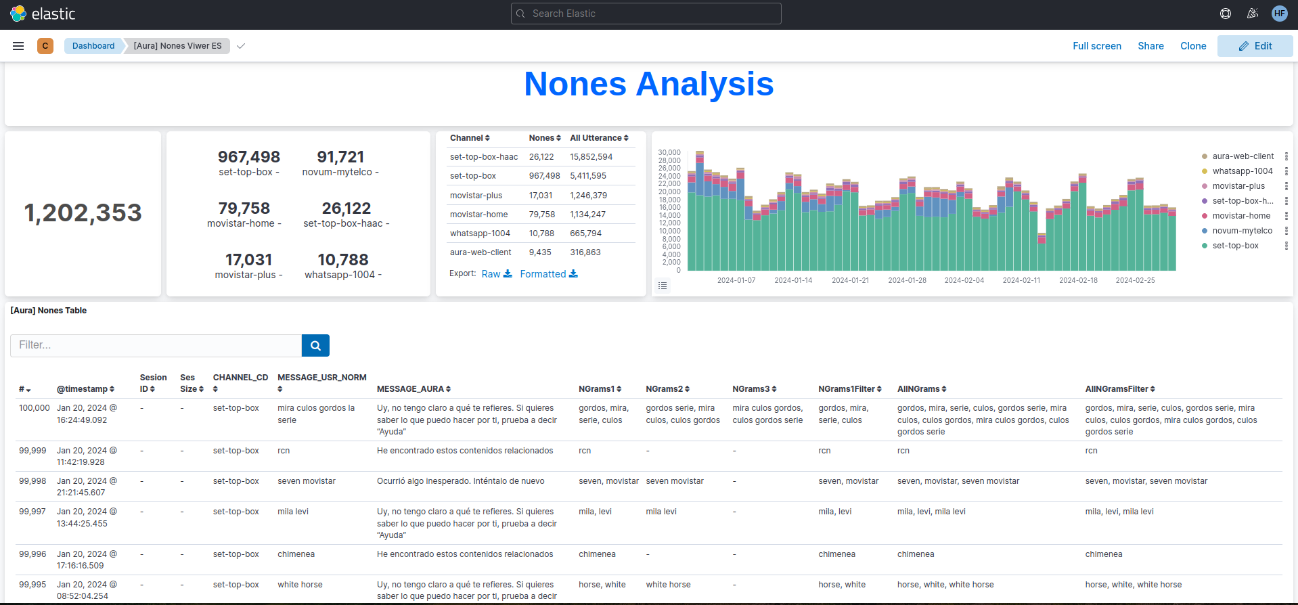
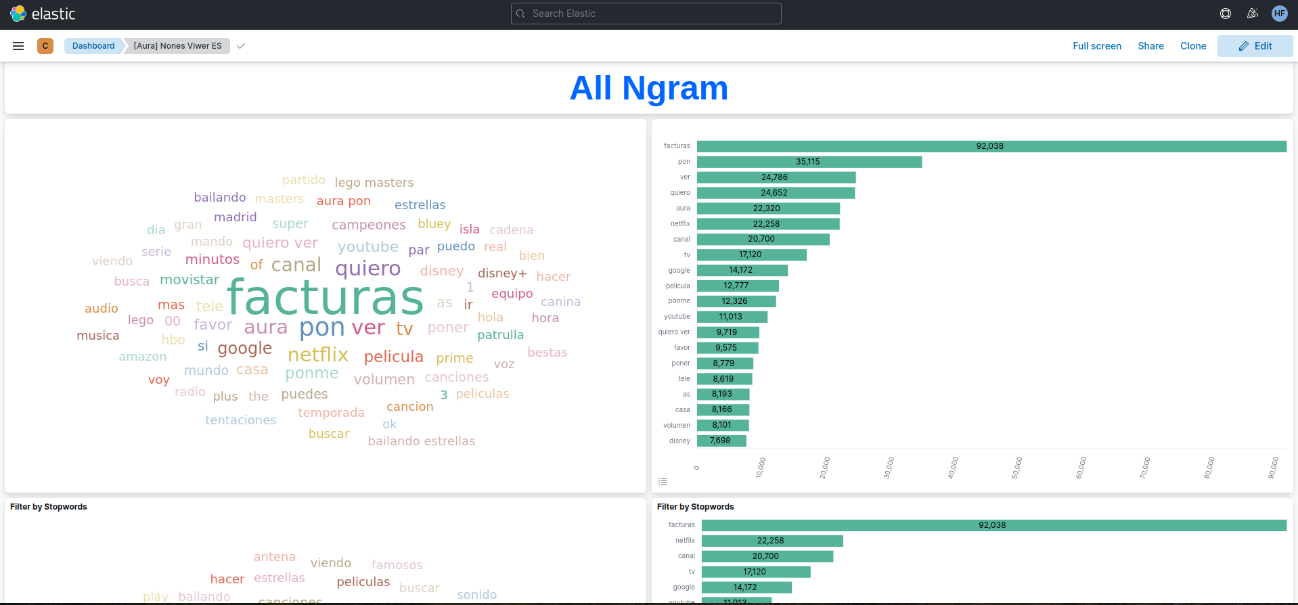
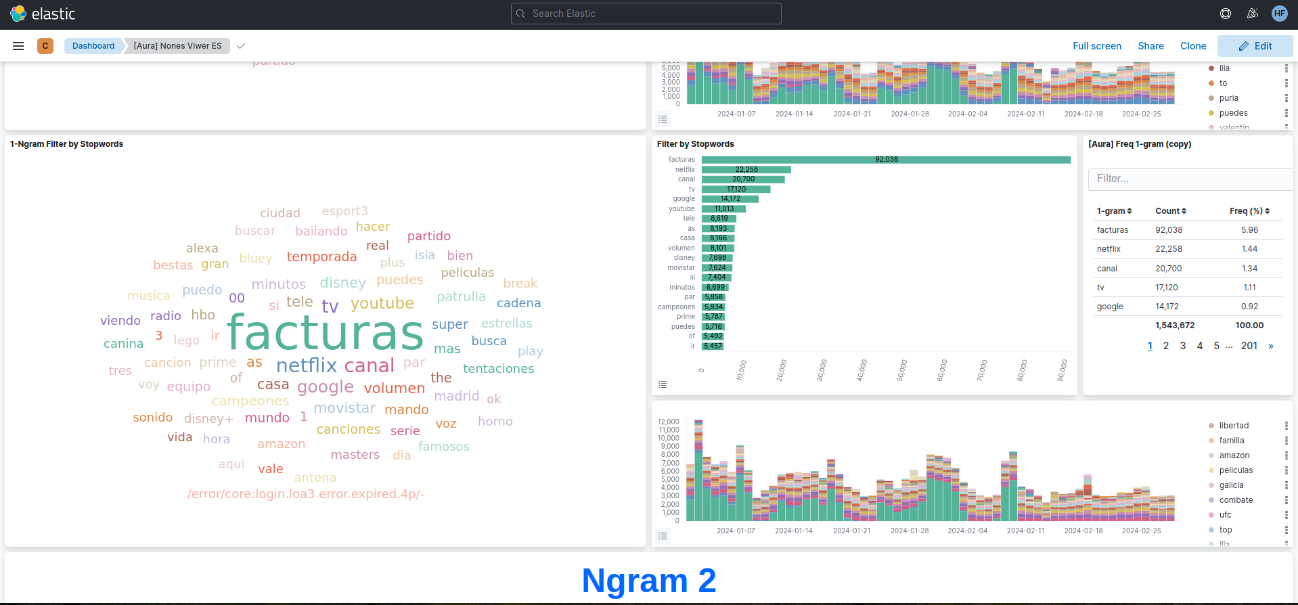
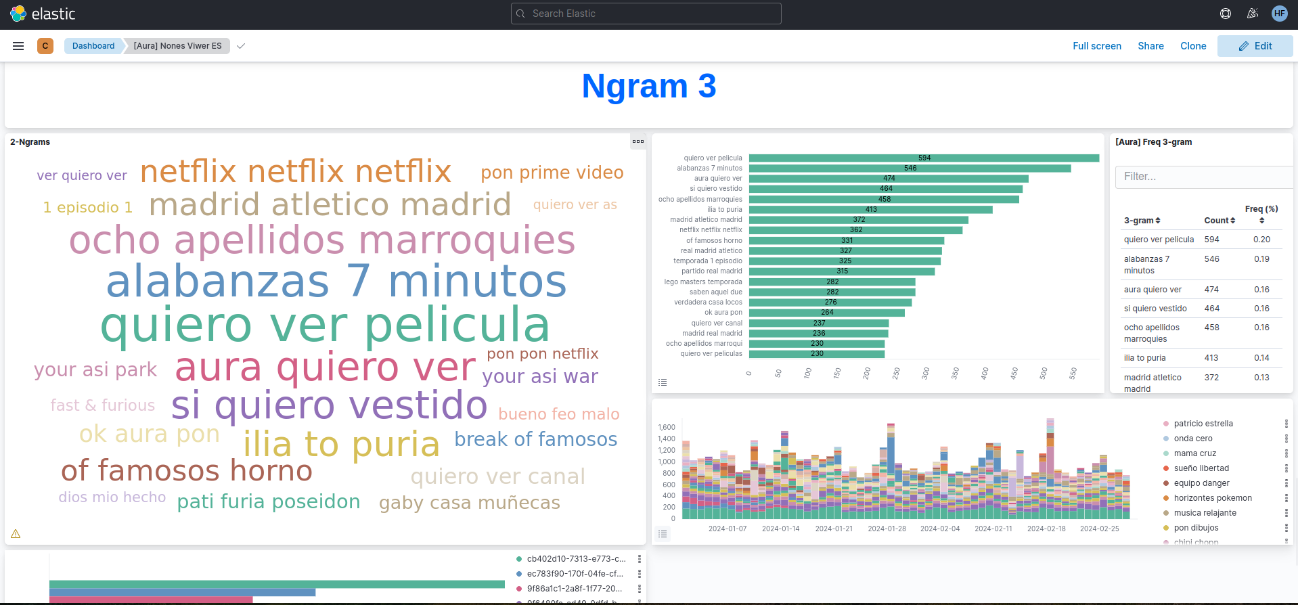 Figure 5. Nones dashboards
System dashboard
This dashboard integrates the three predefined “Stats” visualizations (generic statistics):
- A timeline of interactions (user messages sent and answered), segmented by channel
- A heatmap of interactions by weekday and time of day (hour)
- A bar graph classifying the interactions produced in the period by detected intent
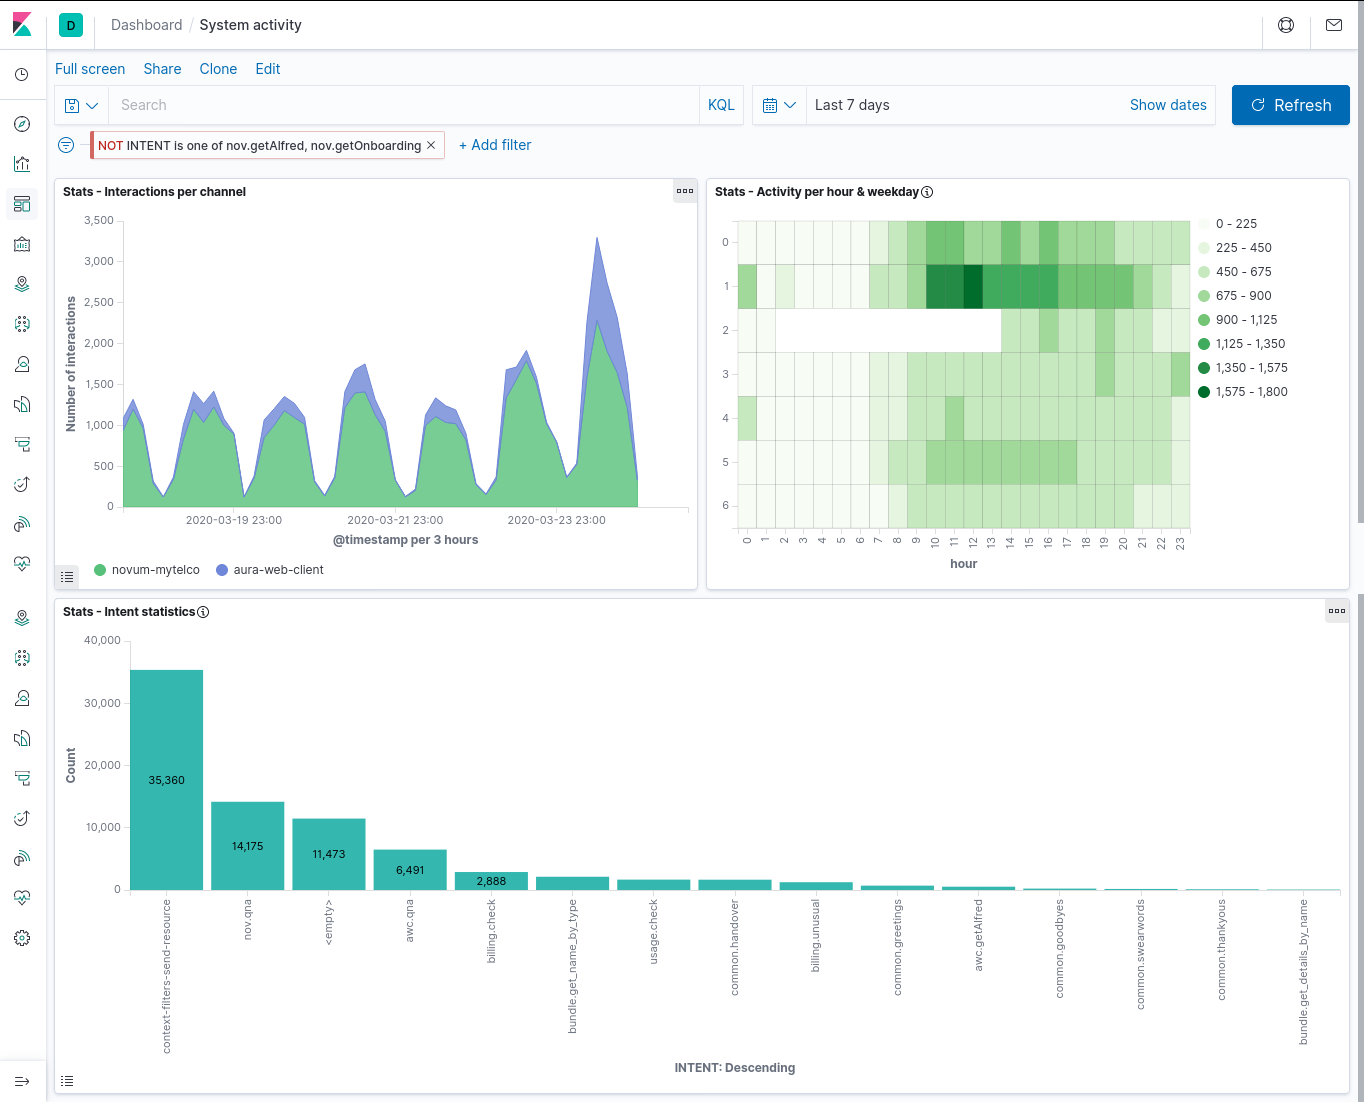 Figure 6. System dashboard
User Dashboard
The User dashboard contains 4 user visualizations:
- Most Frequent User Utterances: list of the most frequent user sentences (in the time interval and filter active
at the moment). It uses the
msgUsrSig field to group together very similar utterances.
- AURA Answer Groups: list of the most frequent answers that Aura generates, grouped by the semantic categories in
AuraMsgGroup field.
- Words per query: distribution of sizes for the user messages, measured as number of words in the utterance,
and segmented by channel.
- Tag cloud: set of plain most frequent user utterances, as a tag cloud in which the font size represents the
utterance frequency. The
MESSAGE_USR_NORM field is used for the representation, so it contains normalized
utterances.
The next screenshots show the dashboard with all these visualizations (it is a large dashboard, so typically it needs
scrolling to visualize all its components).
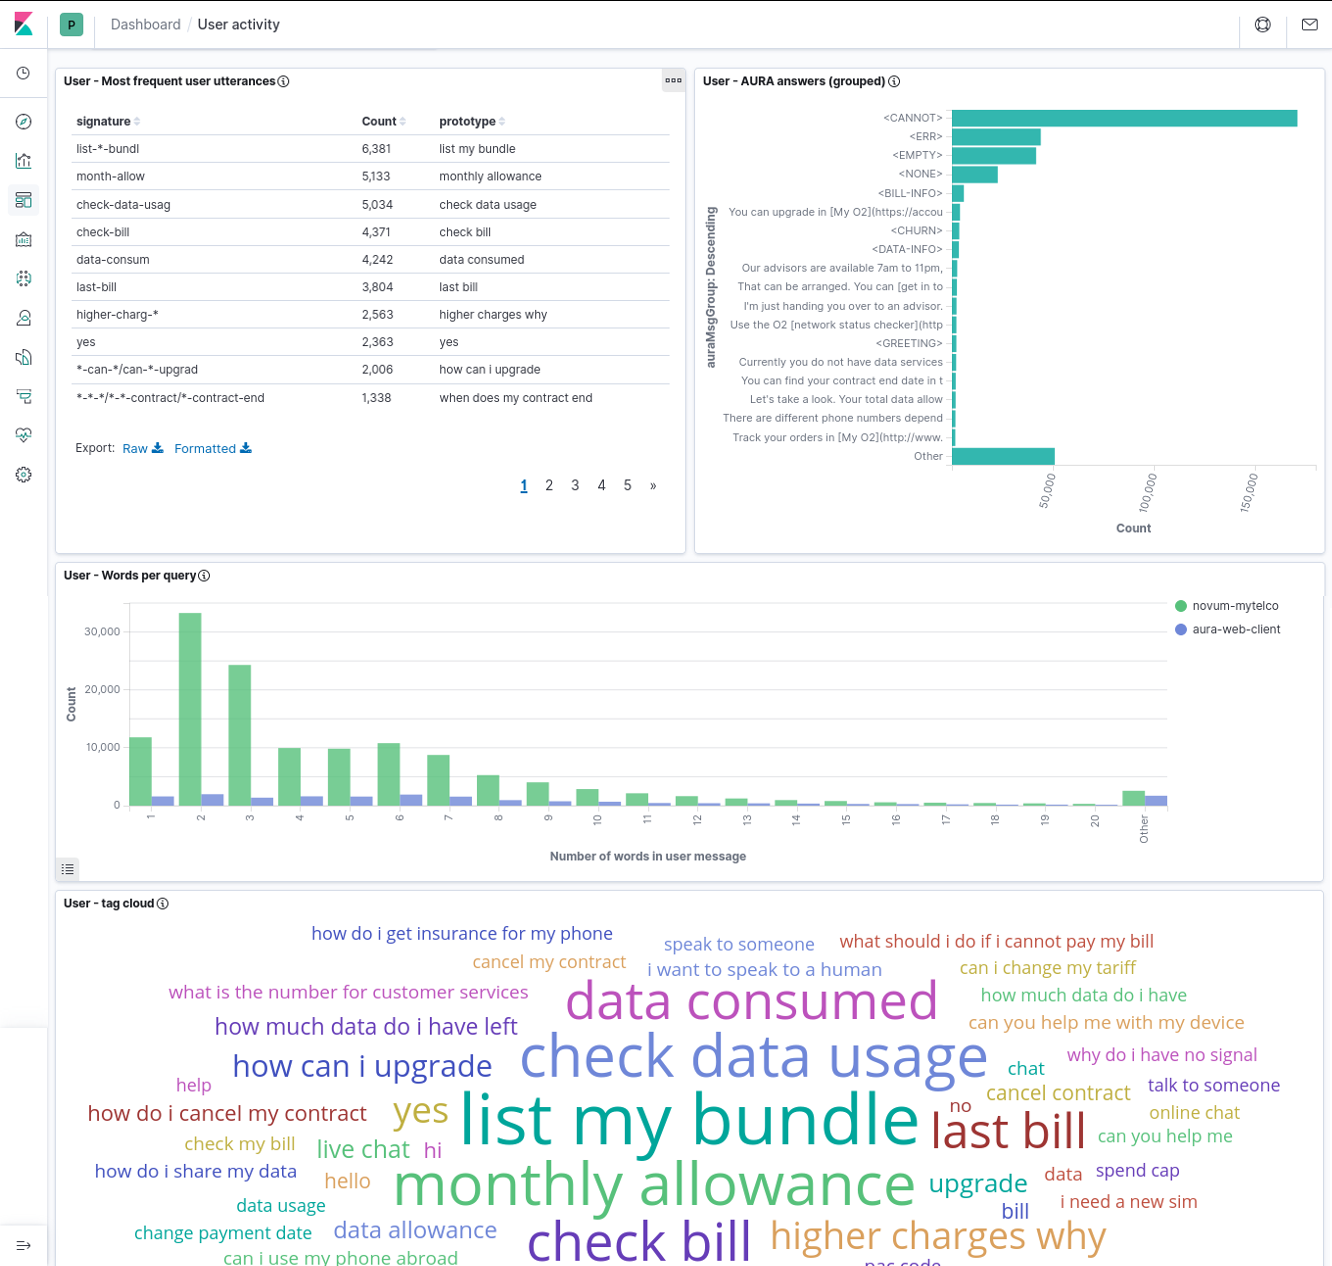 Figure 7. User dashboard
Note that those four visualizations are linked in the sense of corresponding to the same subset of the data (as given by filters and time interval) but they are NOT linked at the individual item level (i.e., a given most frequent user utterance in the left table does not correspond to any specific Aura answer in the right bar graph).
Instead, the dashboard can be manipulated by selecting one specific item in any of the visualizations, and this will
create a filter for the others.
For instance, as the following image shows, if we select “CHURN” in the Aura answer group visualization, we can observe in the
others the user utterances that led Aura to generate that answer (i.e., an answer about contract cancelation).
 Figure 8. Example of Aura answer groups in the user dashboard
Building new visualizations and dashboards
If the OB has installed locally the ELK stack, new elements can be built (or the current ones modified) by making use of the available fields in Kibana through the ingested ElasticSearch index.
In this section, we provide a reference of the schema that the index follows, so it can be used to build such new visualizations or to better understand the existing ones.
Data model
Field types
Elements in the Aura-message data model have 3 different types:
- Numeric: single numbers, integer or real. Suitable for numerical statistics, such as averages, or for plotting
variation across time in graphs.
- Keyword: they are opaque strings, i.e., terms that cannot be searched within (it is not possible to look for words
inside a keyword field). They can however be used to create some term-level queries, such as e.g., prefix queries
(find all instances that begin with) and they usually work great for aggregations, since most of them are categorical
variables (fields that only have a limited number of possible values) and can therefore be bucketed and counted.
- Text: these fields are divided into separate terms (words), and some pre-processing is done to them before
indexing,
to improve access, though an ElasticSearch analyzer. Text fields cannot be used in aggregated visualizations, since
they cannot be grouped. They are most useful for queries, because they allow searching for fragments (only a few
words) and fuzzy searches.
Field list
The following table lists all the available fields in the Aura-message-COUNTRY ElasticSearch index, with their type and a brief
description. Some of them have more detailed explanations in Section Field explanations.
Note that some fields of text type have a mirror field of type keyword, with the same content. Having the same data
indexed in two different ways at the same time (as text and as keyword) enables to perform different types of
analysis by choosing the right field.
The Raw column indicates if this field is already present in the AURA raw PPD files:
- Yes: it is a field contained in raw PPDs.
- No: it is a generated field, produced when creating clean PPDs. They can be recognized as lowercase fields.
- Partial: It exists in the raw PPDs, but in a somehow different shape.
| Field |
Type |
Raw |
Content |
| CORR_ID |
keyword |
yes |
Unique identifier for each interaction |
| VERSION_ID |
keyword |
yes |
Aura Platform version |
| CHANNEL_CD |
keyword |
yes |
Identifier for the channel this interaction corresponds to |
| STATUS_CD |
keyword |
yes |
Internal code related to operation status |
| AURA_ID_GLOBAL |
keyword |
yes |
(Mostly) unique identifier for the user |
| AURA_ID |
keyword |
yes |
(Mostly) local identifier for the user |
| INTENT |
keyword |
yes |
Detected user intent, including “system” intents |
| MESSAGE_USR |
text |
partial |
Text request sent by the user |
| MESSAGE_USR_NORM |
text |
no |
A normalized version of MESSAGE_USR |
| MESSAGE_USR_NORM.keyword |
keyword |
no |
A keyword version of MESSAGE_USR_NORM, to enable aggregating on it |
| MESSAGE_AURA |
text |
partial |
Text message sent by AURA to the user |
| MESSAGE_AURA.keyword |
partial |
partial |
Keyword version of MESSAGE_AURA, to enable aggregating on it |
| MODALITY_CD_USR |
text |
partial |
Modality of the user message |
| MODALITY_CD_AURA |
text |
partial |
Modality of Aura response |
| ENTITIES |
text |
yes |
Comma-separated list of the entities recognized in the user message |
| DIALOG_ID |
text |
yes |
Identifier for the dialog that produced Aura response |
| DIALOG_ID.keyword |
keyword |
yes |
Keyword version of DIALOG_ID, to enable aggregating on it |
| DURATION_NU |
number |
yes |
Elapsed time, in ms, between the reception of the user message and the moment the response is generated to be sent to the channel |
| userType |
keyword |
no |
A single char identifier that characterizes the user as a test user |
| usrMsgWc |
number |
no |
Message word count: number of words contained in the user message |
| usrMsgSig |
keyword |
no |
Message signature: a string that helps clustering user messages |
| AuraMsgGroup |
keyword |
no |
Cluster the Aura response belongs to |
| weekday |
number |
no |
Day of the week the interaction happened (0=Monday to 6=Sunday) |
| hour |
number |
no |
(integer) hour the interaction happened |
| country |
keyword |
partial |
Two-letter code for the country |
| sesId |
keyword |
no |
Session information |
| sesSize |
number |
no |
Session information |
| sesDuration |
number |
no |
Session information |
| EXPLICIT_FRUSTATION |
number |
no |
The frustration probability of message user |
| AllNGrams |
keyword |
no |
All n-grams of user message |
| AllNGramsFilter |
keyword |
no |
All n-grams filtered by stopwords |
| NGrams1 |
keyword |
no |
The n-grams of 1 word |
| NGrams1Filter |
keyword |
no |
The n-grams of 1 word filtered by stopwords |
| NGrams2 |
keyword |
no |
The n-grams of 2 words |
| NGrams3 |
keyword |
no |
The n-grams of 3 words |
Field explanations
This subsection contains more detailed descriptions of some of the fields in the schema.
AURA_ID_GLOBAL
This element (mostly) uniquely identifies the user generating the interaction.
Note the concrete value of this field is not the same as the current identifier used in Aura and uploaded to Kernel: for privacy reasons, the identifier was
hashed when generating the PPD and has no resemblance to the original one. The correspondence is however maintained
across time, so it is possible to analyze user behavior.
The “mostly” qualifier reflects one quirk of the original Aura identifier: it is generated with a dependence to the
authentication method used by the channel, so if two channels follow different authentication methods
(e.g., MobileConnect vs. User/Password) then the AURA_ID_GLOBAL identifier for the same user will be different.
In summary:
- The identifier stays the same for a given user across time.
- No two users will have the same identifier.
- But the same user could produce two different identifiers if it connects to two channels that use a different
authentication method.
AURA_ID
This is a “local” identifier, i.e., it is generated inside the channel according to the specific channel
characteristics, and it is not tied as much as AURA_ID_GLOBAL to user authentication.
Its main disadvantage is its transient nature: the same user, on the same channel, could generate different AURA_ID strings when connecting different times, on different session. Therefore, for user accounting and tracing, AURA_ID_GLOBAL is usually preferred.
However, there are instances in which AURA_ID works better, namely for anonymous access (when the user is not authenticated).
This depends on the channel:
- In the WhatsApp channel, the initial use of the channel will be anonymous from Aura side (i.e., no authentication is done), hence
AURA_ID_GLOBAL will also be empty (at least until the user authenticates, which depends on the use case). But in this channel, AURA_ID has a permanent value, linked to the WhatsApp user, so here it is a good substitute for a persistent id even for unauthenticated users.
MESSAGE_USR
This field includes the message sent by user1. It has been partially processed to enhance anonymization by removing
some standard identifiers contained in it with <idxxx> strings (e.g., phone numbers appear as <idphone>).
Removal is done mostly through regular expressions, so there might be occasional glitches (such as identifying as a phone number
that does not really correspond to a phone, just because it follows the phone number pattern).
MESSAGE_USR is a field of text type. As such, it is searchable: it is possible to search for specific words the user
might have said. Furthermore, it has been processed through an ElasticSearch analyzer adapted to the specific language
used. This means that searches will be able to match related words (e.g., plural versions of a singular query word, or
verb conjugations). Phrase searches are also possible (by using double quotes around the phrase).
In Kibana, more sophisticated text searches can be made by switching Lucene query syntax: proximity queries (words
close to each other), fuzzy searches (query words allowing typos), wildcards, etc
MESSAGE_USR_NORM
This is a normalized version of MESSAGE_USR, in which the user text has been streamlined by:
- Converting all the sentence to lowercase
- Removing all punctuation
- Removing any extra spaces
Furthermore, this field is not processed through a language-dependent analyzer, as MESSAGE_USR is, so queries on this
field must match words exactly. It is still a text field, however, so the same query language can be used.
MESSAGE_AURA
This contains the text message generated by Aura and sent to the user as response to the user query. It is a text
field, so it is possible to search for specific words in it.
IMPORTANT
In the current version of Aura KPI logs, this field contains only the text response.
Some Aura use cases do not generate a purely textual message, but a more elaborated one (e.g., a card with text and graphics). These complex answers are inserted as attachments into Aura’s response to the channel, and since attachments are not logged into the MESSAGE field, this field will appear empty in those cases.
So, an empty MESSAGE_AURA field does not necessarily mean that AURA did not provide an answer. As an alternative for those situations, looking at the DIALOG_ID field (or INTENT) may give a hint of the type of answer that Aura delivered.
MODALITY_CD_USR
This field contains the modality in which the user sent the message.
It is a slightly transformed field because there is some variation across Aura versions, and to unify the modalities are consolidated into only four different keywords: audio (spoken message), text (written free-text message) o form (commands sent via automatic processing or menus).
DIALOG_ID
This field contains the identifier for the user case dialog module at the Aura Bot Framework that was selected to
construct the Aura response.
Dialog identifiers have two components (library and dialog) separated by a colon e.g.,
services:service-usage.
This field uses a custom analyzer that splits the identifier at the colon, generating two terms. This makes possible to
construct queries with one of the terms, e.g., “give me all the elements for the domain services”). But being a text
field makes it impossible to do aggregations on it, so it cannot be used for statistics like bar charts
(use DIALOG_ID.keyword for that).
DURATION_NU
This number reflects the time that took Aura to understand, process and respond to the user message. It is the
difference (in milliseconds) between the timestamp of the moment the user message was received and the timestamp in which Aura’s
response was finalized and sent to the channel.
Note that it is not a complete end-to-end delay time from the user’s point of view, since it does not include either
the time it took the request to arrive to Aura through the channel or the time it took the response to travel back
through the channel and get rendered at the client application (those times are outside Aura, and as such not
registered by it).
These fields are generated by running a process over the time series formed by interactions from each user at each
channel. A session is automatically identified as a consecutive list of such user’s interactions, each separated from
the next by a time interval shorter than 5 minutes. Once each session is identified, it is tabulated and labelled with
three fields:
- sesId: a string, forming a unique identifier for the session. It should be considered an opaque identifier and the
guarantee is that no other session in the data stream carries the same identifier.
As an aside, interactions that do not correspond to actual user interactions (because no user could be identified, or
because the datapoint corresponds to an interaction not triggered by the user) are all labelled with a <void> sesId
-
sesSize: the number of interactions this session contains. This is labelled only for the first interaction in the
session, all other interactions carry a 0 in this field. Non-sessions such as the ones with sesId will be left
empty. This facilitates computing averages or other statistics on valid sessions, by just first filtering out all
zero and empty values
-
sesDuration: the time duration for each session, counted from the instant the first user message was received, to
the instant the last Aura message was sent. For single-interaction sessions its value will be the same as
DURATION_NU,
for multiple interactions it will contain the time interval between all of them.
As with sesSize, only the first interaction in a session is annotated with sesDuration; the remaining interactions will
be assigned a 0 value (and interactions that do not correspond to a session will be left empty). Therefore, to compute
statistics on sesDuration, remove the 0 and empty values first.
userType
This field may be used, in certain cases, to help identify rows that do not correspond to real users but to test users
(internal users that belong to test/QA teams, and whose behavior is therefore not representative of actual Aura users).
The field contains a single character, which is s for standard (real) users, and can be Q or T for QA/Test users
respectively (there are also lowercased versions q and t, which means unconfirmed test users).
Note that test user identification is not available on every country, since it depends on having a register of the
AURA_GLOBAL_ID identifiers that QA/Test users authenticate to, and this is not always available.
usrMsgSig
This field is not useful by itself. Instead, it is intended to be used to help grouping together very similar user
utterances. It does so by generating a signature of the utterance that is (hopefully) insensitive to small variations in
the sentence.
The way to generate this signature is by following these steps with the utterance:
- Start with the normalized utterance (i.e.,
MESSAGE_USR_NORM)
- Perform stemming (removal of word suffixes) on all the words. This makes bills and bill the same word
- Substitute words from a fixed list of very common, uninformative tokens (stopwords) by an asterisk. For example,
this converts both “get my bill” and “get the bill” to the same phrase
“get * bill”
- Group words in sets of 3 elements (trigrams), and sort them alphabetically. This removes the global structure of the
sentence, while retaining local structure.
The resulting string is a non-understandable version of the original utterance (hence it cannot be used by itself), but
the fact that several very similar utterances produce the same signature helps to cluster those utterances. An example
is one of the preinstalled visualizations, Most Frequent User Utterances, which uses this field to group very similar
utterances.
Another example is provided in the following figure, which shows message utterances generating the same signature:
 Figure 9. Message utterances generating the same signature
As it can be seen, the signature is the same for "how can I upgrade" and "when can I upgrade",
"when does my contract end" and "when is my contract ending", and "live chat" & "live chats". So, they would be counted
together when aggregating by signature.
The procedure has its limitations, and as explained is experimental, so we are trying to improve it, but it can already
alleviate a bit the inherent variability in user expressions.
AuraMsgGroup
Messages produced by Aura are as generated by its text resource database. In some cases, the same category of message
produces different output texts, maybe because the message includes some user-dependent parameter or because the text
database contains several variants of the same text (and Aura picks one at random).
The AuraMsgGroup field is a keyword field that helps categorizing Aura answer by abstracting away some of this
variation.
It classifies the response given by Aura into two types of elements:
- Generic group: a name such as
<NONE>, <GREETING> or <NOTFOUND>, which corresponds to a response category (see Table 3)
- Truncated answer: for answers that do not have a defined generic group, as a fallback the literal answer text is
inserted, after substituting all numbers in it with a placeholder and truncating it (i.e., retain only the first
characters)
Table 4 contains the generic groups defined so far. They correspond to the most frequent Aura messages.
It is country-dependent, since it also depends on the use cases deployed in each country. As said above, responses not
falling into these groups will be assigned a truncated version of the response text.
| Group |
Meaning |
<EMPTY> |
No textual answer from Aura |
<NONE> |
Aura says it did not understand the user utterance |
<ERR> |
There was a processing error of some kind at Aura side, and the request could not be fulfilled |
<GREETING> |
Aura is greeting the user |
<GOODBYE> |
Aura is acknowledging a conversation end |
<YOU-ARE-WELCOME> |
Aura is accepting a compliment |
<CHURN> |
Aura recognizes the user intention to terminate a contract |
<NOTFOUND> |
Aura tried to search for some bit of data concerning the user query, and could not find it |
<CANNOT> |
Aura cannot fulfil the user request because of insufficient information (in the query, or on user data) |
<BILL-INFO> |
The user requested information about her bill, and Aura is returning it |
<DATA-INFO> |
The user requested information about her data usage, and Aura is returning it |
EXPLICIT_FRUSTRATION
The sentiment model generates explicit frustration regarding the user’s message. In this field, the probability indicates
that a user’s sentence is an explicit expression of frustration.
AllNGrams
For intents none and tv.none, an extraction of the most common n-grams generated by these none responses is applied. In these fields n-grams for 1 word, 2 words and 3 words are represented.
AllNGramsFilter
This field represents the AllNGrams field but filtered by stopwords.
NGrams1
This field represents the n-grams for 1 word.
NGrams1Filter
This field represents the n-grams for 1 word filtered by stopwords.
NGrams2
This field represents the n-grams for 2 words.
NGrams3
This field represents the n-grams for 3 words.
2.5 - Annex: Dataset fields
Annex: Dataset fields detail
The current annex describes the process that each field of Aura Analytics 2.0.0 data model is going through towards a clean PPD
Introduction
The objective of the following tables is to explain the process that each field is going through within this flow:
| Aura datasets |
>>> |
PPD_RAW |
>>> |
PPD_CLEAN |
-
Each cell of the table explains the process that the data field is undergoing in this specific moment before it gets
to the concrete stage (table column).
-
For example, the field GLOBAL_AURA_ID is undergoing a “hashing” before it gets stored in PPD_RAW. After this,
the “hashed data” is progressed without any further processing to PPD_CLEAN.
Tables used in the Active Listening process are described in the following sections. They belong to the Aura Entities
database.
MESSAGE dataset
Message dataset (stored in local Kernel).
| # |
FIELD |
DESCRIPTION |
PPD RAW |
PPD CLEAN |
| 1 |
USER_ID |
Unique user ID in the OB systems |
NOT
transferred |
NOT
transferred |
| 2 |
MSG_DT |
Timestamp of the data |
|
|
| 3 |
MSG_ID |
Unique ID of the message |
|
NOT
transferred |
| 4 |
ACTION_CD |
Code of the action that produces the data |
|
NOT
transferred |
| 5 |
AURA_ID |
User logging ID in Aura. The user will have a new Aura_id each time she logs in Aura. |
Hashed |
|
| 6 |
PHONE_ID |
Phone number of the user |
NOT
transferred |
NOT
transferred |
| 7 |
CHANNEL_CD |
Code of the channel where the action happened |
|
|
| 8 |
SUBSCRIPTION_CD |
Code of the subscription type of the user in the OB |
|
NOT
transferred |
| 9 |
DOMAIN_CD |
Code of the domain where the action happened |
|
NOT
transferred |
| 10 |
CATEGORY_CD |
Code of the category where the action happened |
|
NOT
transferred |
| 11 |
COUNTRY_CD |
Code of the country |
|
NOT
transferred |
| 12 |
CORR_ID |
Correlator ID of the request that produces this data |
|
|
| 13 |
IS_CACHED |
Shows if the entity content was already cached or not |
|
NOT
transferred |
| 14 |
STATUS_CD |
Status code of the action, if meaningful |
|
|
| 15 |
REASON |
Result of the action in error case, code of the error |
|
NOT
transferred |
| 16 |
VERSION_ID |
Aura version that produces this data |
|
|
| 17 |
LANG_CD |
Language configured by the user for communication |
|
NOT
transferred |
| 18 |
TZ_CD |
Timezone where the communication happened |
|
NOT
transferred |
| 19 |
DURATION_NU |
Duration in milliseconds of the action |
|
|
| 20 |
MESSAGE |
Content of the message |
Anonymized |
|
| 21 |
DIALOG_ID |
Id of the dialog where the message happens |
|
|
| 22 |
CONVERSATION_ID |
Id of the conversation where the message happens |
|
NOT
transferred |
| 23 |
WIN_RECOGNIZER_CD |
Code of the recognizer that wins for this message |
|
NOT
transferred |
| 24 |
WIN_RECOGNIZER_SCORE_NU |
Score of the recognizer that wins for this message |
|
NOT
transferred |
| 25 |
INTENT |
Selected intent |
|
|
| 26 |
ENTITIES |
List of entities determined by the recognizer |
|
|
| 27 |
MODALITY_CD |
How does the user communicate with Aura |
|
|
| 28 |
AURA_ID_GLOBAL |
Identifies the same user_id logged with the same authentication method |
Hashed |
|
| 29 |
ACCOUNT_NUMBER |
Unique account number of the user |
NOT
transferred |
NOT
transferred |
GROOTMESSAGE dataset
Groot Message dataset (stored in local Kernel).
| # |
FIELD |
DESCRIPTION |
PPD RAW |
PPD CLEAN |
| 1 |
USER_ID |
Unique user ID in the OB systems |
NOT
transferred |
NOT
transferred |
| 2 |
MSG_DT |
Timestamp of the data |
|
|
| 3 |
MSG_ID |
Unique ID of the message |
|
NOT
transferred |
| 4 |
ACTION_CD |
Code of the action that produces the data |
|
NOT
transferred |
| 5 |
AURA_ID |
User logging ID in Aura. The user will have a new Aura_id each time she logs in Aura. |
Hashed |
|
| 6 |
PHONE_ID |
Phone number of the user |
NOT
transferred |
NOT
transferred |
| 7 |
CHANNEL_CD |
Code of the channel where the action happened |
|
|
| 8 |
DOMAIN_CD |
Code of the domain where the action happened |
|
NOT
transferred |
| 9 |
CATEGORY_CD |
Code of the category where the action happened |
|
NOT
transferred |
| 10 |
COUNTRY_CD |
Code of the country |
|
NOT
transferred |
| 11 |
CORR_ID |
Correlator ID of the request that produces this data |
|
|
| 12 |
IS_CACHED |
Shows if the entity content was already cached or not |
|
NOT
transferred |
| 13 |
STATUS_CD |
Status code of the action, if meaningful |
|
|
| 14 |
REASON |
Result of the action in error case, code of the error |
|
NOT
transferred |
| 15 |
VERSION_ID |
Aura version that produces this data |
|
|
| 16 |
LANG_CD |
Language configured by the user for communication |
|
NOT
transferred |
| 17 |
TZ_CD |
Timezone where the communication happened |
|
NOT
transferred |
| 18 |
DURATION_NU |
Duration in milliseconds of the action |
|
|
| 19 |
MESSAGE |
Content of the message |
Anonymized |
|
| 20 |
CHANNEL_CONVERSATION_CD |
Id of the channel conversation where the message happens |
|
NOT
transferred |
| 21 |
SKILL_CONVERSATION_CD |
Id of the skill conversation |
|
NOT
transferred |
| 22 |
WIN_RECOGNIZER_CD |
Code of the recognizer that wins for this message |
|
NOT
transferred |
| 23 |
WIN_RECOGNIZER_SCORE_NU |
Score of the recognizer that wins for this message |
|
NOT
transferred |
| 24 |
AURA_ID_GLOBAL |
Identifies the same user_id logged with the same authentication method |
Hashed |
|
| 25 |
ACCOUNT_NUMBER |
Unique account number of the user |
NOT
transferred |
NOT
transferred |
| 26 |
SKILL_CD |
Unique id of skill |
|
|
RECOGNIZER dataset
Recognizer dataset stored in local Kernel.
| # |
FIELD |
DESCRIPTION |
PPD RAW |
PPD CLEAN |
| 1 |
USER_ID |
Unique user ID in the OB systems |
NOT
transferred |
NOT
transferred |
| 2 |
RECOGNIZER_DT |
Timestamp of the data |
|
|
| 3 |
RECOGNIZER_ID |
Unique ID of the recognizer |
|
|
| 4 |
ACTION_CD |
Code of the action that produces the data |
|
NOT
transferred |
| 5 |
AURA_ID |
User logging ID in Aura. The user will have a new Aura_id each time she logs in Aura. |
Hashed |
|
| 6 |
PHONE_ID |
Phone number of the user |
NOT
transferred |
NOT
transferred |
| 7 |
CHANNEL_CD |
Code of the channel where the action happened |
|
|
| 8 |
DOMAIN_CD |
Code of the domain where the action happened |
|
NOT
transferred |
| 9 |
CATEGORY_CD |
Code of the category where the action happened |
|
NOT
transferred |
| 10 |
COUNTRY_CD |
Code of the country |
|
NOT
transferred |
| 11 |
CORR_ID |
Correlator ID of the request that produces this data |
|
|
| 12 |
IS_CACHED |
Shows if the entity content was already cached or not |
|
NOT
transferred |
| 13 |
STATUS_CD |
Status code of the action, if meaningful |
|
|
| 14 |
REASON |
Result of the action in error case, code of the error |
|
|
| 15 |
VERSION_ID |
Aura version that produces this data |
|
|
| 16 |
LANG_CD |
Language configured by the user for communication |
|
NOT
transferred |
| 17 |
TZ_CD |
Timezone where the communication happened |
|
NOT
transferred |
| 18 |
DURATION_NU |
Duration in milliseconds of the action |
|
|
| 19 |
SCORE_NU |
Score returned by the recognizer |
|
|
| 20 |
INPUT |
User input sent to the recognizer. Null if incoming message is an AuraCommand |
Anonymized |
|
| 21 |
OUTPUT |
Complete output generated by the recognizer |
|
|
| 22 |
INTENT |
Intent returned by the recognizer |
|
|
| 23 |
ENTITIES |
Entities returned by the recognizer due to the intent |
|
|
| 24 |
COMMON_THRESHOLD_NU |
Common threshold used to determine the best answer of all recognizers |
|
NOT
transferred |
| 25 |
THRESHOLD |
Specific threshold of the specific recognizer being executed |
|
NOT
transferred |
| 26 |
EXPECTED_INTENT |
Intent expected to be returned by the recognizer |
|
NOT
transferred |
| 27 |
EXPECTED_ENTITIES |
Entities expected to be returned by the recognizer due to the intent |
|
NOT
transferred |
| 28 |
AURA_ID_GLOBAL |
Identifies the same user_id logged with the same authentication method |
Hashed |
|
| 29 |
ACCOUNT_NUMBER |
Unique account number of the user |
NOT
transferred |
NOT
transferred |
This Markdown table can be directly used in your GitHub Markdown files.
API dataset
API request dataset (stored in local Kernel).
| # |
FIELD |
DESCRIPTION |
PPD RAW |
PPD CLEAN |
| 1 |
USER_ID |
Unique user ID in the OB systems |
NOT
transferred |
NOT
transferred |
| 2 |
REQUEST_DT |
Timestamp of the data |
|
|
| 3 |
REQUEST_ID |
Unique ID of the request |
|
|
| 4 |
ACTION_CD |
Code of the action that produces the data |
|
NOT
transferred |
| 5 |
AURA_ID |
User logging ID in Aura. The user will have a new Aura_id each time she logs in Aura |
Hashed |
NOT
transferred |
| 6 |
PHONE_ID |
Phone number of the user |
NOT
transferred |
NOT
transferred |
| 7 |
CHANNEL_CD |
Code of the channel where the action happened |
|
NOT
transferred |
| 8 |
DOMAIN_CD |
Code of the domain where the action happened |
|
NOT
transferred |
| 9 |
CATEGORY_CD |
Code of the category where the action happened |
|
NOT
transferred |
| 10 |
COUNTRY_CD |
Code of the country |
|
NOT
transferred |
| 11 |
CORR_ID |
Correlator ID of the request that produces this data |
|
|
| 12 |
IS_CACHED |
Shows if the entity content was already cached or not |
NOT
transferred |
NOT
transferred |
| 13 |
STATUS_CD |
Status code of the API request |
|
|
| 14 |
REASON |
Result of the action in error case, code of the error |
|
|
| 15 |
VERSION_ID |
Aura version that produces this data |
|
NOT
transferred |
| 16 |
LANG_CD |
Language configured by the user for communication |
|
NOT
transferred |
| 17 |
TZ_CD |
Timezone where the communication happened |
|
NOT
transferred |
| 18 |
DURATION_NU |
Duration in milliseconds of the action |
|
|
| 19 |
HOST |
Host of the API |
|
|
| 20 |
PATH |
Specific path of the API being called |
|
NOT
transferred |
| 21 |
HTTP_STATUS |
HTTP status of the server response |
|
NOT
transferred |
| 22 |
RESPONSE |
Response body |
Anonymized |
|
| 23 |
AURA_ID_GLOBAL |
Identifies the same user_id logged with the same authentication method |
Hashed |
NOT
transferred |
| 24 |
ACCOUNT_NUMBER |
Unique account number of the user |
NOT
transferred |
NOT
transferred |
| 25 |
REQUEST |
Request body |
|
|
3 - Aura Billing Module
Aura Billing Module
Description of Aura Billing Module, the tool for the generation of Liceo invoices.
Introduction
The Aura Billing Module is a tool for the generation of Liceo invoices, that allow charging each customer for the services that she has used. This is a mandatory process for OBs.
It is based on the storage and processing of specific logs in the OB’s Aura systems to track the type and number of interactions of a user or service with Aura.
This information is used to assign costs based on different billing models and criteria chosen by the OB, which ultimately determines the total amount of the invoice.
The invoices will be generated in XLSX (Excel) format and stored in an Azure Storage Explorer blob container, along with the historical invoice records.
These invoices will be available for download by the Aura Global Team, to be sent to the OBs.
Interested in how the Aura Billing Module works and which are the tasks required to bring it into use? Access the document Aura Billing Module operation.
Generated Liceo invoices
The Liceo invoices generated by Aura Billing Module will contain the following information:
- Invoicing model (based on the payment model of the OB)
- Aura components used to provide the service
- Service/app that used this component
- Number of queries per component
- Cost of each query in each specific component
- Total amount generated by each component
- Total number of requests made during the billing period
- Total amount of the invoice
3.1 - Aura Billing Module operation
Aura Billing Module operation
This document contains:
- An overview of Aura Billing Module functional operation
- Tasks to be executed by OBs to bring Aura Billing Module into use
Aura Billing Module operational flowchart
Figure 1 schematically shows how Aura Billing Module operates, where three different instances come into play:
- Aura: OB managed environment
- Aura: Global Team managed environment
- Kernel
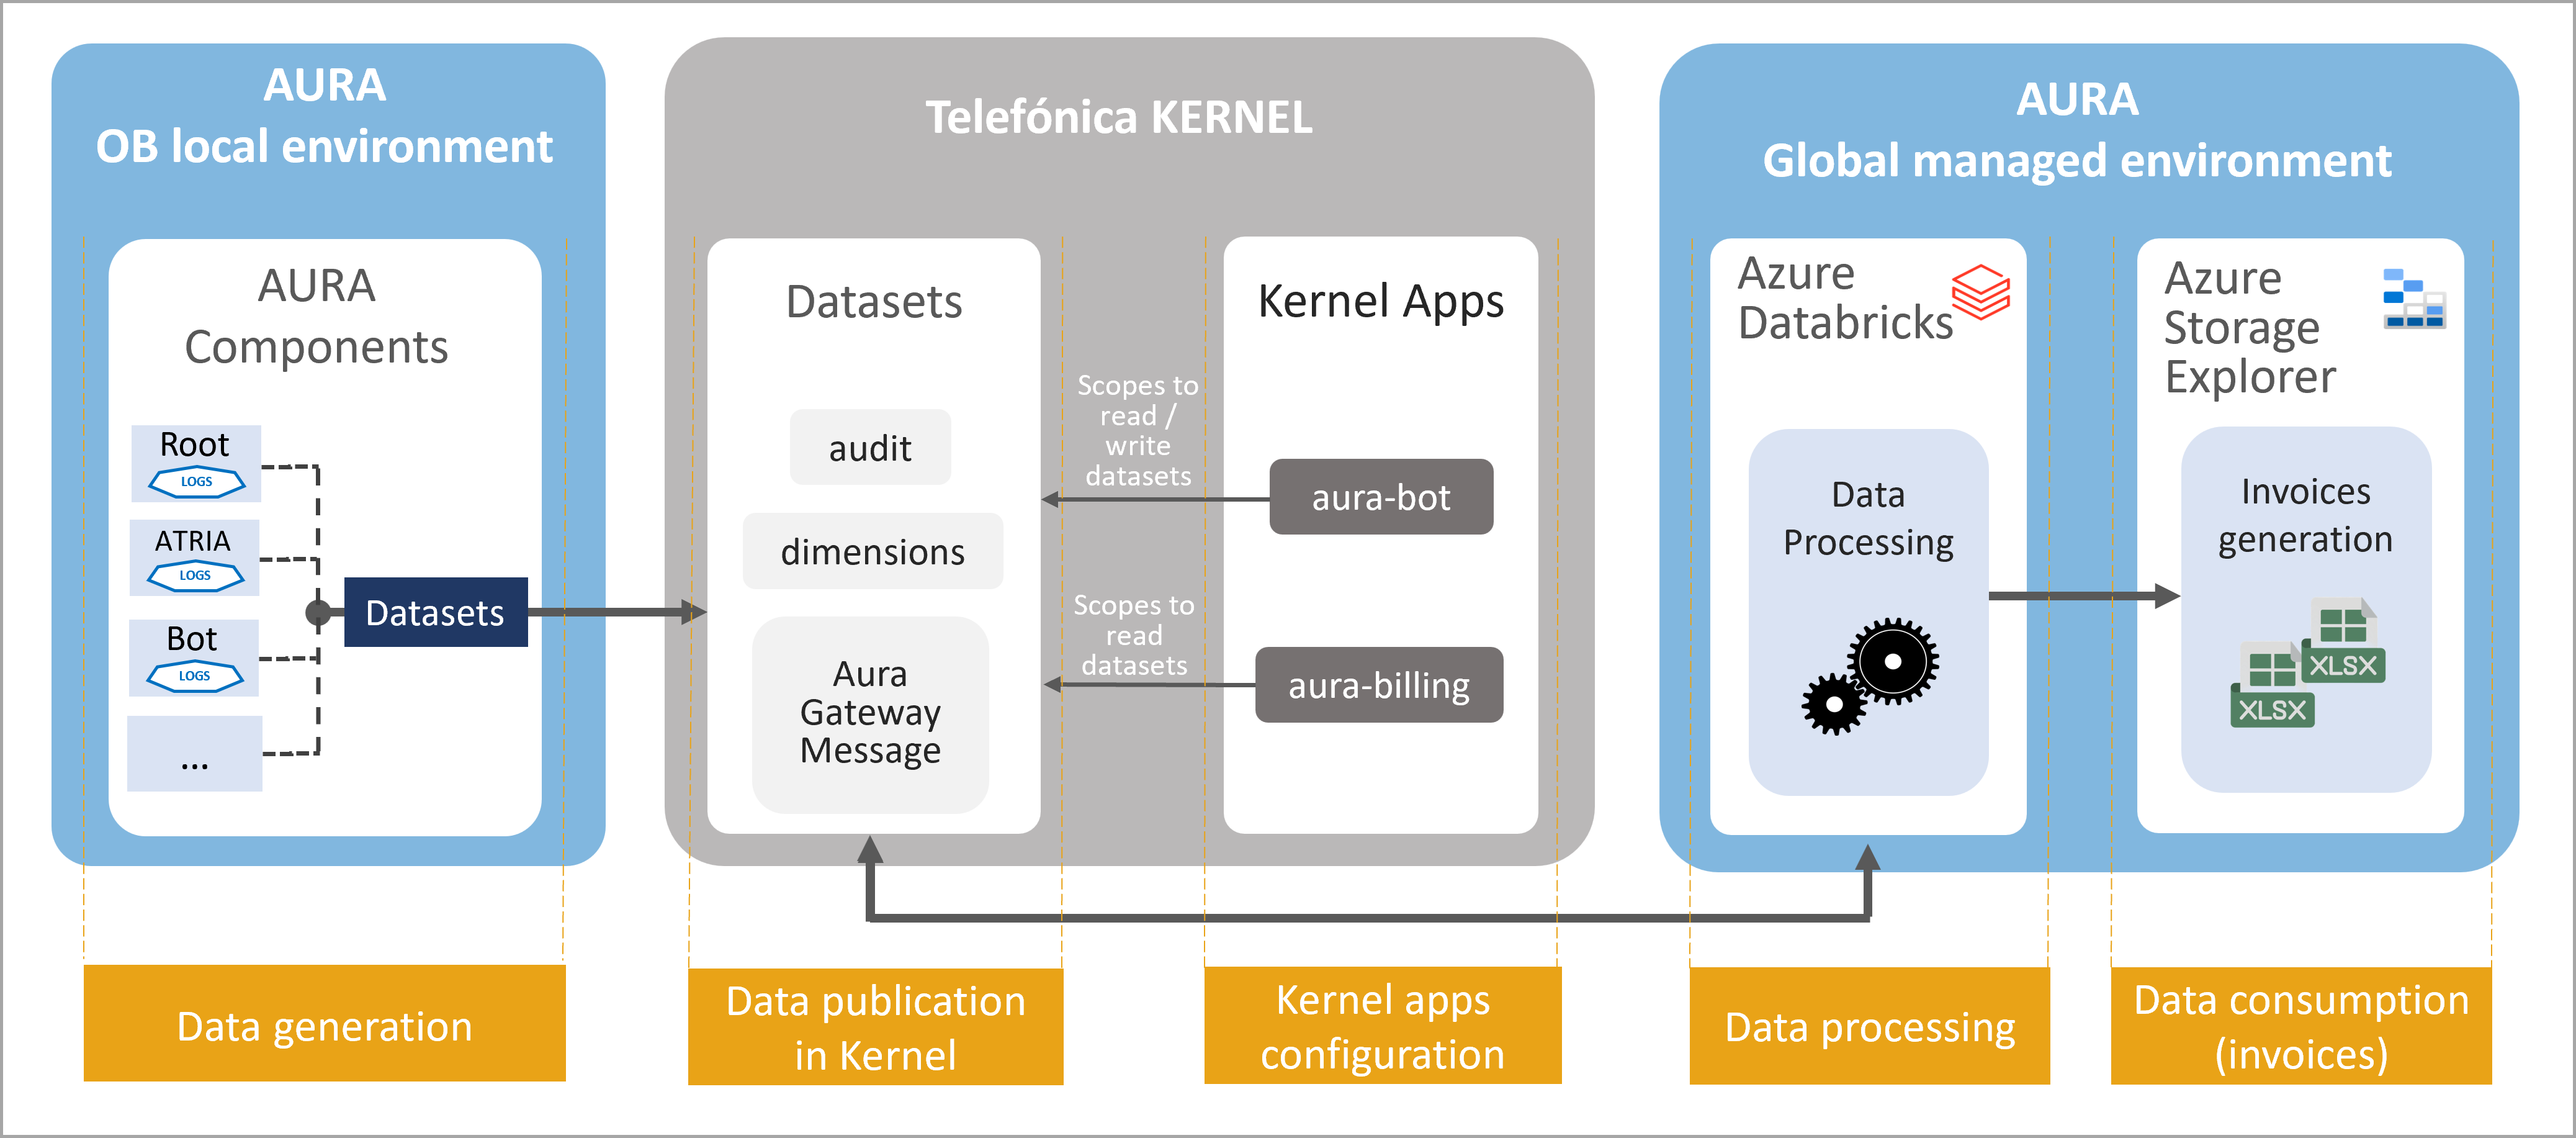
Figure 1. Aura Billing Module operation
The operational processes executed by the Aura Billing Module are outlined below. In each step, the tasks that must be carried out by the OBs in order to bring it into use, are described.
1. Data generation
This task takes place in Aura’s OB managed environment.
-
Aura components automatically generate logs every time a user/service interacts with Aura in local environment.
-
These logs are pre-processed, cleaned and converted into datasets, in Avro format.
-
These are the required Avro-formatted datasets for the Aura Billing Module:
-
Aura_Audit, that stores the minimum information needed for generating the Liceo invoices.
-
Aura dimensional entities:
- D_Aura_App schema definition: List of possible Apps defined in Aura.
- D_Aura_Channel: List of possible channels defined in Aura.
- D_Aura_Component: List of possible components defined in Aura.
- D_Aura_Preset: List of possible presets defined in Aura.
- D_Aura_Recognizer: List of possible recognizers defined by Aura.
- D_Aura_Skill: List of possible skills defined in Aura.
-
Aura Gateway Message: summary of Aura interactions handled by aura-gateway-api.
2. Data publication in Kernel
- The latest versions of the previous Avro-formatted datasets must be published into Kernel productive environment by the Kernel team.
2.1. Ask the Kernel Team to publish the datasets in Kernel productive environment with the latest version.
2.2. When correctly published, you can check them in the repository: 4p-datasets
3. Kernel apps configuration to write/read datasets
-
Two Kernel applications (clients) must be created/configured by the Kernel team to allow the use of Kernel resources:
- aura-bot-[environment]: already existing app in Kernel
- aura-billing-[environment]: new application
-
Specifically, the applications must be configured with concrete scopes that provide permissions to write/read the datasets.
-
The obligation to indicate the exact version in the configuration is removed. Therefore, in the following deployments, the version number indicated in the scope will be eliminated. For example, the configuration of the Brazil OB will have to be updated when a new scope change is made. For example: data:Aura_Audit:6:read —> data:Aura_Audit:read.
3.1. Configure aura-bot Kernel application to write datasets
Ask the Kernel Team to create a list of scopes in the aura-bot application for your intended environment.
- admin:datasets:read
- data:read
- data:write
- data:Aura_Audit:read
- data:Aura_Audit:write
- data:Aura_Gateway_Message:read
- data:Aura_Gateway_Message:write
- data:D_Aura_App:read
- data:D_Aura_App:write
- data:D_Aura_Channel:read
- data:D_Aura_Channel:write
- data:D_Aura_Component:read
- data:D_Aura_Component:write
- data:D_Aura_Preset:read
- data:D_Aura_Preset:write
- data:D_Aura_Recognizer:read
- data:D_Aura_Recognizer:write
- data:D_Aura_Skill:read
- data:D_Aura_Skill:write
- data:D_Gbl_Brand:read
- data:D_Gbl_Contact_Channel:read
- data:D_Gbl_Country:read
The scopes are associated with a specific version of the dataset, that will increase and vary with time.
3.2. Create a new app for Aura Billing Module and configure it to write datasets
Ask the Kernel Team to create a new application aura-billing in Kernel for your intended environment
Ask the Kernel Team to create a purpose for this application. For instance, aura-kpi-data-read-purpose
Ask the Kernel Team to assign to this purpose the following scopes:
- admin:datasets:read
- data:read
- data:write
- data:Aura_Audit:read
- data:Aura_Gateway_Message:read
- data:D_Aura_App:read
- data:D_Aura_Channel:read
- data:D_Aura_Component:read
- data:D_Aura_Preset:read
- data:D_Aura_Recognizer:read
- data:D_Aura_Skill:read
- data:D_Gbl_Brand:read
- data:D_Gbl_Contact_Channel:read
- data:D_Gbl_Country:read
3.3. Access the Kernel applications
Once the Kernel team has created the app with the above-mentioned purposes and scopes, two parameters for securely accessing the app will be provided:
- client_id: unique identifier of the consuming app acting as Kernel API client.
- client_secret: password.
This allows Kernel to securely identify, authenticate and authorize any access requested from this app.
4. Data processing
Data processing is executed with Azure Databricks.
In this process, the information from the Kernel datasets is recovered and read by the Aura Billing Module, that uses algorithms to assign a unitary cost to each concept that composes the invoice to calculate the total amount of this invoice.
4.1. Enable Aura components
Check that Aura KPIs Uploader, the component in charge of the management of KPIs entities and KPIs dimensions in Aura, is in use.
Check that Aura Databricks Jobs, component used to import Avro-formatted files into a Kernel dataset, is enabled in Aura installer.
Configure Azure Common:
- To avoid data files migrations between releases, KPI files are now stored in an Azure common storage that is not release dependent.
- The default value of days for KPIs uploading is changed to 30 days. Due to that, the variable fourth_platform.conversations.days_to_find must be removed from OB deployments, because it will be configured by the installer.
5. Data consumption
This step refers to the generation of the Liceo invoices and its storage in Azure Storage Explorer in xlsx format.
These invoices will be available for download by the Aura Global Team, to be sent to the OBs.
4 - Manage Aura logs
Manage Aura logs
Learn what are Aura logs and how they are managed in Kibana and other tools
Introduction
Logs are files that record specific single events, warnings and errors as they occur within a software environment. They can include contextual information, such as the time an event occurred and which user or endpoint was associated with it.
In Aura, logs are generated by specific components when an event happens and stored in order to monitor or debug the system.
Logs are stored in an ElasticSearch cluster.
Once stored, Aura integrates a logging system based on Kibana, which is the official tool to manage logs in Aura. Moreover, logs can be managed with Grafana and fluentd for specific features.
⚠️ You should not integrate third-party applications or scripts with ElasticSearch. These kinds of integrations are weak because the ElasticSearch API is not part of the public interface with the OB. This means that it could change without notice for several reasons such as updating the version of ElasticSearch or changing Aura internal architecture.
Manage logs in Kibana
The official Kibana User Guide is the reference guide to use Kibana.
Moreover, the current section includes certain useful points for managing Aura logs through this tool.
Policies in Kibana
Kibana includes index lifecycle policies.
By default, we add one policy for each index created (service and system index), to delete the logs older than seven days.
Snapshot in Kibana
Index snapshot is configured by default as long-term storage for the logs. These snapshots are taken daily and end in the cluster Azure Storage blob container (aura-backups/elk).
Manage logs in Grafana
Discover section
The “Discover” section in Grafana is very useful to look for logs and troubleshoot issues.
You can full-text search logs using Lucene query syntax.
Moreover, logs are tagged with many fields that can be useful to narrow down a search, such as:
- kubernetes.labels.app: name of the Kubernetes application that generated the log.
- kubernetes.pod_name: name of the Kubernetes pod that generated the log.
- corr: correlator that tracks E2E requests.
- lvl: log level (
TRACE, DEBUG, INFO, WARN, ERROR or FATAL).
Queries that rely on a specific text are weak. Aura cannot guarantee that log messages do not change between versions. In fact, they do change. This is why metrics based on logs will not be reliable and it is not recommended to use Kibana to get metrics.
Manage logs in fluentd
Logs external forwarding feature
It is possible to send logs to an external system (a fluentd endpoint).
To enable this feature, add the following configuration to your config file:
external_forwarding:
  secret_shared_key: "mysecretkey"
  tls_config:
    tls_enabled: True
  remote_servers:
  - hostname: xxx
    port: yyy
- Set
hostname and port fields with the remote endpoint. If you configure more than one remote server, fluentd load balances the traffic to them in a round-robin order.
- The
hostname value can be an IP address, but it is not recommended if TLS is enabled. Turning off TLS is possible but discouraged for security reasons.
secret_shared_key is used to verify client’s identity and must be configured properly in all the remote servers.
You can find additional information regarding receivers’ configuration (including TLS configuration and password authentication procedure) here.
5 - Manage metrics
Manage Aura metrics
Learn what are Aura metrics, how they are generated and stored in Prometheus and the process for its analysis through Grafana
Introduction
Metrics provide a measurement of certain data that represent a specific aspect of the monitored system at a point in time and offer an aggregated view over the system. They are useful to visualize long-term trends and alerts on log data.
Each Aura component is in charge of publishing its own metrics, which are typically generated at fixed-time intervals from aggregated logs.
Once generated, Aura metrics are pooled by Prometheus, which is in charge of gathering and exposing them.
Grafana is the most suitable tool to represent metrics through different dashboards. Each component counts on a Grafana dashboard to show its current behavior and there is a single dashboard for an Aura overview.
If you think a new metric could useful, please contact the Aura Platform Team, so it can be officially included as part of the platform.
The aim of this section is to explain both how Aura metrics work and all the metrics stored by each component.
⚠️ Saved dashboards, visualizations and queries are not guaranteed to be kept between upgrades because all the stack, including ElasticSearch and Grafana can be upgraded to newer versions.
Prometheus
Aura metrics system is based on Prometheus, a Cloud Native Computing Foundation project that works as systems and services monitoring system. Prometheus collects metrics from configured targets at given intervals, evaluates rule expressions, displays the results, and can trigger alerts when specified conditions are observed.
prom-client is being used to implement prometheus functionality in Node.js.
Prometheus service pools every component to get the metrics generated during the last time period. Every component counts on a private endpoint (not accessible from Internet) called /metrics where Prometheus requests the metrics.
Currently, the metric types used in this component are:
-
Summary: similar to histogram metrics, it includes samples observations (such as request durations and response sizes). While it also provides a total count of observations and a sum of all observed values, it calculates configurable quantiles over a sliding time window.
-
Counter: cumulative metric that represents a single monotonically increasing counter whose value can only increase or be reset to zero on restart. For example, you can use a counter to represent the number of requests served, tasks completed, or errors.
-
Gauge: similar to Counter, but it represents a single numerical value that can arbitrarily go up and down.
Prometheus-es-exporter
Working with Prometheus, we can create metrics using queries to ElasticSearch indexes (as well as create alarms, dashboard, etc) using prometheus-es-exporter.
This component is not deployed by default, but it can be enabled changing the variable prometheus_es_exporter_enabled to true in you config.yml file. (In Brazil, it is set to true by default). Access here the guidelines to enable prometheus-es-exporter component.
To config your own metrics from queries, write the new section, as in the following example, in your config.yml.
prometheus_es_exporter:
  query_blocks:
    ob:
      - name: "query_ob_br"
        QueryIntervalSecs: "60"
        QueryJson: '{"size":0,"query":{"bool":{"must":[],"filter":[{"bool":{"filter":[{"bool":{"should":[{"match_phrase":{"msg":"[AzureEventHub] emit"}}],"minimum_should_match":1}},{"bool":{"should":[{"match_phrase":{"kubernetes.labels.app":"aura-bot"}}],"minimum_should_match":1}}]}},{"range":{"@timestamp":{"gte":"now-1m","lte":"now"}}}]}}}'
        QueryIndices: "aurak8s-service-*"
Where:
name: Mandatory. Name of the query. It must start with query_*QueryIntervalSecs: Optional. It indicates how often to run queries in seconds. By default, 60.QueryJson: Mandatory. The search query to run.QueryIndices: Optional. Indices to run the query on. Any way of specifying indices supported by your ElasticSearch version can be used. By default, _all. Although this field is optional, it is highly recommended to delimit the search query.
Aura components metrics
The main Aura components can generate their own metrics.
Select your intended component in the left menu and access to its details.
5.1 - Aura Bot metrics
Aura Bot metrics
List of metrics available in Aura Bot
http_request_duration_seconds
This metric is intended to store the information related to all the incoming HTTP requests received by aura-bot.
It is stored as a Summary in Prometheus. So every sample, besides the defined labels, also includes its duration.
It measures the duration since the request lands in aura-bot until its HTTP response is returned, indicating to the client that Aura is processing the request to obtain a proper answer for the user.
The metric allows measuring the behavior of the requests from any given endpoint:
- The number of requests during a time
- The average/min/max duration of these requests
Labels:
method: HTTP method used by the request being stored (GET, POST, PUT, DELETE, etc.)host: host and domain where the request is being sentpath: specific endpoint of the requeststatus_code: HTTP status code returned in the response
This metric was stored since Iron Maiden (7.2.0) release.
outgoing_request_duration_seconds
This metric is intended to store the information related to all the outgoing HTTP requests made by aura-bot.
It is stored as a Summary in Prometheus so every sample, besides the defined labels, also includes its duration.
This metric allows measuring the behavior of the requests to any given endpoint:
- The number of requests during a time
- The average/min/max duration of these requests
Labels:
method: HTTP method used by the request being stored (GET, POST, PUT, DELETE, etc.)host: host and domain where the request is being sentpath: specific endpoint of the requeststatus: HTTP status code returned in the response
This metric was stored since Camela (5.0.0) release.
outgoing_message_duration_seconds
This metric is intended to store the number of Direct Line requests arriving to aura-bot.
It is stored as a Summary in Prometheus, so every sample, besides the defined labels, also includes its duration.
As aura-bot is an asynchronous server, the processing of a request does not end when the HTTP response is returned, but when the proper answer for the user is sent back to the client callback. This metric measures the duration since the request lands in aura-bot until the last message of its answer is sent to the client callback.
Labels:
path: specific endpoint of the request.httpStatus: HTTP status code returned in the response.originStatus: status sent by Direct Line in the body of the response in the happening of an error.origin: specific host of the request.channel: channel of the request.
This metric was stored since Iron Maiden (7.2.0) release.
aura_component_version
This metric is intended to store the number of aura-bot instances (pods) running each version of the code. It is stored as a Gauge in Prometheus.
Labels:
version: version field in the package.json file included in the running docker container.component: name of the component that is writing the metric.
This metric was stored since Camela (5.0.0) release with the name of bot_version and updated to aura_component_version in Iron Maiden (7.2.0).
bot_request_version
This metric is intended to store the number of incoming requests to aura-bot depending on their channelData.version. It is stored as a Counter in Prometheus.
Labels:
version: channelData.version in the incoming request. If the incoming request has no version field, 1 will be set.
This metric was stored since Iron Maiden (7.2.0) release.
aura_server_unhandled_error
This metric is intended to store the number of unhandled errors happening in aura-bridge.
It is stored as a Counter in Prometheus.
Labels:
error: exception message that forced the unhandled error.
This metric was stored since Iron Maiden (7.2.0) release.
aura_token_generate
This metric is intended to store the information related to Kernel accessToken refreshments in aura-bridge. It is intended to make it possible to set an alarm in the happening of any error during refresh of the 2-legged accessToken needed to access Kernel WhatsApp APIs.
It is stored as a Summary.
Labels:
path: specific endpoint of the request.httpStatus: HTTP status returned by Kernel in the response.originStatus: status sent by Kernel in the body of the response in the happening of an error.origin: channelId of the channel that needs the accessToken in Aura.channel: channel of the request.
This metric was stored since Iron Maiden (7.2.0) release.
services_status
This metric is intended to store the number of success or errored checks of modules of the server. It is stored as a Counter in Prometheus.
Labels:
moduleId: Id of the module.status: OK or ERROR
5.2 - Aura Groot metrics
Aura Groot metrics
List of metrics available in Aura Groot
http_request_duration_seconds
This metric is intended to store the information related to all the incoming HTTP requests received by aura-groot.
It is stored as a Summary in Prometheus. So every sample, besides the defined labels, also includes its duration.
It measures the duration since the request lands in aura-groot until its HTTP response is returned, indicating to the client that Aura is processing the request to obtain a proper answer for the Direct Line or aura-bridge.
The metric allows measuring the behavior of the requests from any given endpoint:
- The number of requests during a time
- The average/min/max duration of these requests
Labels:
method: HTTP method used by the request being stored (GET, POST, PUT, DELETE, etc.)host: host and domain where the request is being sentpath: specific endpoint of the requeststatus_code: HTTP status code returned in the response
outgoing_request_duration_seconds
This metric is intended to store the processing time related to all the outgoing HTTP requests made by aura-groot.
It is stored as a Summary in Prometheus so every sample, besides the defined labels, also includes its duration.
This metric allows measuring the behavior of the requests to any given endpoint:
- The number of requests during a time
- The average/min/max duration of these requests
Labels:
method: HTTP method used by the request being stored (GET, POST, PUT, DELETE, etc.)host: host and domain where the request is being sentpath: specific endpoint of the requeststatus: HTTP status code returned in the response
outgoing_message_duration_seconds
This metric is intended to store the processing time of Direct Line or aura-bridge requests arriving to aura-groot.
It is stored as a Summary in Prometheus, so every sample, besides the defined labels, also includes its duration.
As aura-goot is an asynchronous server, the processing of a request does not end when the HTTP response is returned, but when the proper answer for the user is sent back to the client callback. This metric measures the duration since the request lands in aura-groot until the last message of its answer is sent to the client callback.
Labels:
path: specific endpoint of the request.httpStatus: HTTP status code returned in the response.originStatus: status sent by Direct Line in the body of the response in the happening of an error.origin: specific host of the request (Direct Line or aura-bridge).channel: channel of the request.
incoming_message_duration_seconds
This metric is intended to store the processing time of Direct Line, aura-bridge or skills requests arriving to aura-groot.
It is stored as a Summary in Prometheus, so every sample, besides the defined labels, also includes its duration.
As aura-goot is an asynchronous server, the processing of a request does not end when the HTTP response is returned, but when the proper answer for the channel or skill is sent back to the client callback. This metric measures the duration from when the request arrives at aura-groot until it is processed to send to the channel/bridge or skill.
Labels:
path: specific endpoint of the request.httpStatus: HTTP status code returned in the response.originStatus: status sent by Direct Line in the body of the response in the happening of an error.origin: specific host of the request (Direct Line, aura-bridge or skill name). If origin is missing, the content of path label will be added.channel: channel of the request.
aura_component_version
This metric is intended to store the number of aura-groot instances (pods) running each version of the code. It is stored as a Gauge in Prometheus.
Labels:
version: version field in the package.json file included in the running docker container.component: name of the component that is writing the metric.
aura_server_unhandled_error
This metric is intended to store the number of unhandled errors happening in aura-groot.
It is stored as a Counter in Prometheus.
Labels:
error: exception message that forced the unhandled error.
skill_access_error
This metric is intended to store the number of times a skill has been misconfigured in aura-groot.
It is stored as a Counter in Prometheus.
Labels:
skill: skill name.code: noRespond or noFoundchannel: channel of the request.
skill_request_status
This metric is intended to store the number of times we have obtained a response status per skill in aura-groot.
It is stored as a Counter in Prometheus.
Labels:
skill: skill name.code: status code of the request.channel: channel of the request.
skill_response_error
This metric is intended to store the number of times a skill has been blocked in aura-groot.
It is stored as a Counter in Prometheus.
Labels:
skill: skill namecode: blockedchannel: channel of the request.
services_status
This metric is intended to store the number of success or errored checks of modules of the server. It is stored as a Counter in Prometheus.
Labels:
moduleId: Id of the module.status: OK or ERROR
5.3 - Atria Model Gateway metrics
Atria Model Gateway metrics
List of metrics available in atria-model-gateway
http_request_duration_seconds
This metric is intended to store the information related to all the incoming HTTP requests received by atria-model-gateway.
It is stored as a Summary in Prometheus, so every sample, besides the defined labels, also includes its duration.
This metric allows measuring the behavior of the requests from any given endpoint. Specifically, the duration since the request lands in atria-model-gateway until its HTTP response is returned:
- The number of requests during a time
- The average/min/max duration of these requests
Labels:
method: HTTP method used by the request being stored (GET, POST, PUT, DELETE, etc.)path: specific endpoint of the requeststatus_code: HTTP status code returned in the responseapplication: application name that is using the model
outgoing_request_duration_seconds
This metric is intended to store the information related to all the outgoing HTTP requests made by atria-model-gateway. It is stored as a Summary in Prometheus, so every sample, besides the defined labels, also includes its duration.
The metric allows measuring the behavior of the requests to any given endpoint:
- The number of requests during a time
- The average/min/max duration of these requests
Labels:
method: HTTP method used by the request being stored (GET, POST, PUT, DELETE, etc.)host: host and domain where the request is being sentpath: specific endpoint of the requeststatus: HTTP status code returned in the response
generative_tokens
This metric is intended to store the information related to tokens used by OpenAI in atria-rag-server. It is stored as a Summary in Prometheus, so every sample, besides the defined labels, also includes its tokens usages.
The metric allows measuring the behavior of the tokens using any given OpenAI model:
- The number of tokens during a time
- The average/min/max tokens of these requests
Labels:
application: application name that is using the modeldeployment_model_name: name of the deployment modelmodel_type: identifier of the model
5.4 - Atria RAG server metrics
Atria RAG server metrics
List of metrics available in atria-rag-server
http_request_duration_seconds
This metric is intended to store the information related to all the incoming HTTP requests received by atria-rag-server.
It is stored as a Summary in Prometheus, so every sample, besides the defined labels, also includes its duration.
This metric allows measuring the behavior of the requests from any given endpoint. Specifically, the duration since the request lands in atria-rag-server until its HTTP response is returned:
- The number of requests during a time
- The average/min/max duration of these requests
Labels:
method: HTTP method used by the request being stored (GET, POST, PUT, DELETE, etc.)path: specific endpoint of the requeststatus_code: HTTP status code returned in the responseapplication: application name that is using the model
outgoing_request_duration_seconds
This metric is intended to store the information related to all the outgoing HTTP requests made by atria-rag-server. It is stored as a Summary in Prometheus, so every sample, besides the defined labels, also includes its duration.
The metric allows measuring the behavior of the requests to any given endpoint:
- The number of requests during a time
- The average/min/max duration of these requests
Labels:
method: HTTP method used by the request being stored (GET, POST, PUT, DELETE, etc.)host: host and domain where the request is being sentpath: specific endpoint of the requeststatus: HTTP status code returned in the response
5.5 - Aura Authentication API metrics
Authentication API metrics
List of metrics available in Aura Authentication API
http_request_duration_seconds
This metric is intended to store the information related to all the incoming HTTP requests received by aura-authentication-api. It is stored as a Summary in Prometheus, so every sample, besides the defined labels, also includes its duration.
This metric allows measuring the behavior of the requests from any given endpoint. Specifically, the duration since the request lands in aura-authentication-api until its HTTP response is returned:
- The number of requests during a time
- The average/min/max duration of these requests
Labels:
method: HTTP method used by the request being stored (GET, POST, PUT, DELETE, etc.).host: host and domain where the request is being sentpath: specific endpoint of the requeststatus_code: HTTP status code returned in the response
This metric was stored since Greenday (6.0.0) release.
outgoing_request_duration_seconds
This metric is intended to store the information related to all the outgoing HTTP requests made by aura-authentication-api. It is stored as a Summary in Prometheus, so every sample, besides the defined labels, also includes its duration.
The metric allows measuring the behavior of the requests to any given endpoint:
- The number of requests during a time
- The average/min/max duration of these requests
Labels:
method: HTTP method used by the request being stored (GET, POST, PUT, DELETE, etc.)host: host and domain where the request is being sentpath: specific endpoint of the requeststatus: HTTP status code returned in the response
This metric was stored since Camela (5.0.0) release.
aura_token_generate
This metric is intended to store the information related to Kernel accessToken generation, used during the integrated authorization process of the Aura users in aura-authentication-api.
It is intended to make it possible to set an alarm in the happening of any error during token validation. It is stored as a Summary in Prometheus.
Labels:
path: specific endpoint of the request.httpStatus: HTTP status returned by Kernel in the response.originStatus: status sent by Kernel in the body of the response in the happening of an error.origin: channelId of the channel that needs the accessToken in Aura.
This metric was stored since Iron Maiden (7.2.0) release.
aura_component_version
This metric is intended to store the number of aura-authentication-api instances (pods) running each version of the code.
It is stored as a Gauge in Prometheus.
Labels:
version: version field in the package.json file included in the running docker container.component: name of the component that is writing the metric.
This metric was stored since Barricada (5.3.0) release with the name of authentication_api_version and updated to aura_component_version in Iron Maiden (7.2.0).
aura_server_unhandled_error
This metric is intended to store the number of unhandled errors happening in aura-bridge. It is stored as a Counter in Prometheus.
Labels:
error: exception message that forced the unhandled error.
This metric was stored since Iron Maiden (7.2.0) release.
services_status
This metric is intended to store the number of success or errored checks of modules of the server. It is stored as a Counter in Prometheus.
Labels:
moduleId: Id of the module.status: OK or ERROR
5.6 - Aura Configuration API metrics
Aura Configuration metrics
List of metrics available in Aura Configuration API
http_request_duration_seconds
This metric is intended to store the information related to all the incoming HTTP requests received by aura-configuration-api.
It is stored as a Summary in Prometheus, so every sample, besides the defined labels, also includes its duration.
This metric allows measuring the behavior of the requests from any given endpoint. Specifically, the duration since the request lands in aura-configuration-api until its HTTP response is returned:
- The number of requests during a time
- The average/min/max duration of these requests
Labels:
method: HTTP method used by the request being stored (GET, POST, PUT, DELETE, etc.)host: host and domain where the request is being sentpath: specific endpoint of the requeststatus_code: HTTP status code returned in the response
This metric was stored since Greenday (6.0.0) release.
outgoing_request_duration_seconds
This metric is intended to store the information related to all the outgoing HTTP requests made by aura-configuration-api. It is stored as a Summary in Prometheus, so every sample, besides the defined labels, also includes its duration.
The metric allows measuring the behavior of the requests to any given endpoint:
- The number of requests during a time
- The average/min/max duration of these requests
Labels:
method: HTTP method used by the request being stored (GET, POST, PUT, DELETE, etc.)host: host and domain where the request is being sentpath: specific endpoint of the requeststatus: HTTP status code returned in the response
aura_component_version
This metric is intended to store the number of aura-configuration-api instances (pods) running each version of the code.
It is stored as a Gauge in Prometheus.
Labels:
version: version field in the package.json file included in the running docker container.component: name of the component that is writing the metric.
aura_server_unhandled_error
This metric is intended to store the number of unhandled errors happening in aura-configuration-api. It is stored as a Counter in Prometheus.
Labels:
error: exception message that forced the unhandled error.
services_status
This metric is intended to store the number of success or errored checks of modules of the server. It is stored as a Counter in Prometheus.
Labels:
moduleId: Id of the module.status: OK or ERROR
5.7 - Aura Gateway API metrics
Gateway API metrics
List of metrics available in Aura Gateway API
http_request_duration_seconds
This metric is intended to store the information related to all the incoming HTTP requests received by aura-gateway-api.
It is stored as a Summary in Prometheus, so every sample, besides the defined labels, also includes its duration.
This metric allows measuring the behavior of the requests from any given endpoint. Specifically, the duration since the request lands in aura-gateway-api until its HTTP response is returned:
- The number of requests during a time
- The average/min/max duration of these requests
Labels:
method: HTTP method used by the request being stored (GET, POST, PUT, DELETE, etc.)host: host and domain where the request is being sentpath: specific endpoint of the requeststatus_code: HTTP status code returned in the responseapplication: Application name of the request.channel: Channel name of the request. Only for NLPaaS endpoint.preset: Preset name of the request. Only for Generative endpoint.
outgoing_request_duration_seconds
This metric is intended to store the information related to all the outgoing HTTP requests made by aura-gateway-api. It is stored as a Summary in Prometheus, so every sample, besides the defined labels, also includes its duration.
The metric allows measuring the behavior of the requests to any given endpoint:
- The number of requests during a time
- The average/min/max duration of these requests
Labels:
method: HTTP method used by the request being stored (GET, POST, PUT, DELETE, etc.)host: host and domain where the request is being sentpath: specific endpoint of the requeststatus: HTTP status code returned in the response
aura_component_version
This metric is intended to store the number of aura-gateway-api instances (pods) running each version of the code.
It is stored as a Gauge in Prometheus.
Labels:
version: version field in the package.json file included in the running docker container.component: name of the component that is writing the metric.
This metric was stored since Beatles (8.9.0) release.
aura_server_unhandled_error
This metric is intended to store the number of unhandled errors happening in aura-gateway. It is stored as a Counter in Prometheus.
Labels:
error: exception message that forced the unhandled error.
services_status
This metric is intended to store the number of success or errored checks of modules of the server. It is stored as a Counter in Prometheus.
Labels:
moduleId: Id of the module.status: OK or ERROR
5.8 - Aura Bridge metrics
Aura Bridge metrics
List of metrics available in Aura bridge
http_request_duration_seconds
This metric is intended to store the information related to all the incoming HTTP requests received by aura-bridge.
It is stored as a Summary in Prometheus, so every sample, besides the defined labels, also includes its duration.
It measures the duration since the request lands in aura-bridge until its HTTP response is returned, indicating to the client that Aura is processing the request to obtain a proper answer for the user.
Labels:
method: HTTP method used by the request being stored (GET, POST, PUT, DELETE, etc.)host: host and domain where the request is being sentpath: specific endpoint of the requeststatus_code: HTTP status code returned in the response
This metric allows measuring the behavior of the requests from any given endpoint:
- The number of requests during a time
- The average/min/max duration of these requests
This metric was stored since Greenday (6.0.0) release.
outgoing_message_duration_seconds
This metric is intended to store the information related to all the incoming HTTP requests received by aura-bridge.
It is stored as a Summary in Prometheus, so every sample, besides the defined labels, also includes its duration.
As aura-bridge is an asynchronous server, the processing of a request does not end when the HTTP response is returned, but when the proper answer for the user is sent back to the client callback.
This metric measures the duration since the request lands in aura-bridge until the last message of its answer is sent to the client callback.
Labels:
host: host and domain where the request is being sent.method: HTTP method used by the request being stored (GET, POST, PUT, DELETE, etc.)path: specific endpoint of the request.originStatus: third party status sent in the body of the response. Usually, this status is sent by whatsapp.status: HTTP status code returned in the response.origin: specific source of the request. The value could be: ‘4p’, ‘whatsapp’, ‘aura-bot’ or ‘genesys’.channel: channel of the request.
This metric allows measuring the behavior of the requests from any given endpoint:
- The number of requests during a time
- The average/min/max duration of these requests
This metric was stored since Greenday (6.0.0) release.
incoming_message_duration_seconds
This metric is intended to store the number requests arriving to aura-bridge from a channel or Direct Line.
It is stored as a Summary in Prometheus, so every sample, besides the defined labels, also includes its duration.
As aura-bridge is an asynchronous server, the processing of a request does not end when the HTTP response is returned, but when the proper answer for the channel or Direct Line is sent back to the client callback. This metric measures the duration from when the request arrives at aura-bridge until it is processed to send to the channel or Direct Line.
Labels:
path: specific endpoint of the request.httpStatus: HTTP status code returned in the response.originStatus: status sent by Direct Line or channel in the body of the response in the happening of an error.origin: specific host of the request. If origin is missing, the content of path label will be added.channel: channel of the request. In Auraline requests used to get conversationId with path: /aura-services/v1/auraline/conversations, channel will be missing.
aura_response_ack_duration_seconds
This metric is intended to store the information related to all the ACK requests sent by the clients to aura-bridge. The ACK requests are used by the clients (WhatsApp) to notify if in the end Aura’s answer was delivered to the user or not.
It is stored as a Summary in Prometheus, so every sample, besides the defined labels, also includes its duration. The duration measures since the ACK request lands in aura-bridge until its asynchronous answer is sent to the user.
Labels:
host: host and domain where the request is being sent.method: HTTP method used by the request being stored (GET, POST, PUT, DELETE, etc.)path: specific endpoint of the request.originStatus: third party status sent in the body of the response. Usually, this status is sent by whatsapp.status: HTTP status code returned in the response.origin: specific source of the request. The value could be: ‘4p’, ‘whatsapp’, ‘aura-bot’ or ‘genesys’.channel: channel of the request.
This metric allows measuring the behavior of the requests to any given endpoint:
- The number of requests during a time
- The average/min/max duration of these requests
This metric was stored since Heroes (7.0.0) release.
outgoing_request_duration_seconds
This metric is intended to store the information related to all the outgoing HTTP requests made by aura-bridge. It is stored as a Summary in Prometheus, so every sample, besides the defined labels, also includes its duration.
Labels:
method: HTTP method used by the request being stored (GET, POST, PUT, DELETE, …)host: host and domain where the request is being sentpath: specific endpoint of the requeststatus: HTTP status code returned in the response
This metric allows measuring the behavior of the requests to any given endpoint:
- The number of requests during a time
- The average/min/max duration of these requests
This metric was stored since Greenday (6.0.0) release.
aura_server_unhandled_error
This metric is intended to store the number of unhandled errors happening in aura-bridge. It is stored as a Counter in Prometheus.
Labels:
error: exception message that forced the unhandled error.
This metric was stored since Iron Maiden (7.2.0) release.
aura_token_generate
This metric is intended to store the information related to Kernel accessToken refreshments in aura-bridge. It is intended to make it possible to set an alarm in the happening of any error during refresh of the 2-legged accessToken needed to access Kernel WhatsApp APIs.
It is stored as a Summary in Prometheus.
Labels:
path: specific endpoint of the request.httpStatus: HTTP status returned by Kernel in the response.originStatus: status sent by Kernel in the body of the response in the happening of an error.origin: channelId of the channel that needs the accessToken in Aura.
This metric was stored since Iron Maiden (7.2.0) release.
aura_component_version
This metric is intended to store the number of aura-bridge instances (pods) running each version of the code.
It is stored as a Gauge in Prometheus.
Labels:
version: version field in the package.json file included in the running docker container.component: name of the component that is writing the metric.
This metric was stored since Greenday (6.0.0) release with the name of aura_bridge_version and updated to aura_component_version in Iron Maiden (7.2.0).
aura_bridge_wa_incoming_message
This metric is intended to store the number of unhandled errors happening in aura-bridge. It is stored as a Counter in Prometheus.
Labels:
error: exception message that forced the unhandled error.
This metric was stored since Iron Maiden (7.2.0) release.
services_status
This metric is intended to store the number of success or errored checks of modules of the server. It is stored as a Counter in Prometheus.
Labels:
moduleId: Id of the module.status: OK or ERROR
5.9 - Aura KPIs uploader metrics
Aura KPIs Uploader
List of metrics available in Aura KPIs uploader
aura_kpis_uploader_metrics_duration
This KPI measures the time required by aura-kpis-uploader to process each type of KPI. KPI management has several steps (load, process, upload), and this KPI represents the time it takes to perform all those steps for each of the KPIs defined in AURA_SOURCE_PATH_AVRO_ADAPTERS.
It is stored as a Summary in Prometheus, so every sample, besides the defined labels, also includes its duration.
Labels:
format: File format in which the KPI will be stored.
csv: File format will be CSV (deprecated).avro: File format will be AVRO.
kpiType: Type of KPI:
entity: KPI is of type Entity.dimensional: KPI is of type Dimensional.
kpiName: Name of the KPI.duration: Time in seconds with the time used to process the KPI.numberFilesProcessed: Number of KPIs processed. If the format is AVRO, it represents the number of records processed. If the format is CSV, it only represents the number of processed files.
aura_kpis_uploader_metrics
This metric is intended to store the information related to all processes executed by aura-kpis-uploader. It is stored as a Counter in Prometheus, so every sample, besides the defined labels.
This KPI measures the amount of KPI registers processed, if the format is AVRO it represents the number of records processed. If the format is CSV, it only represents the number of processed files.
Labels:
format: File format in which the KPI will be stored.
csv: File format will be CSV (deprecated).avro: File format will be AVRO.
kpiType: Type of KPI:
entity: KPI is of type Entity.dimensional: KPI is of type Dimensional.
kpiName: Name of the KPI.duration: Time in seconds with the time used to process the KPI.numberFilesProcessed: Number of KPIs processed. If the format is AVRO, it represents the number of records processed. If the format is CSV, it only represents the number of processed files.
aura_kpis_uploader_errors
This metric is intended to store the information related to all errors generated by execution of aura-kpis-uploader. It is stored as a Counter in Prometheus, so every sample, besides the defined labels.
This KPI measures the amount of KPI errors produced when generating KPIs.
Labels:
type: Name of the method or function where the error occurred.format: File format in which the KPI will be stored.
csv: File format will be CSV (deprecated).avro: File format will be AVRO.
kpiType: Type of KPI:
entity: KPI is of type Entity.dimensional: KPI is of type Dimensional.
kpiName: Name of the KPI.url: If the error contains a file with more information stored in Azure Storage, this field contains the URL to download the file.
aura_server_unhandled_error
This metric is intended to store the number of unhandled errors happening in aura-kpis-uploader. It is stored as a Counter in Prometheus.
Labels:
error: Exception message that forced the unhandled error.
aura_server_unhandled_error is stored from Loquillo (7.5.0) release onwards.
5.10 - Aura NLP metrics
Aura NLP metrics
List of metrics available in Aura NLP
These metrics are stored since Heroes (7.0.0.) release
http_request_duration_seconds
This Prometheus metric is modelled as a summary where its value is the spent time until the remote host responds to an HTTP request.
Note that the value is a float number rounded to its third decimal. It is stored as a Summary in Prometheus.
This metric is intended to store the duration of outgoing requests in seconds.
Labels:
All label values are strings.
method: HTTP method used by the request being stored (GET, POST, PUT, DELETE, etc.).path: HTTP path of the incoming request.status_code: the responded HTTP status code (as a string).
Value:
- Request duration in seconds.
outgoing_request_duration_seconds
This Prometheus metric is a modelled as a summary where the value is the spent time until the remote host responds to an HTTP request.
Note the value is a float number rounded to its third decimal. It is stored as a Summary in Prometheus.
This metric is intended to store the duration of outgoing requests in seconds.
Labels:
All label values are strings.
method: HTTP method (GET, POST; etc.), a string in uppercase.host: remote host that will receive the outgoing request.path: HTTP path of the outgoing request.status: the responded HTTP status code (as a string).
5.11 - T&C API metrics
Terms & Conditions API metrics
List of metrics available in Terms and Conditions API
http_request_duration_seconds
This metric is intended to store the information related to all the incoming HTTP requests handled by tac-api. It is stored as a Histogram in Prometheus, so every sample, besides the defined labels, also includes its duration.
It measures the duration since the request lands in tac-api until its HTTP response is returned.
This metric allows measuring the behavior of the requests from any given endpoint:
- The number of requests during a period of time
- The average/min/max duration of these requests
- Quantiles of the duration and the number of requests in a period
Labels:
method: HTTP method used by the request being stored (GET, POST, PUT, DELETE, etc.)host: host and domain where the request is being sentpath: specific endpoint of the requeststatus_code: HTTP status code returned in the response
This metric was stored since Barricada (5.0.0) release.
http_requests_total
This metric is intended to store information about all the request handled by tac-api. It is stored as a Counter in Prometheus.
Labels:
method: HTTP method used by the request being stored (GET, POST, PUT, DELETE, etc.)status_code: HTTP status code returned in the response.
This metric allows measuring the behavior of the requests from any given endpoint:
- The number of requests during a time
- The average/min/max duration of these requests
- Quantiles
This metric was stored since Barricada (4.0.0) release.
http_in_flight_requests_total
This metric is intended to store the information related to all the concurrent HTTP requests being handled by tac-api in a period.
It is stored as a Gauge in Prometheus because it is a value that can go up and down at every moment.
This metric allows to measure the behavior of the requests from any given endpoint:
- The number of requests during a period of time
- The average/min/max duration of these requests
- Quantiles of the duration and the number of requests in a period.
This metric was stored since Barricada (4.0.0) release.
tac_internal_errors
This metric is intended to store the number of internal errors happening in tac-api. It is stored as a Counter in Prometheus because its value can only go up.
Labels:
name: it will contain the exception message that forced the unhandled error.
This metric was stored since Barricada (4.0.0) release.
tac_service_acceptances_total
This metric is intended to store the number of acceptances of Terms and Conditions per service handled by tac-api. It is stored as a Counter in Prometheus because its value can only go up.
Labels:
name: it will contain the name of the accepted service. Currently, it could contain one of: aura, whatsapp-anonymous, whatsapp-authenticatedversion: T&C version accepted by the user
This metric was stored since Barricada (4.0.0) release.
tac_service_updates_total
This metric is intended to store the number of updates of terms and conditions per service handled by tac-api. It is stored as a Counter in Prometheus because its value can only go up.
Labels:
name: name of the updated service. Currently (Iron Maiden) it could contain one of: aura, whatsapp-anonymous, whatsapp-authenticatedversion: T&C version updated by the user
This metric was stored since Barricada (4.0.0) release.
tac_user_deletions_total
This metric is intended to store the number of deletions of terms and conditions per service handled by tac-api. It is stored as a Counter in Prometheus because its value can only go up.
This metric was stored since Barricada (4.0.0) release.
aura_component_version
This metric is intended to store the number tac-api instances (pods) running each version of the code. It is stored as a Gauge in Prometheus.
Labels:
version: version field in the package.json file included in the running docker container.component: name of the component that is writing the metric.
This metric was stored since Iron Maiden (7.2.0).
5.12 - NLP provisioning metrics
NLP Provisioning metrics
List of metrics available in Aura NLP provisioning
These metrics are stored since Heroes (7.0.0.) release.
Introduction
In the Aura NLP provisioning component, it is important to know in each moment the quantity of processes restarted in relation with the total processes that, at this moment, work to process the different container. In that way, it could be alerted to an abnormal performance and take measures in this regard.
http_request_duration_seconds
This Prometheus metric is modelled as a summary where its value is the spent time until the remote host responds to an HTTP request.
Note that the value is a float number rounded to its third decimal. It is stored as a Summary in Prometheus.
This metric is intended to store the duration of outgoing requests in seconds.
Labels:
All label values are strings.
method: HTTP method used by the request being stored (GET, POST, PUT, DELETE, etc.).path: HTTP path of the incoming request.status_code: the responded HTTP status code (as a string).
Value:
- Request duration in seconds.
nlp_provisioning_killed_processes
This metric is intended to store the number of processes killed in each iteration of the Aura NLP provisioning execution. It is stored as a Gauge in Prometheus.
Value:
- Number worker processes killed in each iteration
nlp_provisioning_alive_processes
This metric is intended to store the number worker processes alive in each iteration of NLP Provisioning. It is stored as a Gauge.
Value:
nlp_provisioning_expected_alive_processes
This metric is intended to store the number of expected alive processes in the NLP Provisioning. It is stored as a Gauge.
Value:
- Set gauge with total alive processes.
- Decrease gauge with finished processes.
nlp_provisioning_container_killed_count
This metric is intended to store the counter of all the processes killed in Aura NLP provisioning. It is stored as a Counter in Prometheus.
Labels:
container: container URL.
Value:
5.13 - Aura Complex Logic metrics
Aura Complex Logic metrics
List of metrics available in Aura Complex Logic Framework
These metrics are stored since Heroes (7.0.0.) release
http_request_duration_seconds
This Prometheus metric is modelled as a summary, where its value is the spent time until the remote host responds to an HTTP request.
Note that the value is a float number rounded to its third decimal. It is stored as a Summary in Prometheus.
This metric is intended to store the duration of outgoing requests in seconds.
Labels:
All label values are strings.
method: HTTP method used by the request being stored (GET, POST, PUT, DELETE, etc.).path: HTTP path of the incoming request.status_code: the responded HTTP status code (as a string).
Value:
- Request duration in seconds
supervised_complex_logic_app_restarted_counter
This metric is intended to store a count of the restarted plugins.
It is stored as a Counter in Prometheus.
Labels:
All label values are strings.
app: clfsupervised_plugin: Supervised plugin class path.plugin_status: Plugin response code status.plugin_handler_name: Handler name.
complex_logic_app_http_requests
This metric is intended to store the HTTP requests of Aura Complex Logic plugins.
It is stored as a Counter in Prometheus.
Labels:
All label values are strings.
app: clfplugin: plugin class path.status_code: plugin response code status.handler_name: handler name.
5.14 - Aura Context metrics
Aura Context metrics
List of metrics available in Aura Context
These metrics are stored since Heroes (7.0.0.) release
http_request_duration_seconds
This Prometheus metric is modelled as a summary where its value is the spent time until the remote host responds to an HTTP request.
Note that the value is a float number rounded to its third decimal. It is stored as a Summary in Prometheus.
This metric is intended to store the duration of outgoing requests in seconds.
Labels:
All label values are strings.
method: HTTP method used by the request being stored (GET, POST, PUT, DELETE, etc.).path: HTTP path of the incoming request.status_code: the responded HTTP status code (as a string).
Value:
- Request duration in seconds.
database_request_duration_seconds
This metric is intended to store the duration of database requests in seconds.
It is stored as a Summary in Prometheus.
Labels:
All label values are strings.
database: database name (Redis or Mongo).operation: database operation (i.e., update, create, get_by_date, get_last_n, get_by_corr).
Value:
- Request duration in seconds.
5.15 - Aura File Manager metrics
Aura File Manager metrics
List of metrics available in Aura File Manager
http_request_duration_seconds
This metric is intended to store the information related to all the incoming HTTP requests received by aura-file-manager.
It is stored as a Summary in Prometheus. So every sample, besides the defined labels, also includes its duration.
It measures the duration since the request lands in aura-file-manager until its HTTP response is returned, indicating to the client that Aura is processing the request to obtain a proper answer.
The metric allows measuring the behavior of the requests from any given endpoint:
- The number of requests during a time
- The average/min/max duration of these requests
Labels:
method: HTTP method used by the request being stored (GET, POST, PUT, DELETE, etc.)host: host and domain where the request is being sentpath: specific endpoint of the requeststatus_code: HTTP status code returned in the response
outgoing_request_duration_seconds
This metric is intended to store the processing time related to all the outgoing HTTP requests made by aura-file-manager.
It is stored as a Summary in Prometheus so every sample, besides the defined labels, also includes its duration.
This metric allows measuring the behavior of the requests to any given endpoint:
- The number of requests during a time
- The average/min/max duration of these requests
Labels:
method: HTTP method used by the request being stored (GET, POST, PUT, DELETE, etc.)host: host and domain where the request is being sentpath: specific endpoint of the requeststatus: HTTP status code returned in the response
outgoing_message_duration_seconds
This metric is intended to store the processing time of aura-bot requests arriving to aura-file-manager.
It is stored as a Summary in Prometheus, so every sample, besides the defined labels, also includes its duration.
As aura-file-manager is an asynchronous server, the processing of a request does not end when the HTTP response is returned, but when the proper answer for the user is sent back to the client callback. This metric measures the duration since the request lands in aura-file-manager until the last message of its answer is sent to the client callback.
Labels:
path: specific endpoint of the request.httpStatus: HTTP status code returned in the response.origin: aura-bot
incoming_message_duration_seconds
This metric is intended to store the processing time of aura-bot requests arriving to aura-file-manager.
It is stored as a Summary in Prometheus, so every sample, besides the defined labels, also includes its duration.
As aura-file-manage is an asynchronous server, the processing of a request does not end when the HTTP response is returned, but when the proper answer for the channel or skill is sent back to the client callback. This metric measures the duration from when the request arrives at aura-file-manager until it is processed to send the response.
Labels:
path: specific endpoint of the request.httpStatus: HTTP status code returned in the response.originStatus: status sent in the body of the response in the happening of an error.origin: aura-bot
aura_component_version
This metric is intended to store the number of aura-file-manager instances (pods) running each version of the code. It is stored as a Gauge in Prometheus.
Labels:
version: version field in the package.json file included in the running docker container.component: name of the component that is writing the metric.
aura_server_unhandled_error
This metric is intended to store the number of unhandled errors happening in aura-file-manager.
It is stored as a Counter in Prometheus.
Labels:
error: exception message that forced the unhandled error.
aura_token_generate
This metric is intended to store the processing time of aura-file-manger to get/refresh kernel token.
It is stored as a Summary in Prometheus, so every sample, besides the defined labels, also includes its duration.
Labels:
path: specific endpoint of the request.httpStatus: HTTP status code returned in the response.originStatus: status sent by Direct Line in the body of the response in the happening of an error.origin: kernel client identifier
file_validation_duration_seconds
This metric is intended to store the validation time of a file.
It is stored as a Summary in Prometheus, so every sample, besides the defined labels, also includes its duration.
Labels:
path: specific endpoint of the request.code: OK when file is valid.origin: specific endpoint of the request.
services_status
This metric is intended to store the number of success or errored checks of modules of the server. It is stored as a Counter in Prometheus.
Labels:
moduleId: Id of the module.status: OK or ERROR
5.16 - Aura Redis MongoDB sync metrics
Aura Redis MongoDB Synchronizer metrics
List of metrics available in aura-redis-mongo-sync (ARMS)
aura_component_version
This metric is intended to store the number of aura-bot instances (pods) running each version of the code. It is stored as a Gauge in Prometheus.
Labels:
version: version field in the package.json file included in the running docker container.component: name of the component that is writing the metric.
aura_server_unhandled_error
This metric is intended to store the number of unhandled errors happening in aura-redis-mongo-sync.
It is stored as a Counter in Prometheus.
Labels:
error: exception message that forced the unhandled error.
redis_mongo_sync_duration_milliseconds
This metric measures the data upload time from the service to the Mongo database.
It is stored as a Histogram in Prometheus. So every sample, besides the defined labels, also includes its duration.
The aura-redis-mongo-sync service contains a data collector that helps the event service move stale data from Redis to MongoDB. This collector sends the data in packets to optimize performance. This metric measures the time MongoDB takes to process the packet.
Labels:
status: HTTP status returned in the response. Values: success.
success: if the status is success, the time is stored.
redis_mongo_synced_items_total
This metric is intended to store the registers synchronized between Redis and MongoDB by events.
It is stored as a Counter in Prometheus.
Labels:
type: register type. Values: event, active_context
event: Items synchronized by event.active_context: Items synchronized by active context process.
redis_mongo_synced_errors
This metric is intended to store the errors that have occurred in the synchronization.
It is stored as a Counter in Prometheus.
Labels:
error: Values : create, syncData, executeBulk.
create: If the error occurred when creating the service.syncData: If the error occurred when synchronizing the data.executeBulk: If the error occurred when uploading the data to MongoDB in bulk mode.
redis_mongo_sync_configuration_settings
This metric contains the service configuration data.
It is stored as a Gauge in Prometheus.
Labels:
setting_name: Values: shard_count, pod_count, active_context_ttl_seconds, redis_cache_ttl_seconds.
shard_count: Current shard used to distribute the data to synchronize between pods.pod_count: Current number of services of aura-redis-mongo-sync.active_context_ttl_seconds: Time interval to run the data collector.redis_cache_ttl_seconds: Time in seconds that will be set to the context elements in the Redis cache.
services_status
This metric is intended to store the number of success or errored checks of modules of the server. It is stored as a Counter in Prometheus.
Labels:
moduleId: Id of the module.status: OK or ERROR
6 - Aura dashboards
Aura dashboards
Discover the dashboards that can be generated through the different tools used for Aura monitoring in order to track and analyze data
Introduction
Dashboards are reporting tools that aggregate and display metrics and key indicators, so they can be examined at a glance by all possible audiences.
These dashboards allow data interpretation and provide an overall view for the evaluation of Aura’s performance, thus improving decision-making. Each component counts on a dashboard to show its current behavior and there is a single dashboard for an Aura overview.
There are two types of dashboards for Aura metrics (Prometheus) that are generated in Grafana:
6.1 - Aura system dashboards
Aura system dashboards
Grafana dashboards with metrics related to the performance of Aura system
Introduction
Currently, these are the available Aura system dashboards in Grafana based on metrics stored in Prometheus:
6.1.1 - Alertmanager dashboard
Alertmanager dashboard
Information provided by Alertmanager dashboards
Panels
Received alerts rate
It shows a time series with the received alerts rate aggregated by one minute.
The x-axis shows the time series and the y-axis shows received alerts rate.
The queries used to get the panel information are:
sum(rate(prometheus_notifications_alertmanagers_discovered[1m])) by(status)
An example of this panel is shown below:
The available metrics are defined in the following sections.
Successful notification rate
It shows a time series with the successful notifications rate aggregated by one minute.
The x-axis shows the time series and the y-axis shows the successful notifications rate.
The queries used to get the panel information are:
sum(rate(prometheus_notifications_sent_total[1m])) by(integration)
An example of this panel is shown below:
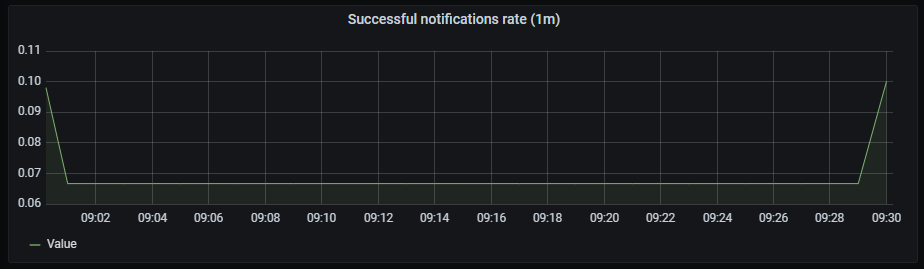
Failed notifications rate
It shows a time series with the failed notifications rate aggregated by one minute.
The x-axis shows the time series and the y-axis shows the failed notifications rate.
The queries used to get panel information are:
sum(rate(prometheus_notifications_errors_total[1m])) by(integration)
An example of this panel is shown below:
CPU usage rate
It shows a time series with the CPU usage rate aggregated by one minute. It also shows the current minimum, maximum and average cpu consumption of alertmanager.
The x-axis shows the time series and the y-axis shows the CPU usage rate.
The queries used to get panel information are:
sum(rate(container_cpu_usage_seconds_total{container="alertmanager"}[1m])) by (pod_name)
An example of this panel is shown below:
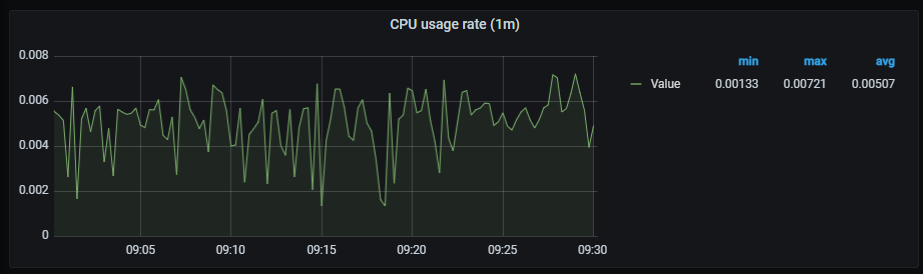
Memory usage
It shows a time series with the memory usage. It also shows the current minimum, maximum and average memory consumption of alertmanager.
The x-axis shows the time series and the y-axis shows the memory usage.
The queries used to get panel information are:
sum (container_memory_working_set_bytes{container="alertmanager"}) by (pod_name)
An example of this panel is shown below:
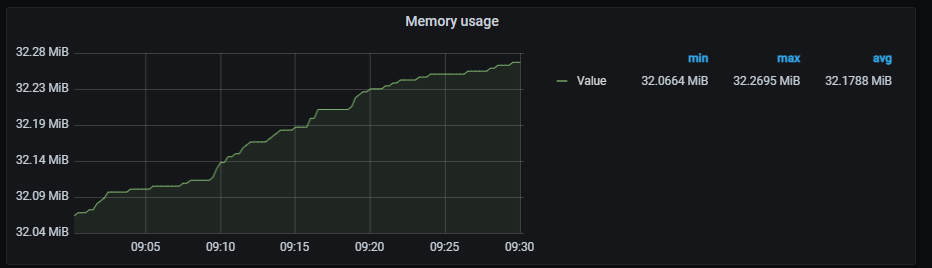
Pods network I/O
It shows a time series with the network I/O average aggregated by one minute. It also shows the current minimum, maximum and average network I/O.
The x-axis shows the time series and the y-axis shows the network usage.
The queries used to get panel information are:
sum (rate (container_network_receive_bytes_total{pod!="",pod=~"alertmanager.*"}[1m])) by (pod)
- sum (rate (container_network_transmit_bytes_total{pod!="",pod=~"alertmanager.*"}[1m])) by (pod)
An example of this panel is shown below:
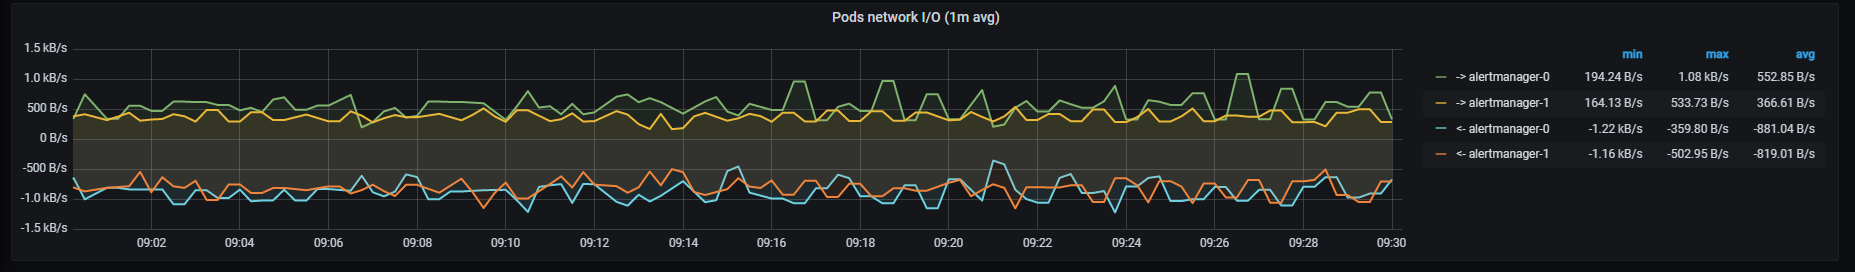
6.1.2 - Elasticsearch dashboard
Elasticsearch dashboard
Information provided by Elasticsearch dashboard
Introduction
Elastic dashboard monitors multiple data, service and system related metrics.
The different graphs are shown in the following sections:
- Cluster graphs
- Shard graphs
- system graphs
- Documents graphs
- Total operations stats graphs
- Elastic search times graphs
- Caches graphs
- Thread pool graphs
- JVM garbage collection graphs
Cluster graphs
The current section includes cluster related graphs.
Health status
Code coloured indicator of cluster health.
Metrics:
((sum(elasticsearch_cluster_health_status{color="green"})*2)+sum(elasticsearch_cluster_health_status{color="yellow"}))/count(elasticsearch_index_stats_up)
Nodes
Number of nodes.
Metrics:
count(elasticsearch_index_stats_up)
Data nodes
Number of data nodes per node.
Metrics:
sum(elasticsearch_cluster_health_number_of_data_nodes{cluster="elasticsearch"})/count(elasticsearch_index_stats_up)
Pending tasks
Pending tasks per node.
Metrics:
sum(elasticsearch_cluster_health_number_of_pending_tasks{cluster="elasticsearch"})/count(elasticsearch_index_stats_up)
Graph visual

Shards graphs
Shards related graphs.
Active primary shards
Number of active primary shards per node.
Metrics:
sum(elasticsearch_cluster_health_active_primary_shards{cluster="elasticsearch"})/count(elasticsearch_index_stats_up)
Active shards
Number of active shards per node.
Metrics:
sum(elasticsearch_cluster_health_active_shards{cluster="elasticsearch"})/count(elasticsearch_index_stats_up)
Initializing shards
Number of shards initializing per node.
Metrics:
sum(elasticsearch_cluster_health_initializing_shards{cluster="elasticsearch"})/count(elasticsearch_index_stats_up)
Relocating shards
Number of relocating shards per node.
Metrics:
sum(elasticsearch_cluster_health_relocating_shards{cluster="elasticsearch"})/count(elasticsearch_index_stats_up)
Unassigned shards
Number of unassigned shards per node.
Metrics:
sum(elasticsearch_cluster_health_delayed_unassigned_shards{cluster="elasticsearch"})/count(elasticsearch_index_stats_up)
Graph visual
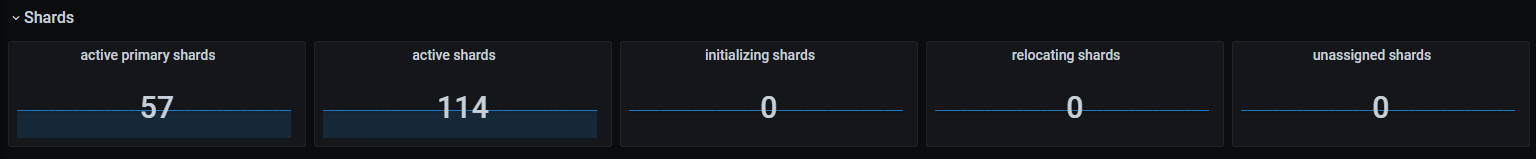
System graphs
System related graphs.
CPU usage
Percentage of used CPU on master and data nodes.
Metrics:
It includes two metrics:
elasticsearch_process_cpu_percent{cluster="elasticsearch",es_master_node="true",name=~"(elasticsearch-es-aura-0|elasticsearch-es-aura-1|elasticsearch-es-aura-2)"}
elasticsearch_process_cpu_percent{cluster="elasticsearch",es_data_node="true",name=~"(elasticsearch-es-aura-0|elasticsearch-es-aura-1|elasticsearch-es-aura-2)"}
JVM memory usage
Memory used by JVM graph in bytes.
Metrics:
It includes three metrics:
elasticsearch_jvm_memory_used_bytes{cluster="elasticsearch",name=~"(elasticsearch-es-aura-0|elasticsearch-es-aura-1|elasticsearch-es-aura-2)",name=~"(elasticsearch-es-aura-0|elasticsearch-es-aura-1|elasticsearch-es-aura-2)"}
elasticsearch_jvm_memory_committed_bytes{cluster="elasticsearch",name=~"(elasticsearch-es-aura-0|elasticsearch-es-aura-1|elasticsearch-es-aura-2)",name=~"(elasticsearch-es-aura-0|elasticsearch-es-aura-1|elasticsearch-es-aura-2)"}
elasticsearch_jvm_memory_max_bytes{cluster="elasticsearch",name=~"(elasticsearch-es-aura-0|elasticsearch-es-aura-1|elasticsearch-es-aura-2)",name=~"(elasticsearch-es-aura-0|elasticsearch-es-aura-1|elasticsearch-es-aura-2)"}
Disk usage
Disk usage in bytes.
Metrics:
1-(elasticsearch_filesystem_data_available_bytes{cluster="elasticsearch"}/elasticsearch_filesystem_data_size_bytes{cluster="elasticsearch",name=~"(elasticsearch-es-aura-0|elasticsearch-es-aura-1|elasticsearch-es-aura-2)"})
Network usage
Bytes rate sent and received, aggregated by one minute.
Metrics:
It includes two metrics:
irate(elasticsearch_transport_tx_size_bytes_total{cluster="elasticsearch",name=~"(elasticsearch-es-aura-0|elasticsearch-es-aura-1|elasticsearch-es-aura-2)"}[1m])
irate(elasticsearch_transport_rx_size_bytes_total{cluster="elasticsearch",name=~"(elasticsearch-es-aura-0|elasticsearch-es-aura-1|elasticsearch-es-aura-2)"}[1m])
Graph visual
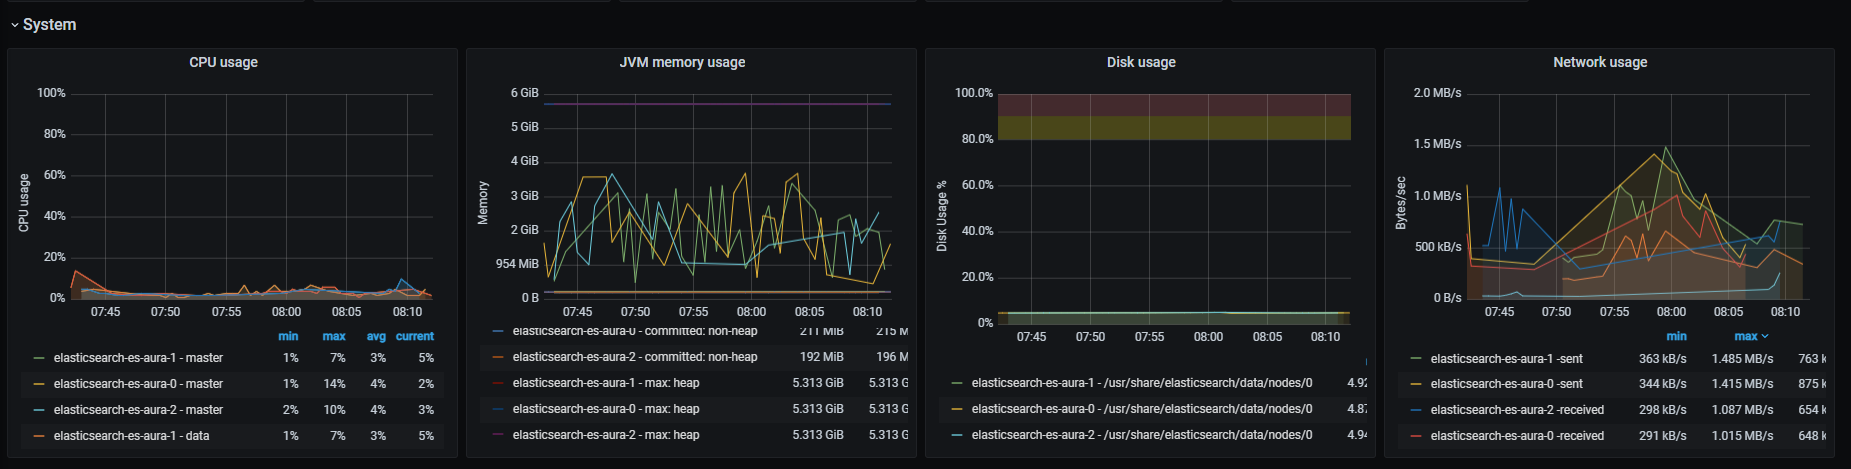
Documents graphs
Documents state related graphs.
Documents count
Number of documents in cluster.
Metrics:
elasticsearch_indices_docs{cluster="elasticsearch",name=~"(elasticsearch-es-aura-0|elasticsearch-es-aura-1|elasticsearch-es-aura-2)"}
Documents indexed rate
Rate of indexed documents, aggregated by one minute.
Metrics:
irate(elasticsearch_indices_indexing_index_total{cluster="elasticsearch",name=~"(elasticsearch-es-aura-0|elasticsearch-es-aura-1|elasticsearch-es-aura-2)"}[1m])
Documents deleted rate
Rate of deleted documents, aggregated by one minute.
Metrics:
rate(elasticsearch_indices_docs_deleted{cluster="elasticsearch",name=~"(elasticsearch-es-aura-0|elasticsearch-es-aura-1|elasticsearch-es-aura-2)"}[1m])
Documents merged rate
Rate of merged documents, aggregated by one minute.
Metrics:
rate(elasticsearch_indices_merges_total{cluster="elasticsearch",name=~"(elasticsearch-es-aura-0|elasticsearch-es-aura-1|elasticsearch-es-aura-2)"}[1m])
Graph visual
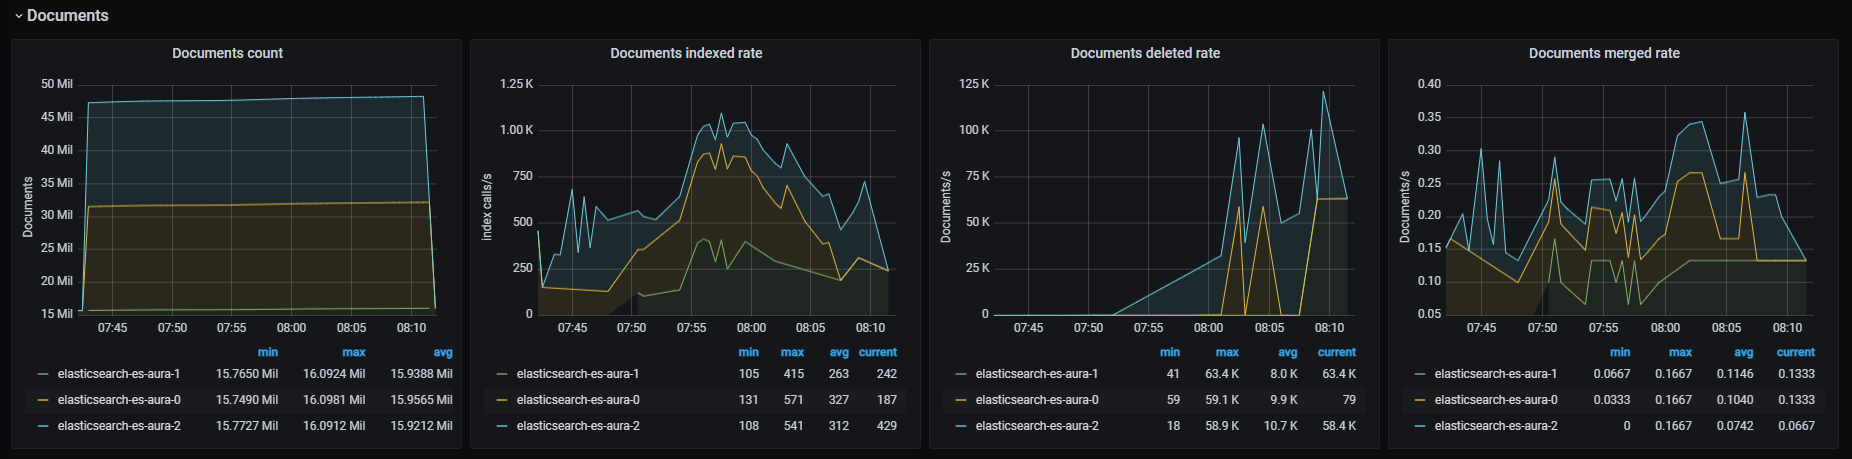
Total operations stats graphs
Data related to total operations.
Total operations rate
Total operations number rate, aggregated by one minute.
Metrics:
It includes six metrics:
irate(elasticsearch_indices_indexing_index_total{cluster="elasticsearch",name=~"(elasticsearch-es-aura-0|elasticsearch-es-aura-1|elasticsearch-es-aura-2)"}[1m])
irate(elasticsearch_indices_search_query_total{cluster="elasticsearch",name=~"(elasticsearch-es-aura-0|elasticsearch-es-aura-1|elasticsearch-es-aura-2)"}[1m])
irate(elasticsearch_indices_search_fetch_total{cluster="elasticsearch",name=~"(elasticsearch-es-aura-0|elasticsearch-es-aura-1|elasticsearch-es-aura-2)"}[1m])
irate(elasticsearch_indices_merges_total{cluster="elasticsearch",name=~"(elasticsearch-es-aura-0|elasticsearch-es-aura-1|elasticsearch-es-aura-2)"}[1m])
irate(elasticsearch_indices_refresh_total{cluster="elasticsearch",name=~"(elasticsearch-es-aura-0|elasticsearch-es-aura-1|elasticsearch-es-aura-2)"}[1m])
irate(elasticsearch_indices_flush_total{cluster="elasticsearch",name=~"(elasticsearch-es-aura-0|elasticsearch-es-aura-1|elasticsearch-es-aura-2)"}[1m])
Total operations time
Time rate for the different operations in milliseconds, aggregated by one minute.
Metrics:
It includes six metrics:
irate(elasticsearch_indices_indexing_index_time_seconds_total{cluster="elasticsearch",name=~"(elasticsearch-es-aura-0|elasticsearch-es-aura-1|elasticsearch-es-aura-2)"}[1m])
irate(elasticsearch_indices_search_query_time_ms_total{cluster="elasticsearch",name=~"(elasticsearch-es-aura-0|elasticsearch-es-aura-1|elasticsearch-es-aura-2)"}[1m])
irate(elasticsearch_indices_search_fetch_time_ms_total{cluster="elasticsearch",name=~"(elasticsearch-es-aura-0|elasticsearch-es-aura-1|elasticsearch-es-aura-2)"}[1m])
irate(elasticsearch_indices_merges_total_time_ms_total{cluster="elasticsearch",name=~"(elasticsearch-es-aura-0|elasticsearch-es-aura-1|elasticsearch-es-aura-2)"}[1m])
irate(elasticsearch_indices_refresh_total_time_ms_total{cluster="elasticsearch",name=~"(elasticsearch-es-aura-0|elasticsearch-es-aura-1|elasticsearch-es-aura-2)"}[1m])
irate(elasticsearch_indices_flush_time_ms_total{cluster="elasticsearch",name=~"(elasticsearch-es-aura-0|elasticsearch-es-aura-1|elasticsearch-es-aura-2)"}[1m])
Graph visual
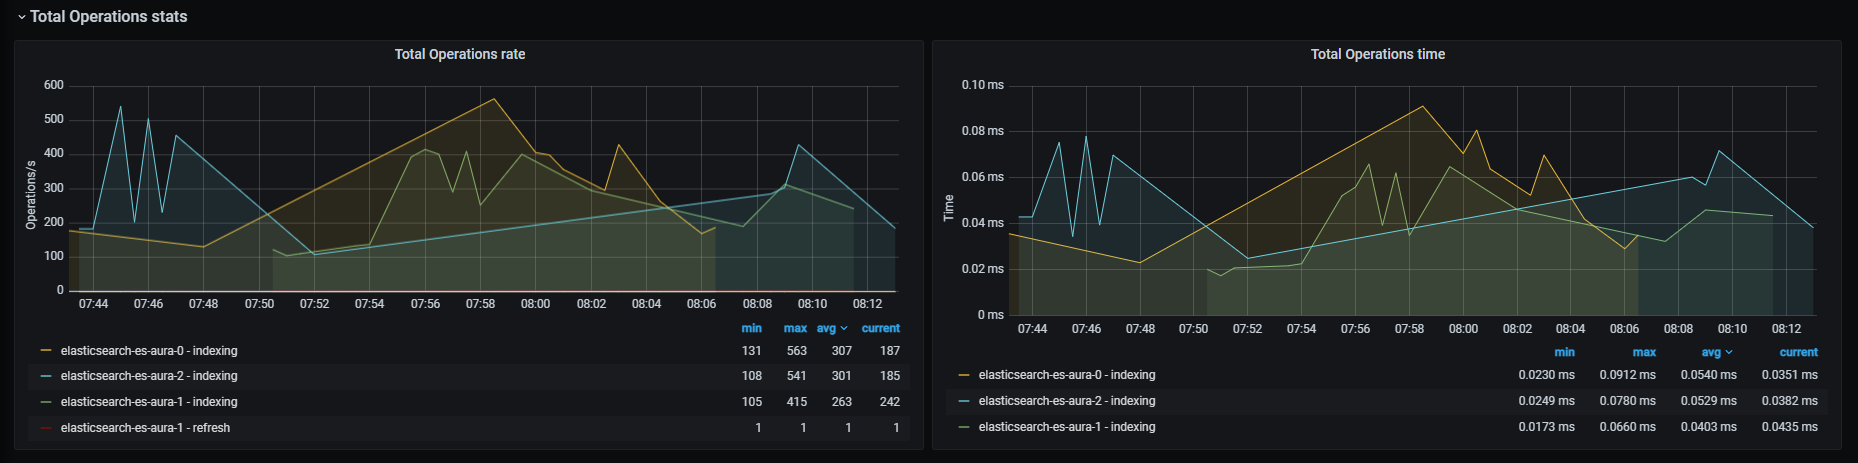
Elasticsearch times graphs
Graphs related to elapsed times of different actions.
Query time
Time rate for search query operations in seconds, aggregated by one minute.
Metrics:
rate(elasticsearch_indices_search_query_time_seconds{cluster="elasticsearch",name=~"(elasticsearch-es-aura-0|elasticsearch-es-aura-1|elasticsearch-es-aura-2)"}[1m])
Indexing time
Time rate for indexing index operations in seconds, aggregated by one minute.
Metrics:
rate(elasticsearch_indices_indexing_index_time_seconds_total{cluster="elasticsearch",name=~"(elasticsearch-es-aura-0|elasticsearch-es-aura-1|elasticsearch-es-aura-2)"}[1m])
Merging time
Time rate for merge operations in seconds, aggregated by one minute.
Metrics:
rate(elasticsearch_indices_merges_total_time_seconds_total{cluster="elasticsearch",name=~"(elasticsearch-es-aura-0|elasticsearch-es-aura-1|elasticsearch-es-aura-2)"}[1m])
Caches graphs
Graphs related to caches metrics.
Field data memory size
Field data memory size in bytes.
Metrics:
elasticsearch_indices_fielddata_memory_size_bytes{cluster="elasticsearch",name=~"(elasticsearch-es-aura-0|elasticsearch-es-aura-1|elasticsearch-es-aura-2)"}
Field data evictions
Rate of field data evicted, aggregated by one minute.
Metrics:
rate(elasticsearch_indices_fielddata_evictions{cluster="elasticsearch",name=~"(elasticsearch-es-aura-0|elasticsearch-es-aura-1|elasticsearch-es-aura-2)"}[1m])
Query cache size
Bytes of memory occupied by cached queries.
Metrics:
elasticsearch_indices_query_cache_memory_size_bytes{cluster="elasticsearch",name=~"(elasticsearch-es-aura-0|elasticsearch-es-aura-1|elasticsearch-es-aura-2)"}
Query cache evictions
Rate of queries evicted, aggregated by one minute.
Metrics:
rate(elasticsearch_indices_query_cache_evictions{cluster="elasticsearch",name=~"(elasticsearch-es-aura-0|elasticsearch-es-aura-1|elasticsearch-es-aura-2)"}[1m])
Graph visual
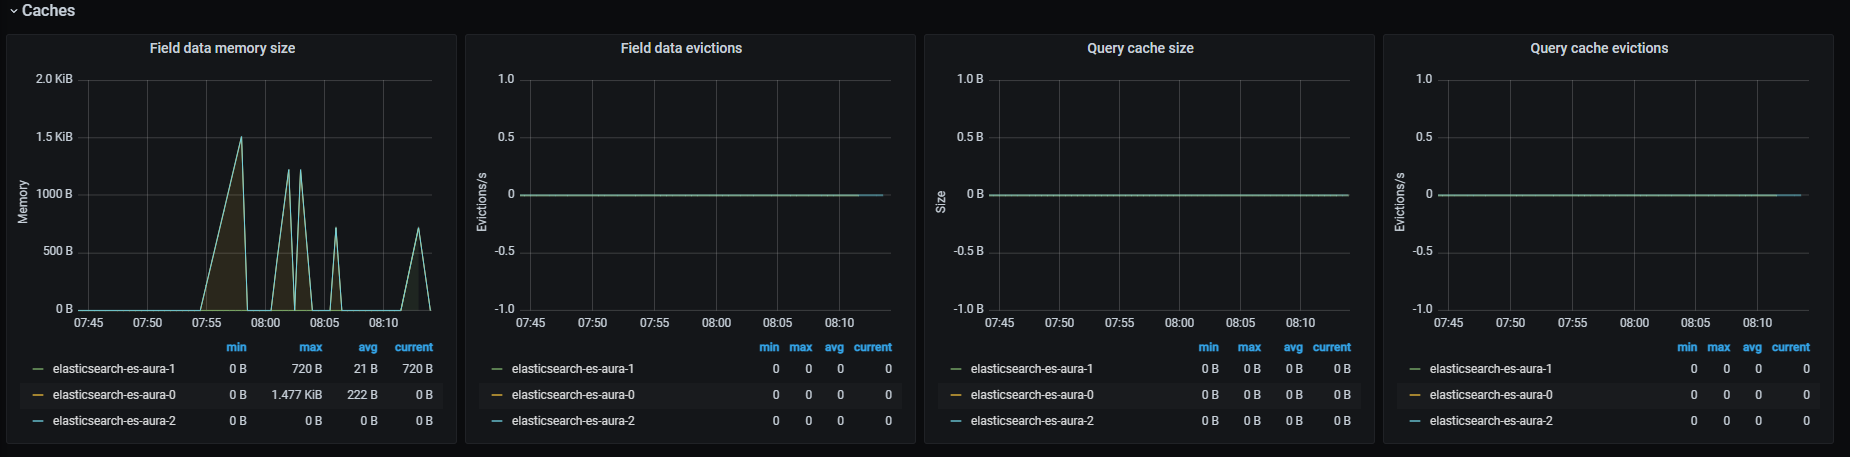
Thread pool graphs
Graphs related to the thread pool.
Operations rejected
Rate of rejected operations, aggregated by one minute.
Metrics:
irate(elasticsearch_thread_pool_rejected_count{cluster="elasticsearch",name=~"(elasticsearch-es-aura-0|elasticsearch-es-aura-1|elasticsearch-es-aura-2)"}[1m])
Operations queued
Rate of queued operations, aggregated by one minute.
Metrics:
elasticsearch_thread_pool_active_count{cluster="elasticsearch",name=~"(elasticsearch-es-aura-0|elasticsearch-es-aura-1|elasticsearch-es-aura-2)"}
Threads active
Number of active threads.
Metrics:
elasticsearch_thread_pool_active_count{cluster="elasticsearch",name=~"(elasticsearch-es-aura-0|elasticsearch-es-aura-1|elasticsearch-es-aura-2)"}
Operations completed
Shows rate of completed operations, aggregated by one minute
Metrics:
irate(elasticsearch_thread_pool_completed_count{cluster="elasticsearch",name=~"(elasticsearch-es-aura-0|elasticsearch-es-aura-1|elasticsearch-es-aura-2)"}[1m])
Graph visual
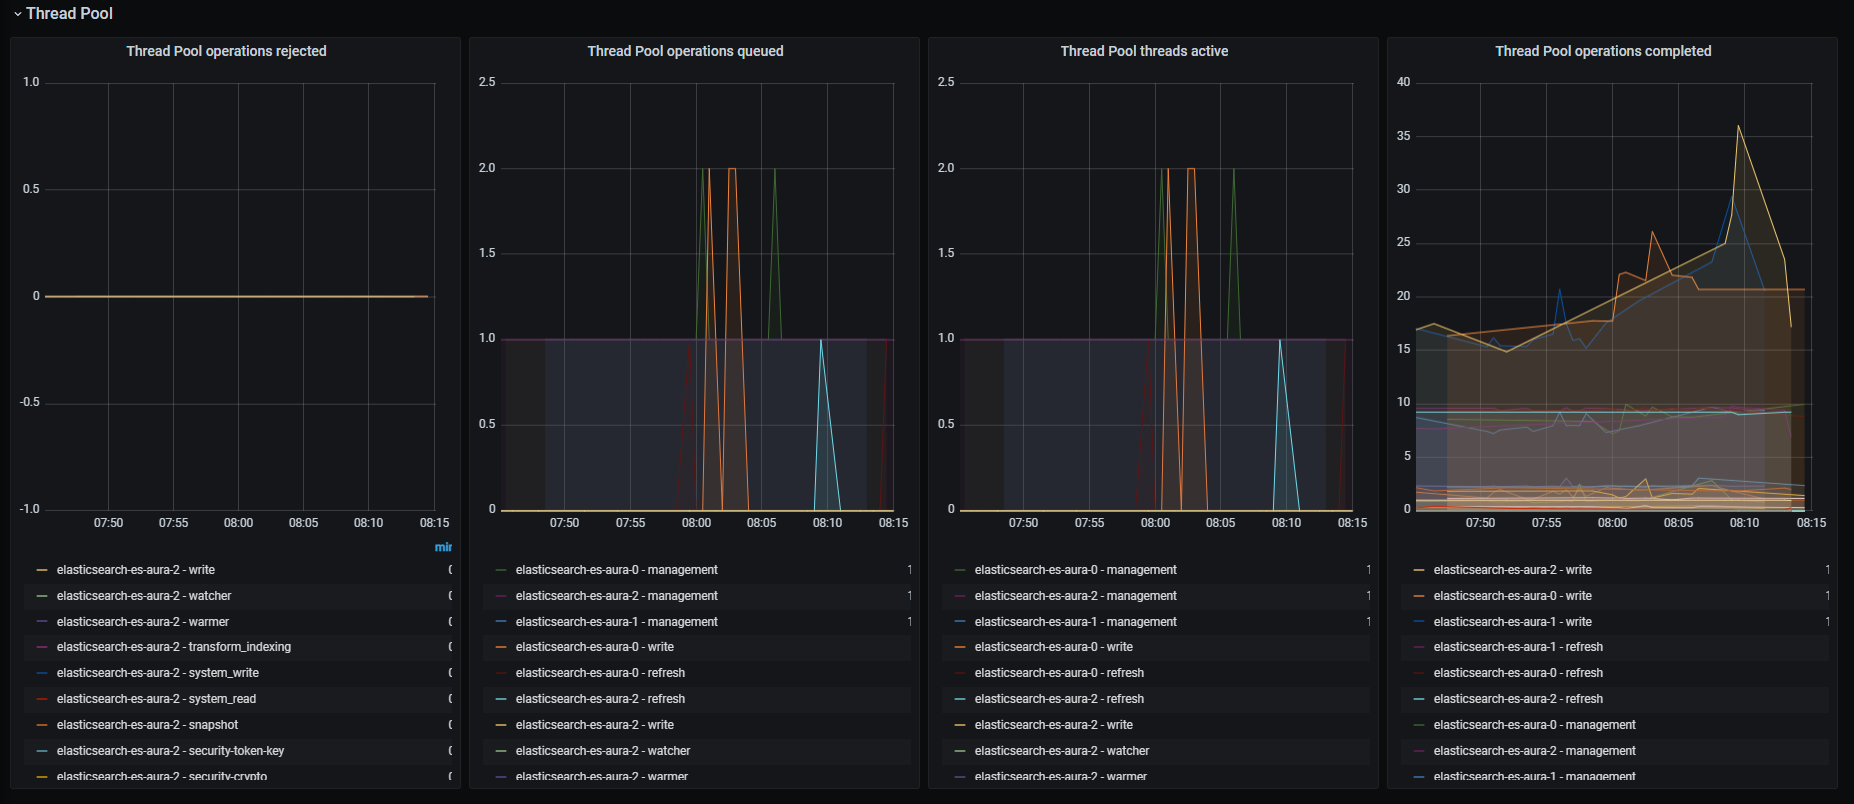
JVM Garbage collection graphs
Graphs related to JVM garbage collector activity.
GC count
Rate of GC count, aggregated by one minute.
Metrics:
rate(elasticsearch_jvm_gc_collection_seconds_count{cluster="elasticsearch",name=~"(elasticsearch-es-aura-0|elasticsearch-es-aura-1|elasticsearch-es-aura-2)"}[1m])
GC time
Rate of GC execution time, aggregated by one minute.
Metrics:
rate(elasticsearch_jvm_gc_collection_seconds_count{cluster="elasticsearch",name=~"(elasticsearch-es-aura-0|elasticsearch-es-aura-1|elasticsearch-es-aura-2)"}[1m])
Graph visual
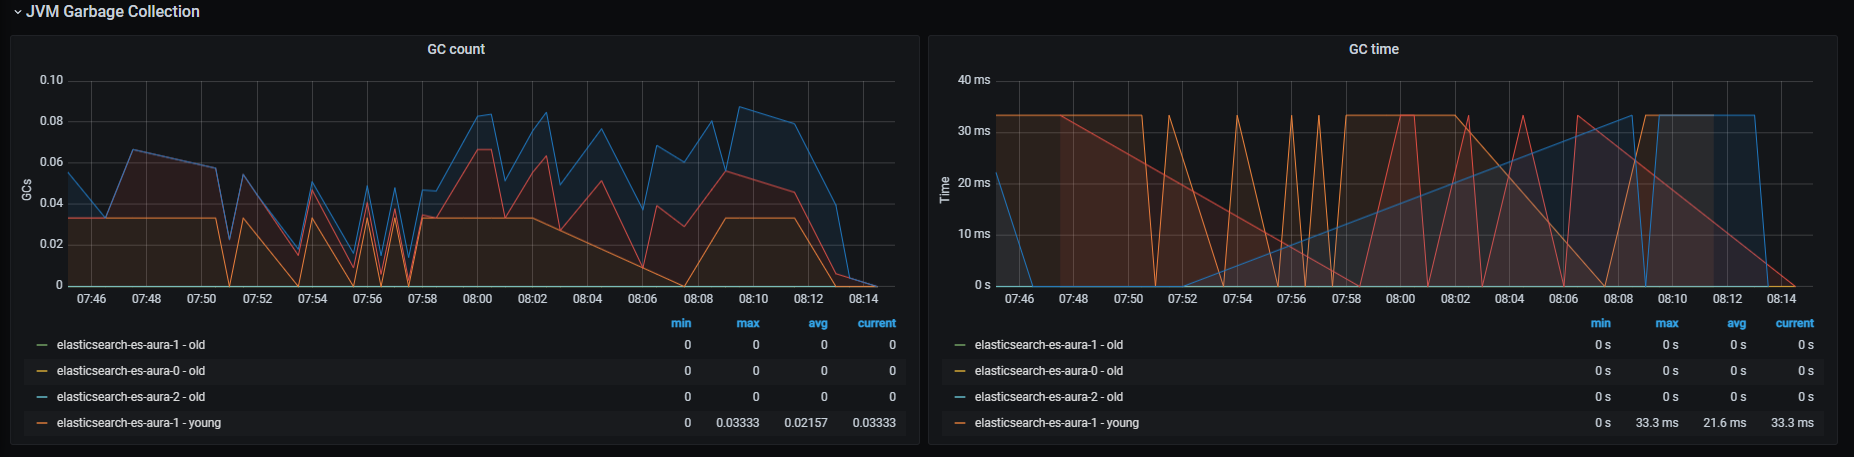
6.1.3 - Fluent bit dashboard
Fluent bit dashboard
Information provided by Fluent bit dashboard
Introduction
Fluent bit dashboard monitors system metrics related to fluent bit.
The available metrics are defined in the following sections.
Input bytes rate, aggregated by one minute.
Metrics:
rate(fluentbit_input_bytes_total[1m])
Graph visual
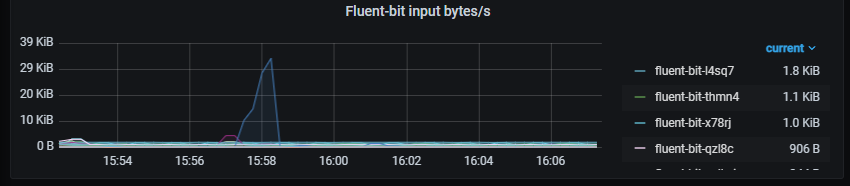
Output bytes
Output bytes rate, aggregated by one minute.
Metrics:
rate(fluentbit_output_proc_bytes_total[1m])
Graph visual
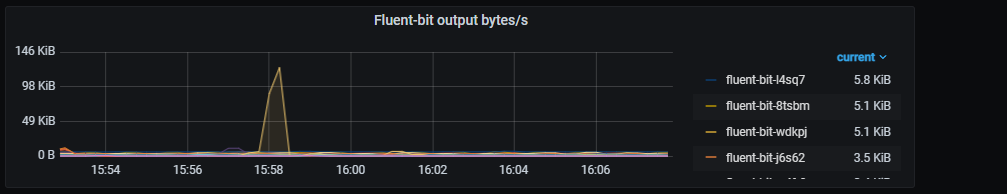
Retries/fails
Rate of retries and fails, aggregated by one minute
Metrics:
It includes two metrics:
rate(fluentbit_output_retries_total[1m])
rate(fluentbit_output_retries_failed_total[1m])
Graph visual
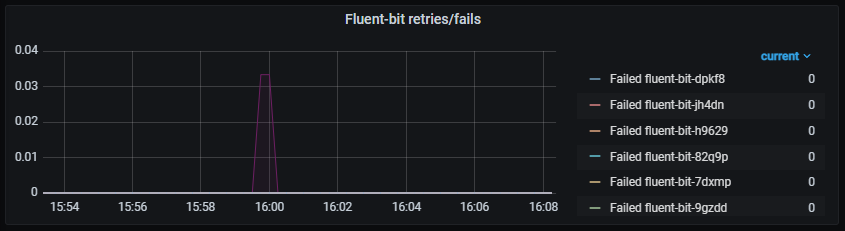
Errors
Rate of output errors, aggregated by one minute.
Metrics:
rate(fluentbit_output_errors_total[1m])
Graph visual
6.1.4 - Kubernetes cluster monitoring dashboard
Kubernetes cluster monitoring dashboard
Information provided by Kubernetes cluster monitoring dashboard
Introduction
Kubernetes cluster monitoring dashboard monitors multiple systems and networks related data from Kubernetes clusters.
The available metrics are defined in the following sections.
Network I/O pressure graph
Rate of total received/sent data on all cluster containers, in bytes and aggregated by one minute.
Metrics:
It includes two metrics:
sum (rate (container_network_receive_bytes_total{kubernetes_io_hostname=~"^.*$",agentpool=~".*"}[1m]))
- Sent bytes (negative value)
- sum (rate (container_network_transmit_bytes_total{kubernetes_io_hostname=~"^.*$",agentpool=~".*"}[1m]))
Graph visual
Total usage
Graphs with different system parameters usage.
Cluster memory usage
It is composed by three graphs:
- Memory usage, showing percentage of used memory
- Used, showing used memory
- Total, showing total memory
Metrics:
It includes three metrics:
sum (container_memory_working_set_bytes{id="/",kubernetes_io_hostname=~"^.*$",agentpool=~".*"}) /
sum (machine_memory_bytes{kubernetes_io_hostname=~"^.*$",agentpool=~".*"}) * 100
sum (container_memory_working_set_bytes{id="/",kubernetes_io_hostname=~"^.*$",agentpool=~".*"})
sum (machine_memory_bytes{kubernetes_io_hostname=~"^.*$",agentpool=~".*"})
Cluster CPU usage
It is composed by three graphs:
- CPU usage, showing percentage of used CPU cores, aggregated by one minute
- Used, showing used CPU cores, aggregated by one minute
- Total, showing total CPU cores
Metrics:
It includes three metrics:
sum (rate (container_cpu_usage_seconds_total{id="/",kubernetes_io_hostname=~"^.*$",agentpool=~".*"}[1m])) /
sum (machine_cpu_cores{kubernetes_io_hostname=~"^.*$",agentpool=~".*"}) * 100
sum (rate (container_cpu_usage_seconds_total{id="/",kubernetes_io_hostname=~"^.*$",agentpool=~".*"}[1m]))
sum (machine_cpu_cores{kubernetes_io_hostname=~"^.*$",agentpool=~".*"})
Cluster filesystem usage
It is composed by three graphs:
- Filesystem usage, showing percentage of used filesystem space
- Used, showing used filesystem space
- Total, showing total filesystem space
Metrics:
It includes three metrics:
sum (container_fs_usage_bytes{device=~"^/dev/.*$",id="/",kubernetes_io_hostname=~"^.*$",agentpool=~".*"}) /
sum (container_fs_limit_bytes{device=~"^/dev/.*$",id="/",kubernetes_io_hostname=~"^.*$",agentpool=~".*"}) * 100
sum (container_fs_usage_bytes{device=~"^/dev/.*$",id="/",kubernetes_io_hostname=~"^.*$",agentpool=~".*"})
sum (container_fs_limit_bytes{device=~"^/dev/.*$",id="/",kubernetes_io_hostname=~"^.*$",agentpool=~".*"})
Graph visual
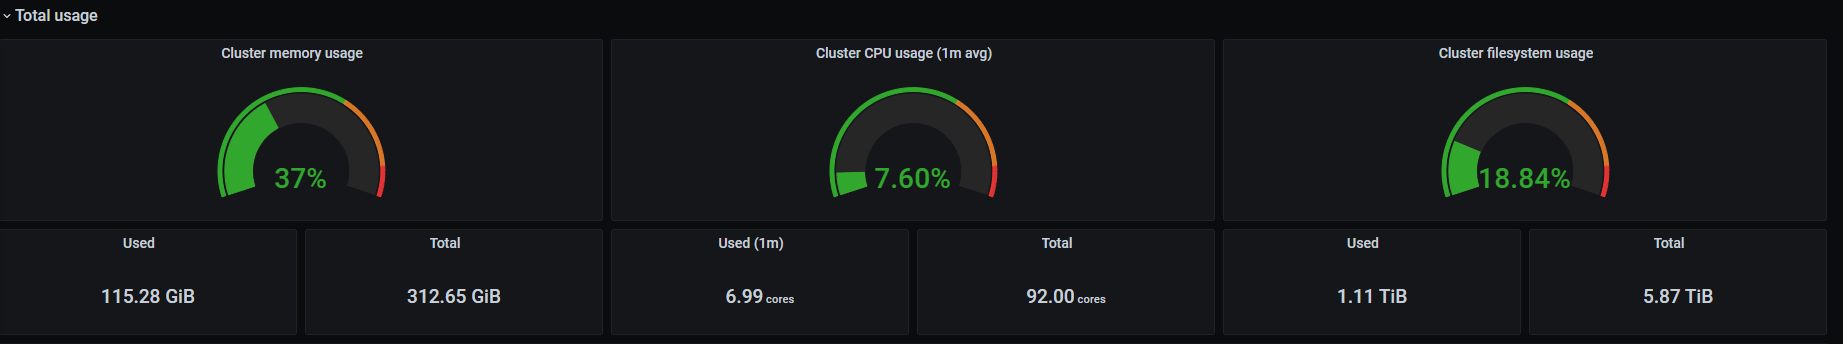
Pods CPU usage
CPU usage rate, classified by pod and aggregated by one minute.
Metrics:
sum (rate (container_cpu_usage_seconds_total{image!="",name=~"^k8s_.*",kubernetes_io_hostname=~"^.*$",agentpool=~".*"}[1m])) by (pod_name)
Graph visual
Containers CPU usage
CPU usage rate, classified by container and aggregated by one minute.
Metrics:
It includes two metrics:
sum (rate (container_cpu_usage_seconds_total{image!="",name=~"^k8s_.*",kubernetes_io_hostname=~"^.*$",agentpool=~".*"}[1m])) by (pod_name)
- Containers without “k8s_”
sum (rate (container_cpu_usage_seconds_total{image!="",name!~"^k8s_.*",kubernetes_io_hostname=~"^.*$",agentpool=~".*"}[1m])) by (kubernetes_io_hostname, name, image)
Graph visual
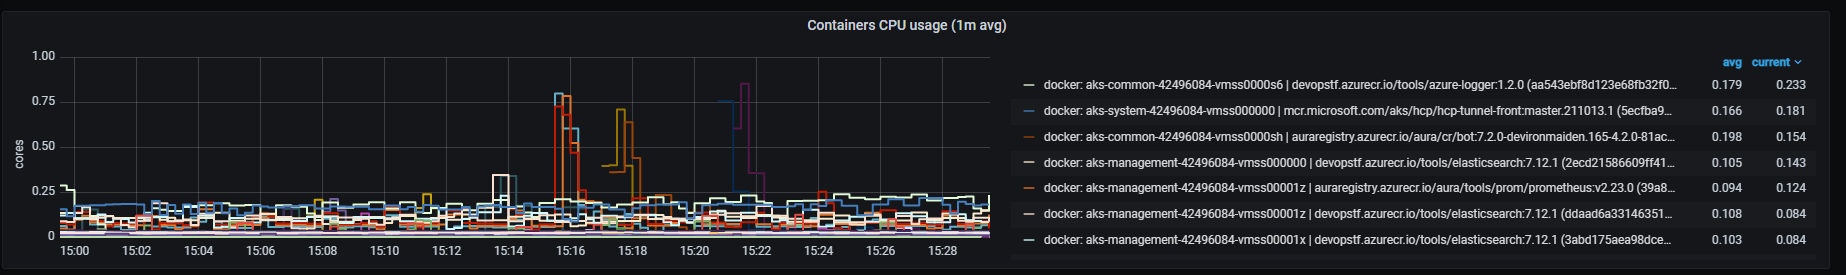
All processes CPU usage
Total CPU usage rate, aggregated by one minute.
Metrics:
sum (rate (container_cpu_usage_seconds_total{id!="/",kubernetes_io_hostname=~"^.*$",agentpool=~".*"}[1m])) by (id)
Graph visual
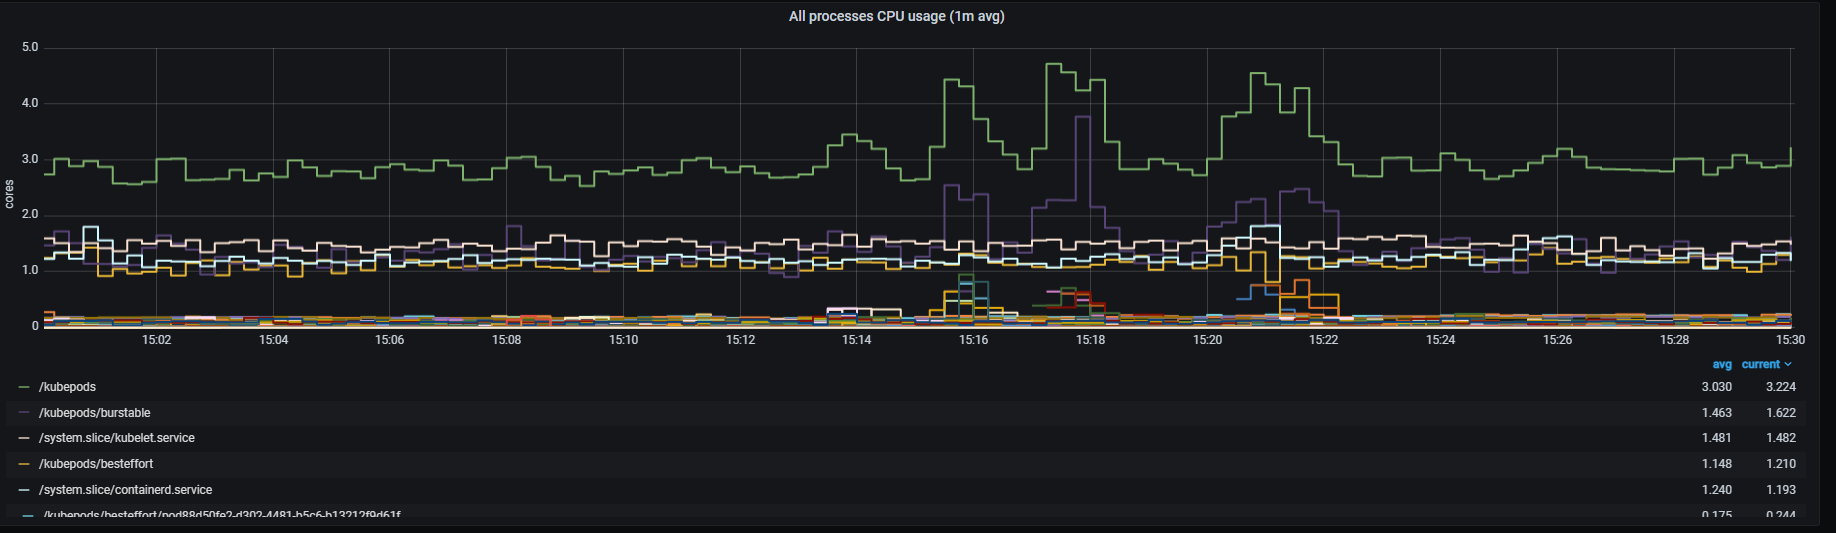
Pods memory usage
Memory usage, classified by pod.
Metrics:
sum (container_memory_working_set_bytes{image!="",name=~"^k8s_.*",kubernetes_io_hostname=~"^.*$",agentpool=~".*"}) by (pod_name)
Graph visual
Containers memory usage
Memory usage, classified by container.
Metrics:
It includes two metrics:
sum (container_memory_working_set_bytes{image!="",name=~"^k8s_.*",container_name!="POD",kubernetes_io_hostname=~"^.*$",agentpool=~".*"}) by (container_name, pod_name)
- Containers without “k8s_”
sum (container_memory_working_set_bytes{image!="",name!~"^k8s_.*",kubernetes_io_hostname=~"^.*$",agentpool=~".*"}) by (kubernetes_io_hostname, name, image)
Graph visual
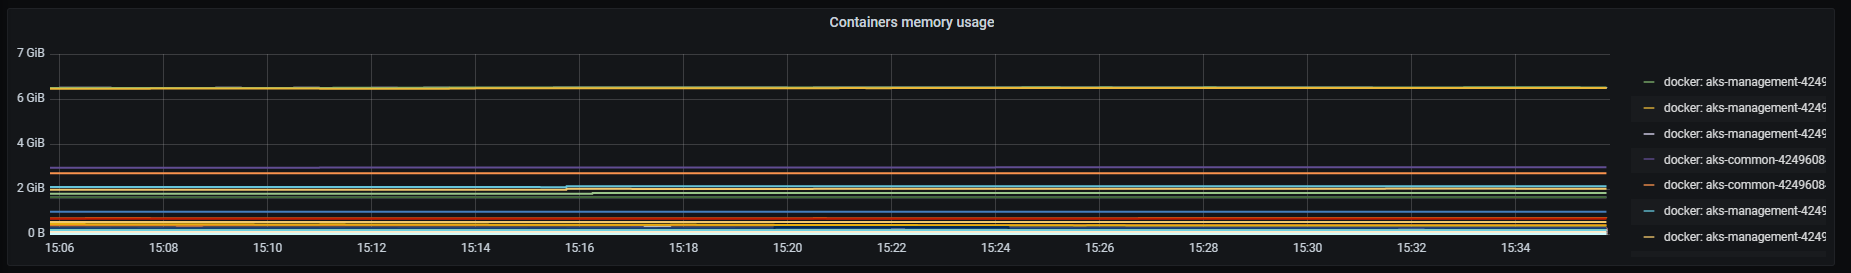
All processes memory usage
Total memory usage rate.
Metrics:
sum (container_memory_working_set_bytes{pod_name!="",kubernetes_io_hostname=~"^.*$",agentpool=~".*"}) by (pod_name)
Graph visual
Pods network I/O
Total network received/sent usage rate, classified by pod and aggregated by one minute.
Metrics:
sum (rate (container_network_receive_bytes_total{image!="",name=~"^k8s_.*",kubernetes_io_hostname=~"^.*$",agentpool=~".*"}[1m])) by (pod_name)
- sum (rate (container_network_transmit_bytes_total{image!="",name=~"^k8s_.*",kubernetes_io_hostname=~"^.*$",agentpool=~".*"}[1m])) by (pod_name)
Graph visual
Containers network I/O
Total network received/sent usage rate, classified by container and aggregated by one minute.
Metrics:
- Received bytes, containers with “k8s_”
sum (rate (container_network_receive_bytes_total{image!="",name=~"^k8s_.*",kubernetes_io_hostname=~"^.*$",agentpool=~".*"}[1m])) by (container_name, pod_name)
- Sent bytes, containers with “k8s_”
- sum (rate (container_network_transmit_bytes_total{image!="",name=~"^k8s_.*",kubernetes_io_hostname=~"^.*$",agentpool=~".*"}[1m])) by (container_name, pod_name)
- Received bytes, containers without “k8s_”
sum (rate (container_network_receive_bytes_total{image!="",name!~"^k8s_.*",kubernetes_io_hostname=~"^.*$",agentpool=~".*"}[1m])) by (kubernetes_io_hostname, name, image)
- Sent bytes, containers without “k8s_”
- sum (rate (container_network_transmit_bytes_total{image!="",name!~"^k8s_.*",kubernetes_io_hostname=~"^.*$",agentpool=~".*"}[1m])) by (kubernetes_io_hostname, name, image)
Graph visual
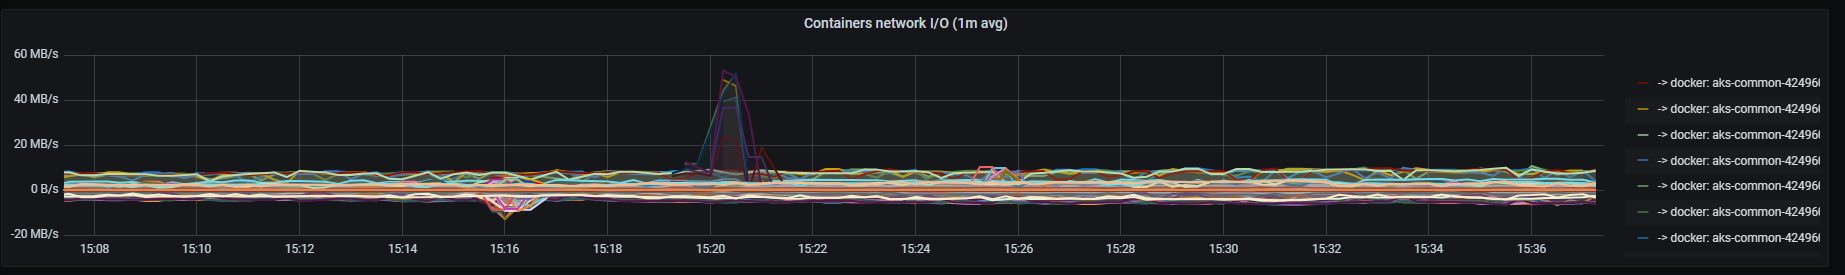
All processes network I/O
Total network received/sent usage rate, aggregated by one minute.
Metrics:
sum (rate (container_network_receive_bytes_total{pod_name!="",kubernetes_io_hostname=~"^.*$",agentpool=~".*"}[1m])) by (pod_name)
- sum (rate (container_network_transmit_bytes_total{pod_name!="",kubernetes_io_hostname=~"^.*$",agentpool=~".*"}[1m])) by (pod_name)
Graph visual
Pods disk I/O
Total disk reads/writes rate, classified by pod and aggregated by one minute.
Metrics:
- Read bytes, pods without device
sum(rate(container_fs_reads_bytes_total{image!="",name=~"^k8s_.*",kubernetes_io_hostname=~"^.*$",agentpool=~".*", device!=""}[1m])) by (pod_name)
- Written bytes, pods without device
sum(rate(container_fs_writes_bytes_total{image!="",name=~"^k8s_.*",kubernetes_io_hostname=~"^.*$",agentpool=~".*", device!=""}[1m])) by (pod_name)
- Read bytes, pods with device
sum(rate(container_fs_reads_bytes_total{image!="",name=~"^k8s_.*",kubernetes_io_hostname=~"^.*$",agentpool=~".*", device=""}[1m])) by (pod_name)
- Written bytes, pods with device
sum(rate(container_fs_writes_bytes_total{image!="",name=~"^k8s_.*",kubernetes_io_hostname=~"^.*$",agentpool=~".*", device=""}[1m])) by (pod_name)
Graph visual
Containers disk I/O
Total disk reads/writes rate, classified by container and aggregated by one minute.
Metrics:
- Read bytes, containers without device
sum(rate(container_fs_reads_bytes_total{image!="",name=~"^k8s_.*",kubernetes_io_hostname=~"^.*$",agentpool=~".*", device!=""}[1m])) by (container_name, pod_name)
- Written bytes, containers without device
sum(rate(container_fs_writes_bytes_total{image!="",name=~"^k8s_.*",kubernetes_io_hostname=~"^.*$",agentpool=~".*", device!=""}[1m])) by (container_name, pod_name)
- Read bytes, containers with device
sum(rate(container_fs_reads_bytes_total{image!="",name=~"^k8s_.*",kubernetes_io_hostname=~"^.*$",agentpool=~".*", device=""}[1m])) by (container_name, pod_name)
- Written bytes, containers with device
sum(rate(container_fs_writes_bytes_total{image!="",name=~"^k8s_.*",kubernetes_io_hostname=~"^.*$",agentpool=~".*", device=""}[1m])) by (container_name, pod_name)
- Read bytes, containers without “k8s_”
sum(rate(container_fs_reads_bytes_total{image!="",name!~"^k8s_.*",kubernetes_io_hostname=~"^.*$",agentpool=~".*"}[1m])) by (kubernetes_io_hostname, name, image)
- Written bytes, containerswithout “k8s_”
sum(rate(container_fs_writes_bytes_total{image!="",name!~"^k8s_.*",kubernetes_io_hostname=~"^.*$",agentpool=~".*"}[1m])) by (kubernetes_io_hostname, name, image)
Graph visual
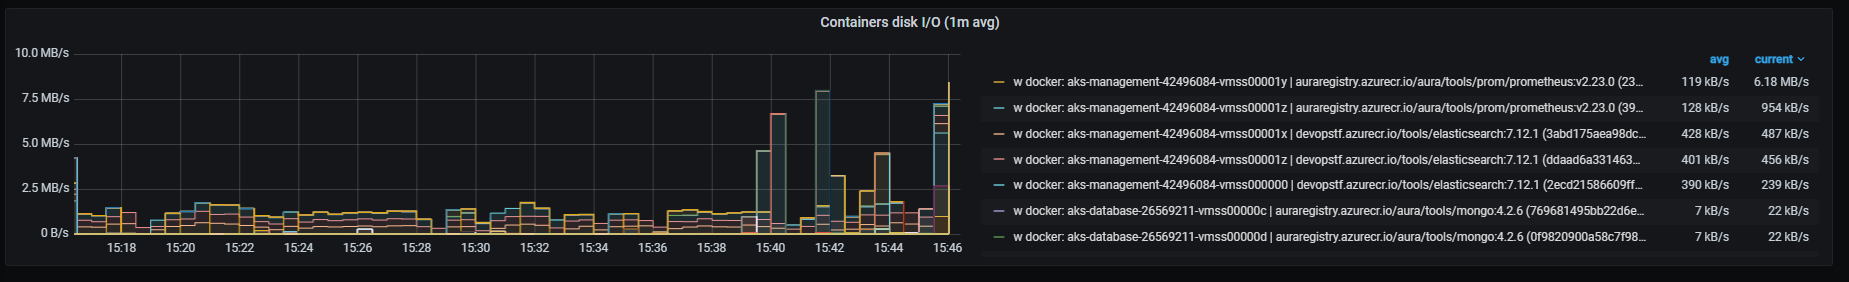
6.1.5 - Kubernetes cron and batch job monitoring dashboard
Kubernetes cron and batch job monitoring dashboard
Information provided by cron and batch job monitoring dashboard
Introduction
Kubernetes cron and batch job monitoring dashboard monitors success/fail rates for cron/batch jobs.
The available metrics are defined in the following sections.
Jobs succeeded
Successfully executed jobs.
Metrics:
kube_job_status_succeeded
Graph visual
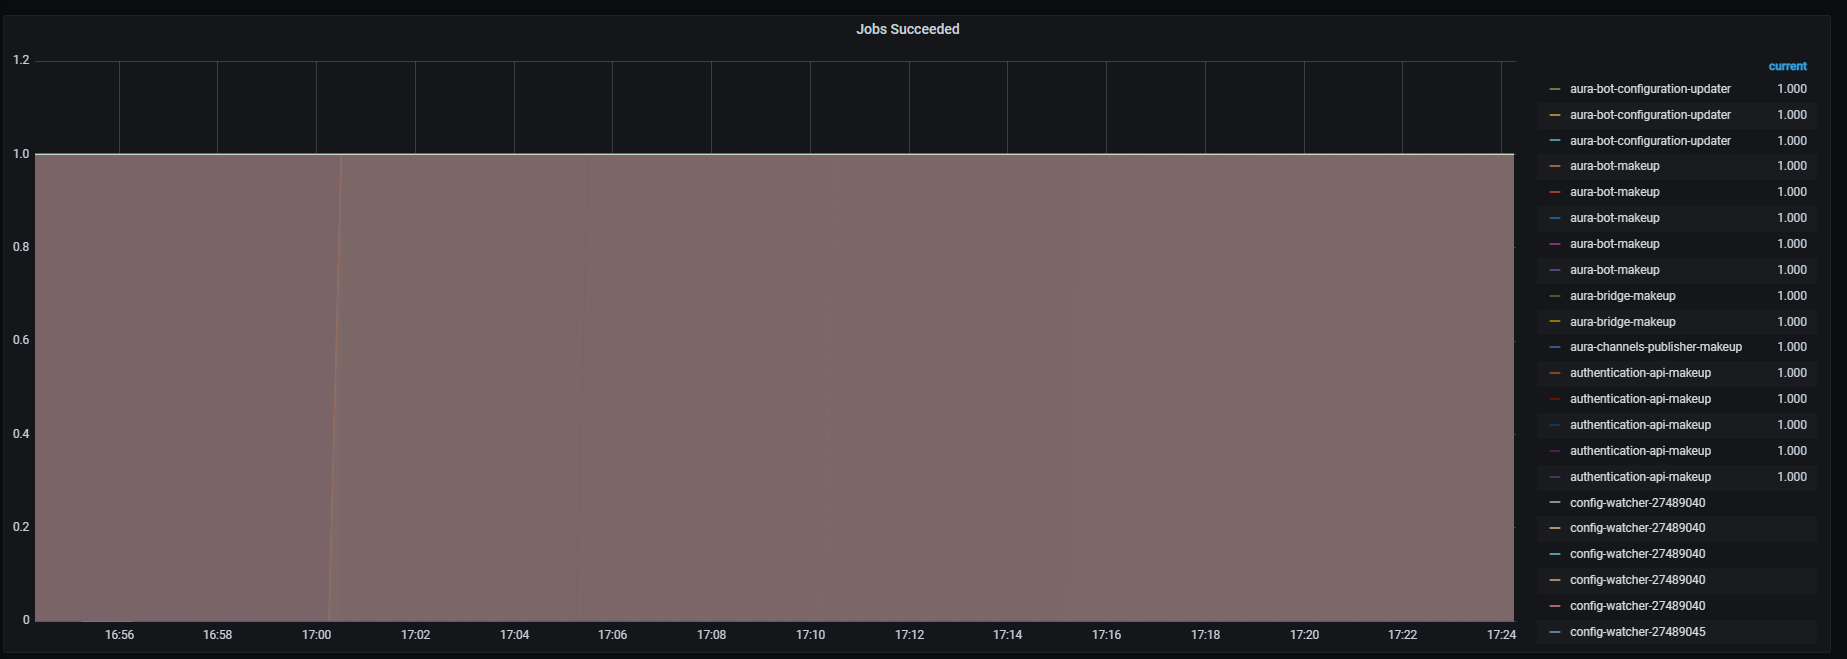
Jobs failed
Failed job executions.
Metrics:
Graph visual
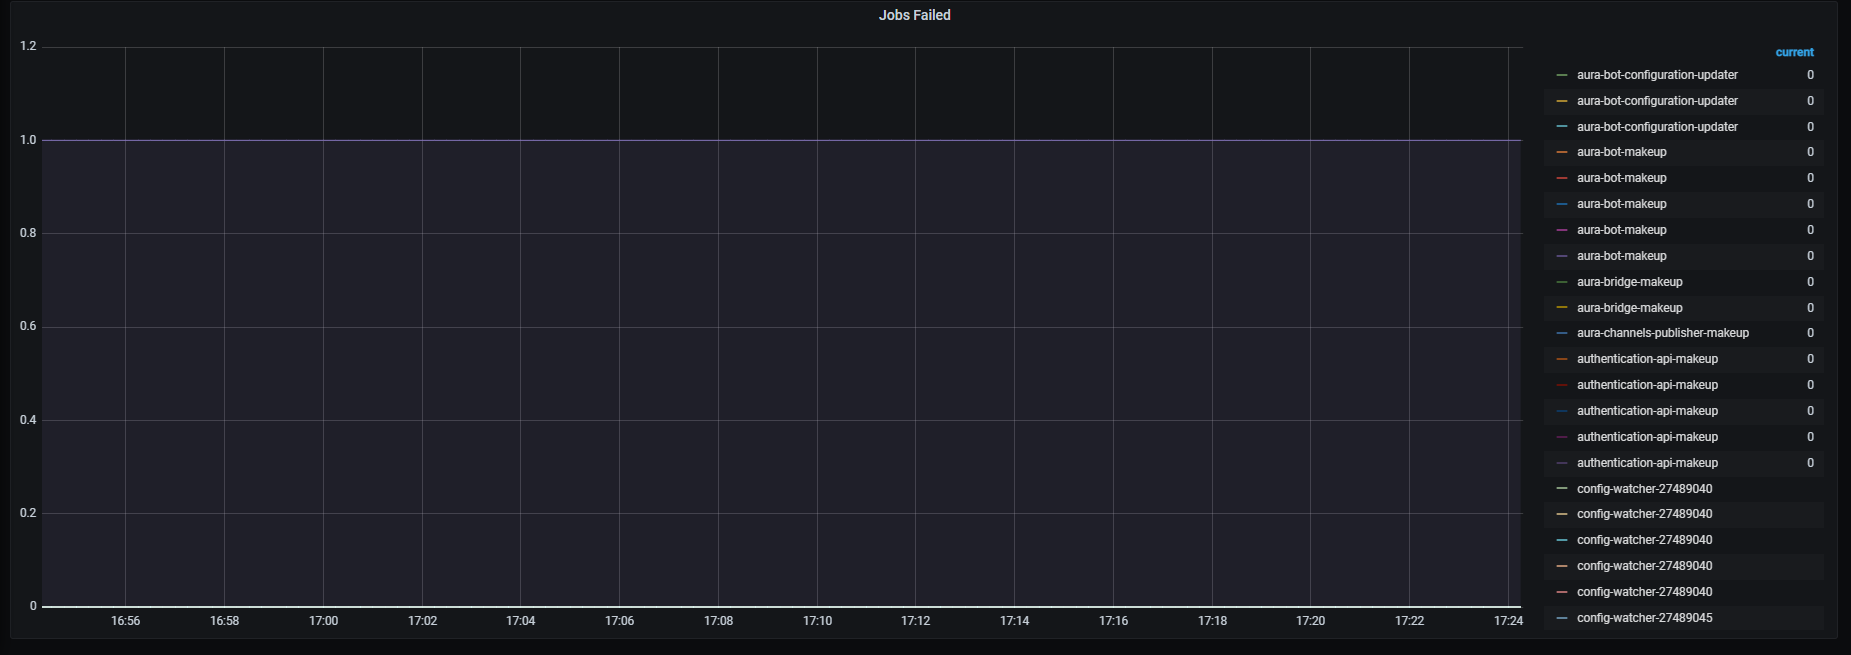
6.1.6 - Kubernetes nodes dashboard
Kubernetes nodes dashboard
Information provided by Kubernetes nodes dashboard
Introduction
Kubernetes nodes dashboard monitors nodes general system status.
The available metrics are defined in the following sections.
CPU usage
CPU usage percent rate, aggregated by one minute.
Metrics:
sum (rate (container_cpu_usage_seconds_total{id="/",kubernetes_io_hostname=~"^.*$",agentpool=~".*"}[1m])) by (kubernetes_io_hostname) / sum (machine_cpu_cores{kubernetes_io_hostname=~"^.*$",agentpool=~".*"}) by (kubernetes_io_hostname) * 100
Graph visual
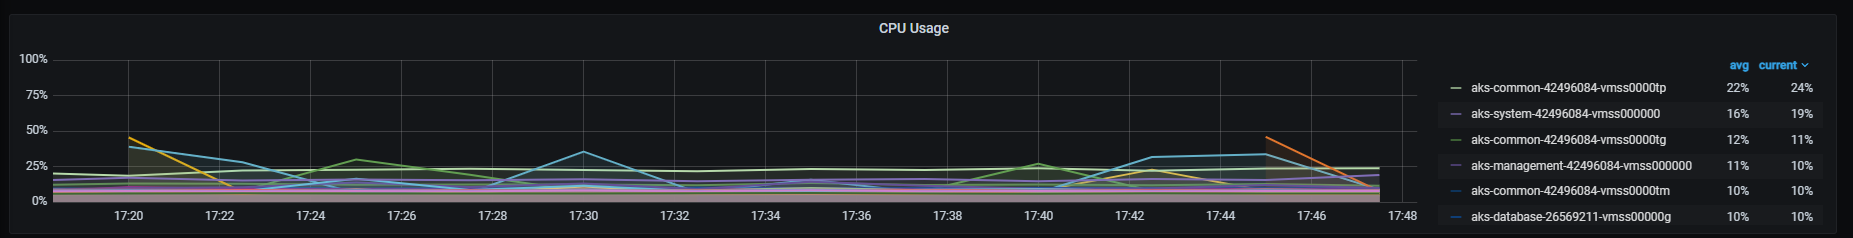
Memory usage
Memory usage percentage.
Metrics:
sum (container_memory_working_set_bytes{id="/", kubernetes_io_hostname=~"^.*$",agentpool=~".*"}) by (kubernetes_io_hostname) / sum (machine_memory_bytes{kubernetes_io_hostname=~"^.*$",agentpool=~".*"}) by (kubernetes_io_hostname) * 100
Graph visual
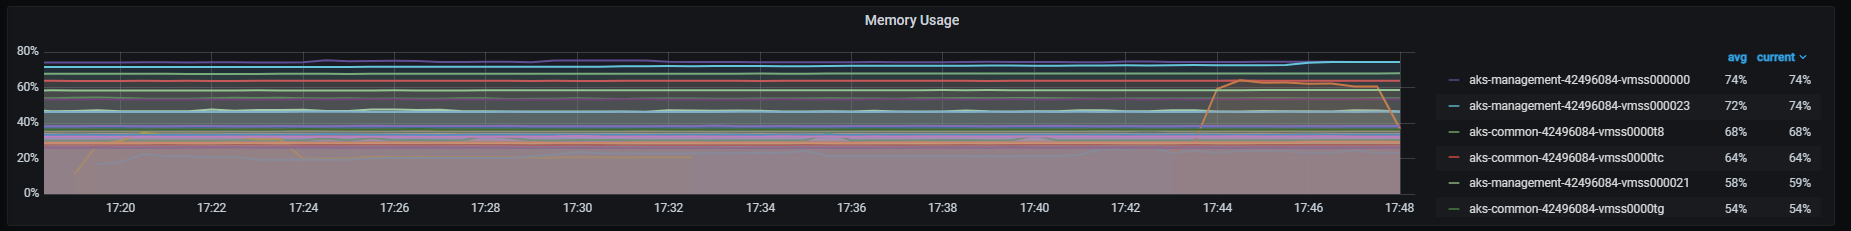
Disk I/O
Disk read/written data in bytes.
Metrics:
It includes two metrics:
sum (container_fs_reads_bytes_total{id="/", kubernetes_io_hostname=~"^.*$",agentpool=~".*"}) by (kubernetes_io_hostname)
sum (container_fs_writes_bytes_total{id="/", kubernetes_io_hostname=~"^.*$",agentpool=~".*"}) by (kubernetes_io_hostname)
Graph visual
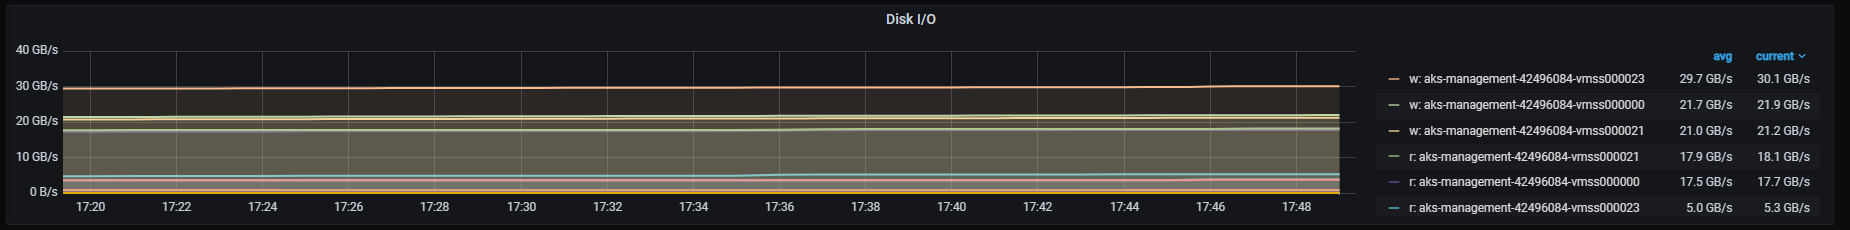
Network I/O
Network received/sent data in bytes, aggregated by one minute.
Metrics:
It includes two metrics:
sum (rate (container_network_receive_bytes_total{id="/",kubernetes_io_hostname=~"^.*$",agentpool=~".*"}[1m])) by (kubernetes_io_hostname)
- sum (rate (container_network_transmit_bytes_total{id="/",kubernetes_io_hostname=~"^.*$",agentpool=~".*"}[1m])) by (kubernetes_io_hostname)
Graph visual
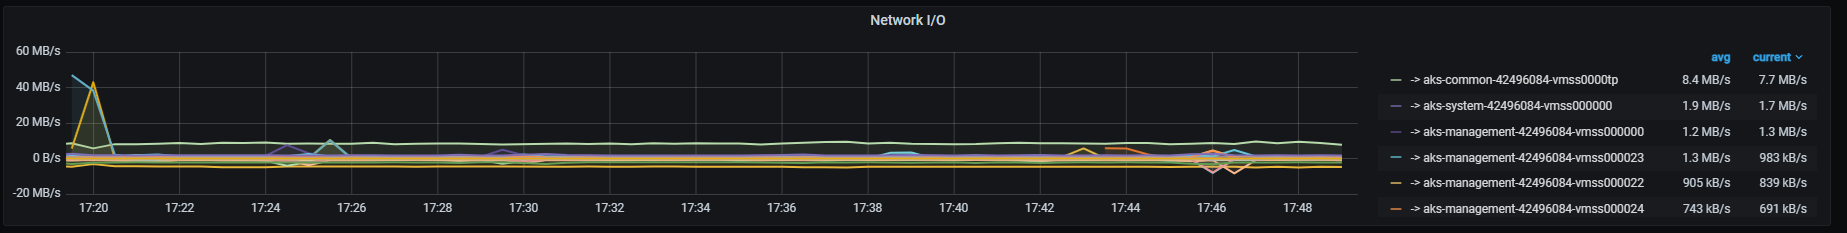
6.1.7 - Kubernetes services dashboard
Kubernetes services dashboard
Information provided by Kubernetes services dashboard
Introduction
Kubernetes services dashboard monitors system metrics related to services/pods.
The available metrics are defined in the following sections.
Service CPU usage
Services cpu usage rate, aggregated by one minute
Metrics:
sum(rate(container_cpu_usage_seconds_total{container!="",container=~".*"}[1m])) by (container)
Graph visual
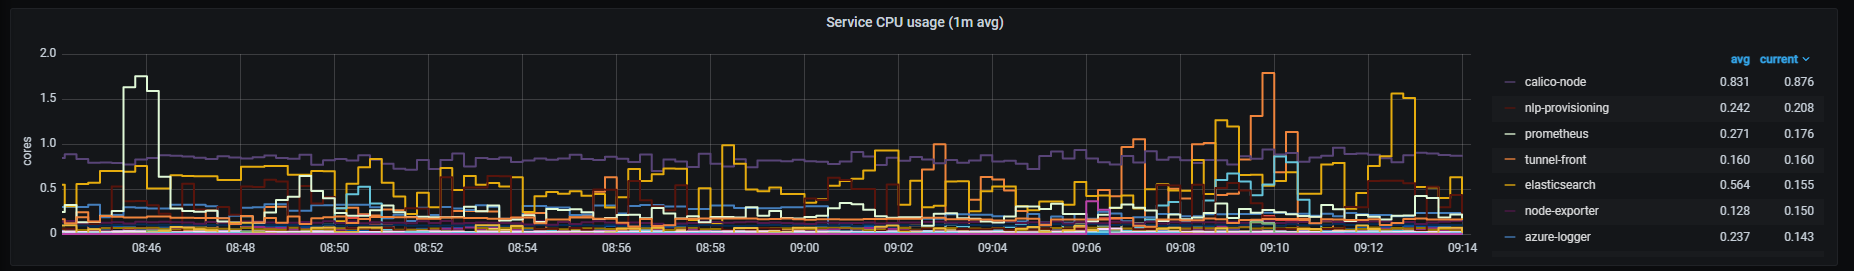
Pods CPU usage
Pods CPU usage rate, aggregated by one minute.
Metrics:
It includes two metrics:
- CPU usage by pod and container
sum (rate (container_cpu_usage_seconds_total{container!="",container=~".*"}[1m])) by (container, pod)
- CPU usage by container and instance
sum (rate (container_cpu_usage_seconds_total{container!="",container=~".*"}[1m])) by (instance, container)
Graph visual
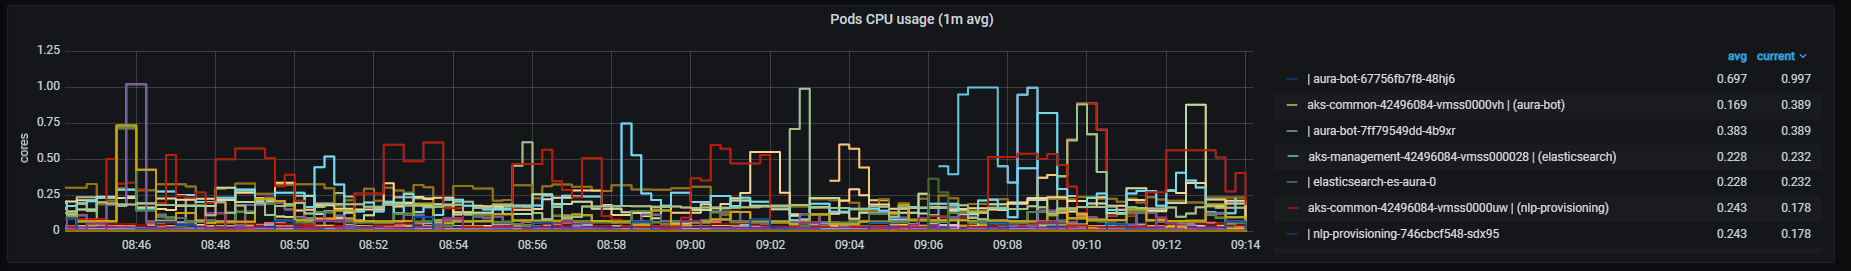
Service memory usage
Service memory usage in bytes.
Metrics:
sum (container_memory_working_set_bytes{container!="",container=~".*"}) by (container)
Graph visual
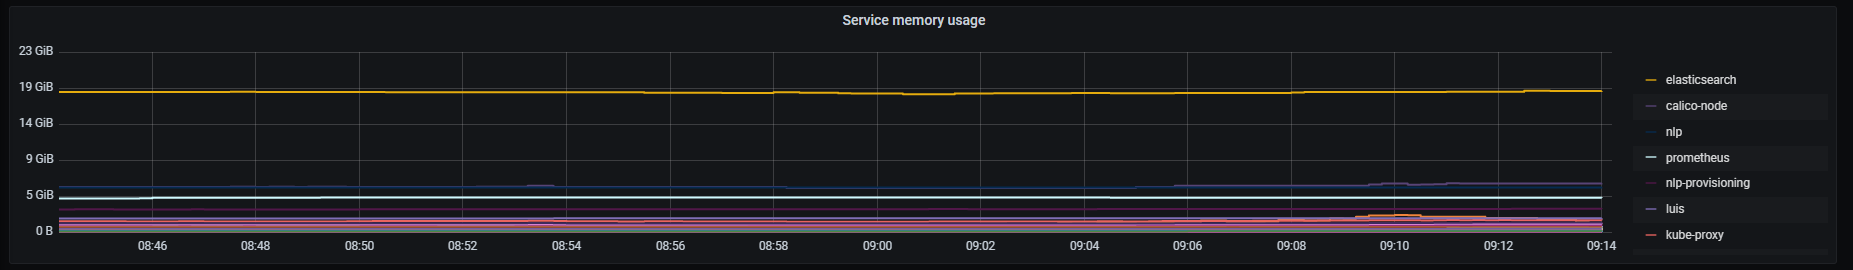
Pods memory usage
Pods memory usage in bytes, and memory usage rate aggregated by one minute
Metrics:
It includes four metrics:
- memory usage classified by pod and container
sum (container_memory_working_set_bytes{container!="",container=~".*"}) by (container, pod)
- memory usage classified by container, image and instance
sum (rate (container_cpu_usage_seconds_total{container!="",container=~".*"}[1m])) by (instance, container)
- memory usage rate, classified by pod and container, and aggregated by one minute
sum (rate (container_memory_working_set_bytes{container!="",container=~".*"}[1m])) by (container, pod)
- memory usage rate, classified by instance and container, and aggregated by one minute
sum (rate (container_memory_working_set_bytes{container!="",container=~".*"}[1m])) by (instance, container)
Graph visual
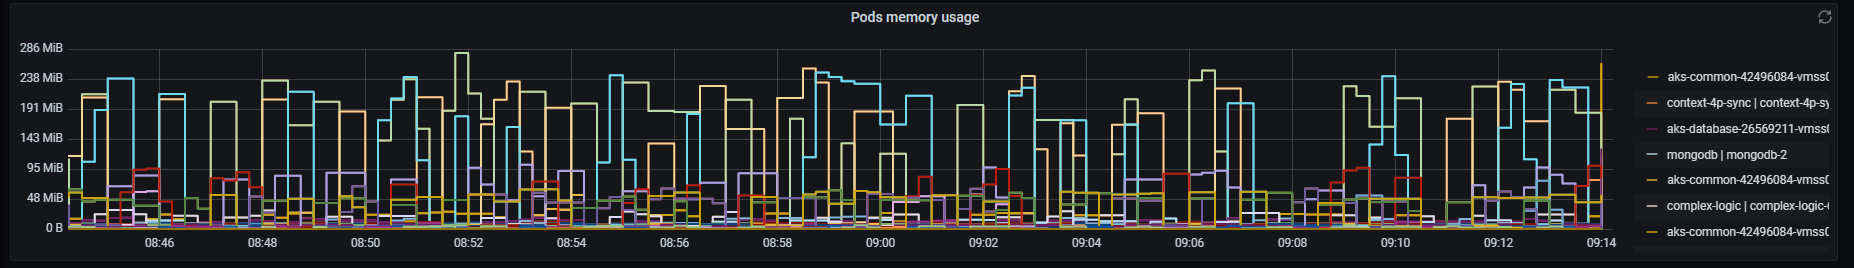
Service network I/O
Network received/sent data rate, aggregated by one minute
Metrics:
It includes two metrics:
sum (container_memory_working_set_bytes{container!="",container=~".*"}) by (container)
- sum (rate (container_network_transmit_bytes_total{pod!="",pod=~".*.*"}[1m])) by (pod)
Graph visual
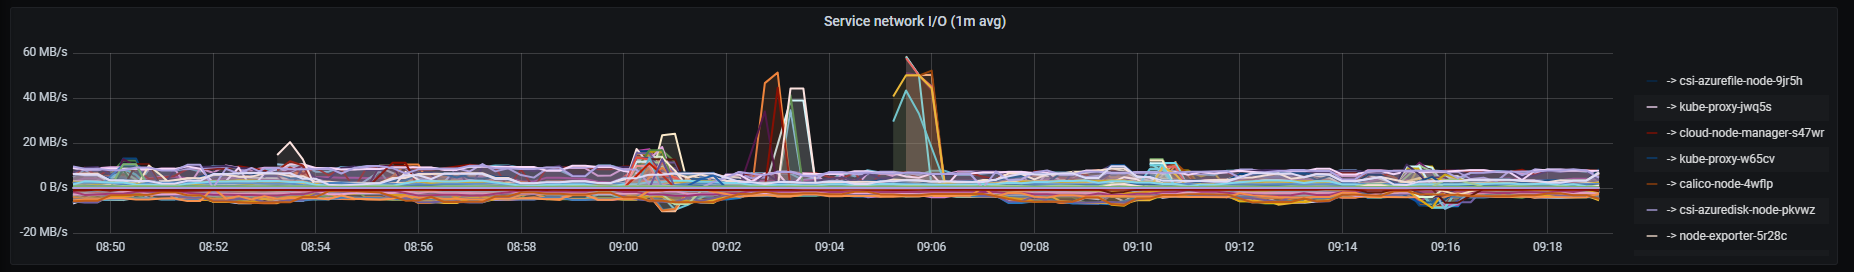
Pods network I/O
Pods received/sent data rate in bytes, aggregated by one minute.
Metrics:
It includes four metrics:
- Received bytes classified by pod
sum (rate (container_network_receive_bytes_total{pod!="",pod=~".*.*"}[1m])) by (name, pod)
- Sent bytes classified by pod
- sum (rate (container_network_transmit_bytes_total{pod!="",pod=~".*.*"}[1m])) by (container, pod)
- Received bytes classified by container and instance
sum (rate (container_network_receive_bytes_total{pod!="",pod=~".*.*"}[1m])) by (instance, container, image)
- Send bytes classified by container and instance
- sum (rate (container_network_transmit_bytes_total{pod!="",pod=~".*.*"}[1m])) by (instance, container, image)
Graph visual
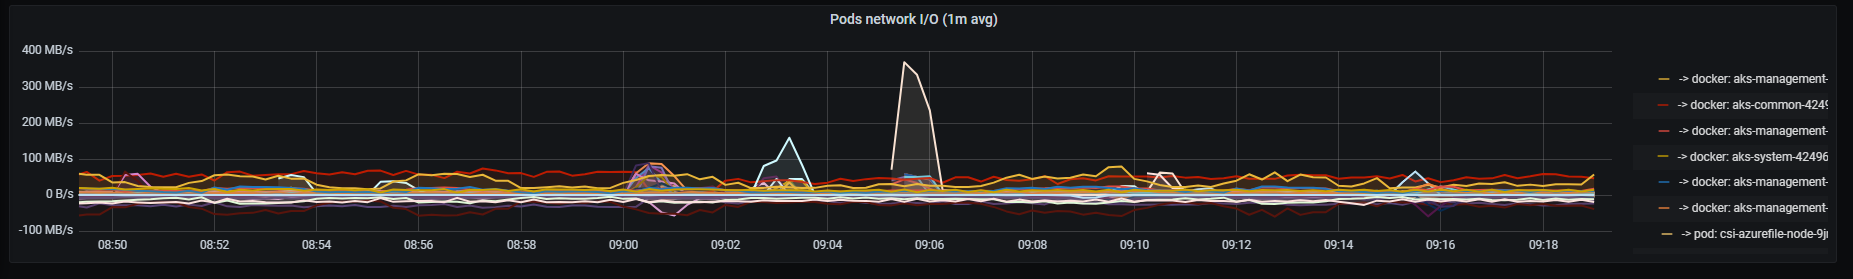
6.1.8 - Kubernetes storage monitoring dashboard
Kubernetes storage monitoring dashboard
Information provided by Kubernetes storage monitoring dashboard
Introduction
Kubernetes storage monitoring dashboard monitors storage related metrics.
The available metrics are defined in the following sections.
Used space
Kubelets volumes and container filesystems data usage in bytes.
Metrics:
It includes two metrics:
- Kubelet volumes used bytes
kubelet_volume_stats_used_bytes{kubernetes_io_hostname=~"^.*$",agentpool=~".*"}
- Container filesystem usage in bytes
container_fs_usage_bytes{image!="",kubernetes_io_hostname=~"^.*$",agentpool=~".*"}
Graph visual
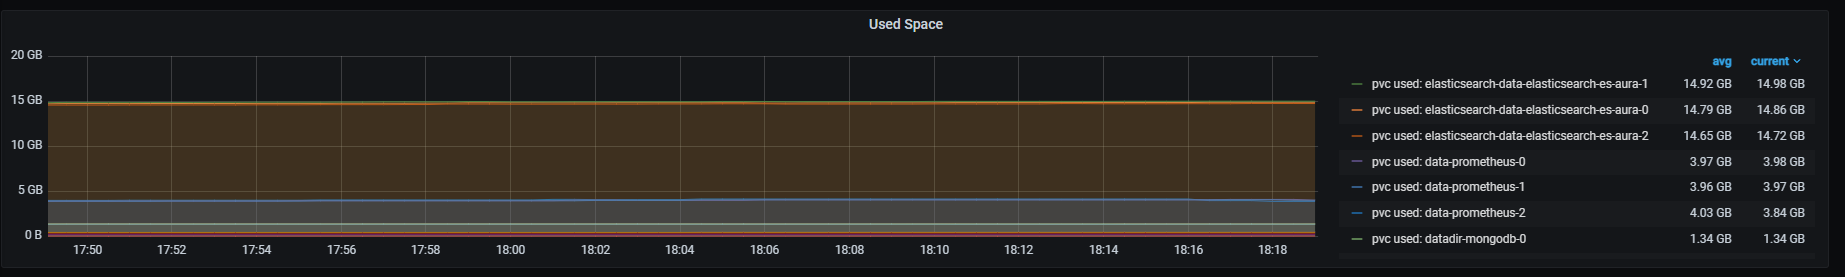
PVC used space %
PersistentVolumeClaim used space percent.
Metrics:
(kubelet_volume_stats_used_bytes{kubernetes_io_hostname=~"^.*$",agentpool=~".*",persistentvolumeclaim=~"(data-prometheus-0|data-prometheus-1|data-prometheus-2|datadir-mongodb-0|datadir-mongodb-1|datadir-mongodb-2|elasticsearch-data-elasticsearch-es-aura-0|elasticsearch-data-elasticsearch-es-aura-1|elasticsearch-data-elasticsearch-es-aura-2|grafana-grafana-0|redis-data-redis-0|redis-data-redis-1|redis-data-redis-2|store-thanos-store-gateway-0|store-thanos-store-gateway-1)"} / kubelet_volume_stats_capacity_bytes{kubernetes_io_hostname=~"^.*$",agentpool=~".*",persistentvolumeclaim=~"(data-prometheus-0|data-prometheus-1|data-prometheus-2|datadir-mongodb-0|datadir-mongodb-1|datadir-mongodb-2|elasticsearch-data-elasticsearch-es-aura-0|elasticsearch-data-elasticsearch-es-aura-1|elasticsearch-data-elasticsearch-es-aura-2|grafana-grafana-0|redis-data-redis-0|redis-data-redis-1|redis-data-redis-2|store-thanos-store-gateway-0|store-thanos-store-gateway-1)"})
Graph visual
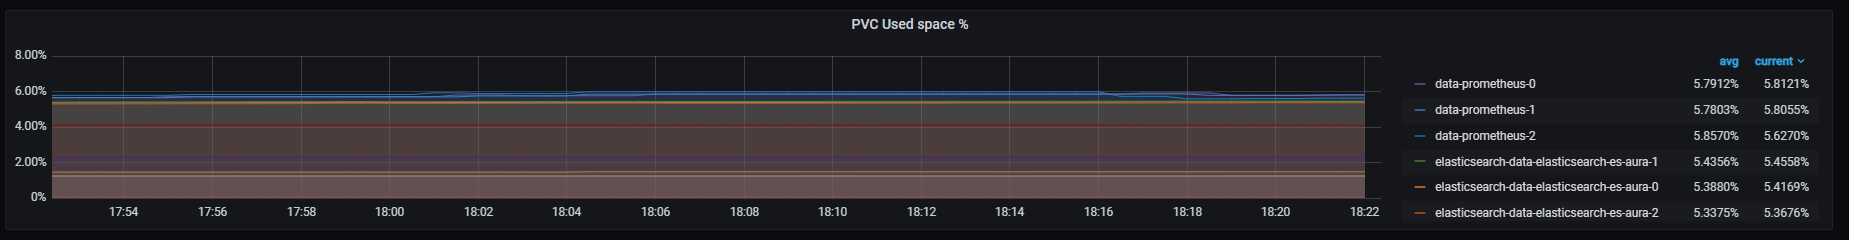
Local used space %
Containers assigned space usage percentage.
Metrics:
(container_fs_usage_bytes{image!="",kubernetes_io_hostname=~"^.*$",agentpool=~".*"} / container_fs_limit_bytes{image!="",kubernetes_io_hostname=~"^.*$",agentpool=~".*"})
Graph visual
Used inodes
Kubelet PersistentVolumeClaim volumes total used inodes.
Metrics:
kubelet_volume_stats_inodes_used{kubernetes_io_hostname=~"^.*$",agentpool=~".*",persistentvolumeclaim=~"(data-prometheus-0|data-prometheus-1|data-prometheus-2|datadir-mongodb-0|datadir-mongodb-1|datadir-mongodb-2|elasticsearch-data-elasticsearch-es-aura-0|elasticsearch-data-elasticsearch-es-aura-1|elasticsearch-data-elasticsearch-es-aura-2|grafana-grafana-0|redis-data-redis-0|redis-data-redis-1|redis-data-redis-2|store-thanos-store-gateway-0|store-thanos-store-gateway-1)"}
Graph visual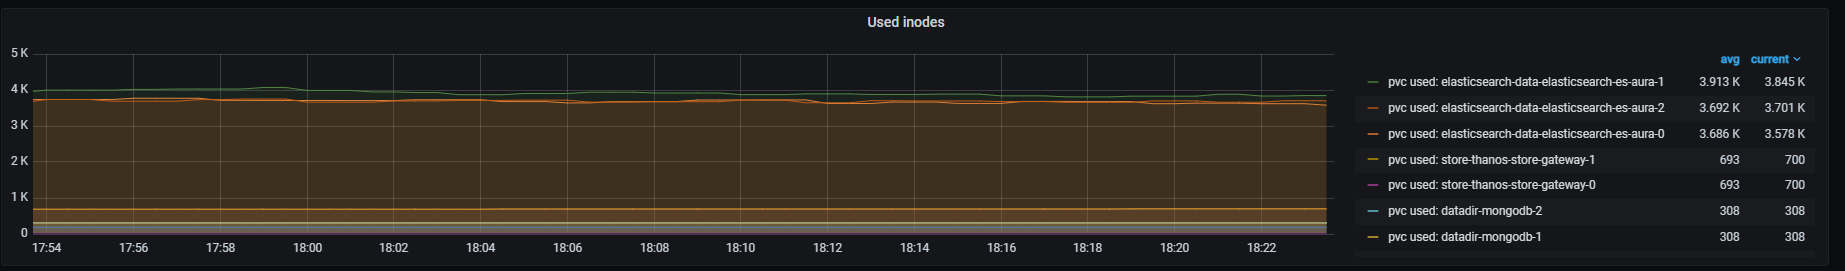
PVC used inodes %
Kubelet PersistentVolumeClaim volumes inodes usage percentage.
Metrics:
(kubelet_volume_stats_inodes_used{kubernetes_io_hostname=~"^.*$",agentpool=~".*",persistentvolumeclaim=~"(data-prometheus-0|data-prometheus-1|data-prometheus-2|datadir-mongodb-0|datadir-mongodb-1|datadir-mongodb-2|elasticsearch-data-elasticsearch-es-aura-0|elasticsearch-data-elasticsearch-es-aura-1|elasticsearch-data-elasticsearch-es-aura-2|grafana-grafana-0|redis-data-redis-0|redis-data-redis-1|redis-data-redis-2|store-thanos-store-gateway-0|store-thanos-store-gateway-1)"} / kubelet_volume_stats_inodes{kubernetes_io_hostname=~"^.*$",agentpool=~".*",persistentvolumeclaim=~"(data-prometheus-0|data-prometheus-1|data-prometheus-2|datadir-mongodb-0|datadir-mongodb-1|datadir-mongodb-2|elasticsearch-data-elasticsearch-es-aura-0|elasticsearch-data-elasticsearch-es-aura-1|elasticsearch-data-elasticsearch-es-aura-2|grafana-grafana-0|redis-data-redis-0|redis-data-redis-1|redis-data-redis-2|store-thanos-store-gateway-0|store-thanos-store-gateway-1)"})
Graph visual
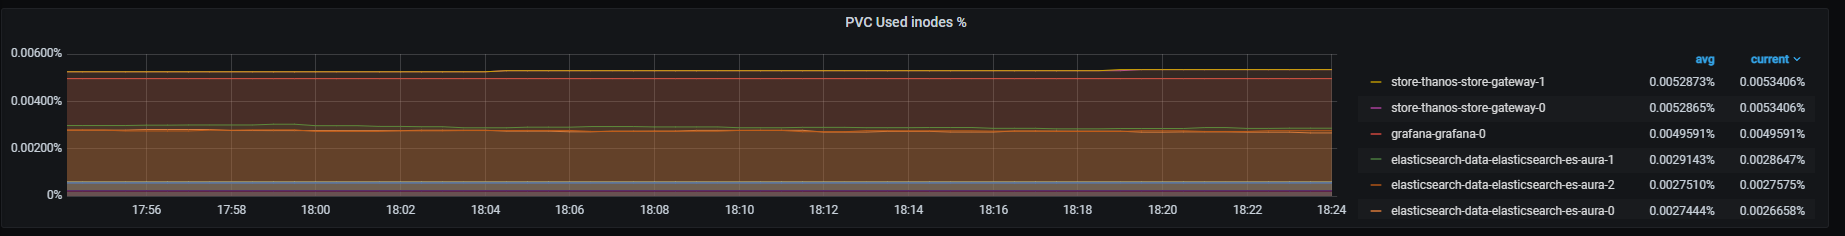
6.1.9 - NLP provisioning dashboard
NLP provisioning dashboard
Information provided by NLP provisioning dashboard
Panels
Expected Killed Alive
Number of expected, killed and alive provisioning processes.
The queries used to get the panel information are:
nlp_provisioning_expected_alive_processes
nlp_provisioning_killed_processes
nlp_provisioning_alive_processes
An example of this panel is shown below:

Killed by container
Time series with the killed processes by container.
The x-axis shows the time series and the y-axis shows the number of killed processes by container.
The queries used to get the panel information are:
nlp_provisioning_container_killed_count_total
An example of this panel is shown below:
Killed processes
Time series with the total killed processes.
The x-axis shows the time series and the y-axis shows the number of killed processes.
The queries used to get the panel information are:
nlp_provisioning_killed_processes
An example of this panel is shown below:
Alive processes VS Expected alive processes
Time series with the ratio between alive processes and expected alive processes.
The x-axis shows the time series and the y-axis shows the ratio between alive and expected
The queries used to get the panel information are:
nlp_provisioning_alive_processes/ nlp_provisioning_expected_alive_processes
An example of this panel is shown below:
Alive processes VS expected processes
Time series with the ratio between alive processes rate aggregated by 15 minutes and expected alive processes rate aggregated by 15 minutes.
The x-axis shows the time series and the y-axis shows the ratio between alive/expected processes
The queries used to get the panel information are:
sum by (exported_job) (rate(nlp_provisioning_alive_processes{exported_job="nlp_provisioning_job"}[15m])) /
sum by (exported_job) (rate(nlp_provisioning_expected_alive_processes{exported_job="nlp_provisioning_job"}[15m]))
An example of this panel is shown below:
6.1.10 - Prometheus stats dashboard
Prometheus stats dashboard
Information provided by Prometheus stats dashboard
Introduction
This is a dashboard to obtain a lot of information on how Prometheus performs.
To get the information about each pod, the dashboard counts on a filter with the following fields:
jobs: list of active jobs.instances: list of scrapeable instances.interval: possible time intervals.
Once selected, the following graphs are printed.
Panels
Pods CPU usage
Time series with CPU usage rate, aggregated by one minute. It also shows the current minimum, maximum and average cpu usage.
The x-axis shows the time series and the y-axis shows the cpu usage rate.
The queries used to get the panel information are:
sum(rate(container_cpu_usage_seconds_total{pod_name!="",pod_name=~"prometheus.*"}[1m])) by (pod_name)
An example of this panel is shown below:
Pods memory usage
Time series with memory usage. It also shows the current minimum, maximum and average memory usage.
The x-axis shows the time series and the y-axis shows the memory usage.
The queries used to get the panel information are:
sum (container_memory_working_set_bytes{pod_name!="",pod_name=~"prometheus.*"}) by (pod_name)
An example of this panel is shown below:
Pods network I/O
Time series with the network I/O average aggregated by one minute. It also shows the current minimum, maximum and average network I/O bytes.
The x-axis shows the time series and the y-axis shows the network I/O.
The queries used to get the panel information are:
sum (rate (container_network_receive_bytes_total{pod_name!="",pod_name=~"prometheus.*"}[1m])) by (pod_name)
- sum (rate (container_network_transmit_bytes_total{pod_name!="",pod_name=~"prometheus.*"}[1m])) by (pod_name)
An example of this panel is shown below:
Uptime
Percentage of uptime for the last hour.
The queries used to get the panel information are:
avg(avg_over_time(up{instance=~"(10\\.240\\.0\\.10:9093|10\\.240\\.3\\.161:9093|10\\.240\\.0\\.34:9114|10\\.240\\.0\\.253:8080|10\\.240\\.3\\.205:9090|10\\.240\\.3\\.236:9090|10\\.240\\.4\\.14:9090|10\\.240\\.4\\.156:9121|10\\.240\\.4\\.186:9121|10\\.240\\.4\\.223:9121)",job=~"kubernetes-service-endpoints"}[1h]) * 100)
An example of this panel is shown below:
Currently down
Currently down instances.
The queries used to get the panel information are:
up{instance=~"(10\\.240\\.0\\.5:9093|10\\.240\\.0\\.76:9093|10\\.240\\.0\\.26:9114|10\\.240\\.0\\.253:8080|10\\.240\\.0\\.94:9090|10\\.240\\.1\\.199:9090|10\\.240\\.2\\.4:9090|10\\.240\\.2\\.204:9121|10\\.240\\.2\\.245:9121|10\\.240\\.3\\.10:9121)",job=~"kubernetes-service-endpoints"} < 1
An example of this panel is shown below:
Total series
Total series count.
The queries used to get the panel information are:
sum(prometheus_tsdb_head_series{job=~"kubernetes-service-endpoints",instance=~"(10\\.240\\.0\\.5:9093|10\\.240\\.0\\.76:9093|10\\.240\\.0\\.26:9114|10\\.240\\.0\\.253:8080|10\\.240\\.0\\.94:9090|10\\.240\\.1\\.199:9090|10\\.240\\.2\\.4:9090|10\\.240\\.2\\.204:9121|10\\.240\\.2\\.245:9121|10\\.240\\.3\\.10:9121)"})
An example of this panel is shown below:
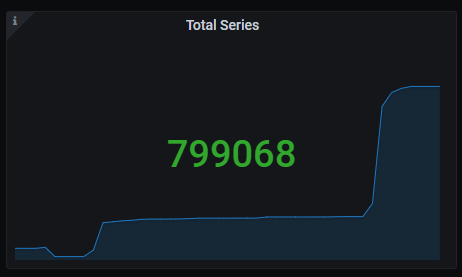
Total series
Memory chunks being used.
The queries used to get the panel information are:
sum(prometheus_tsdb_head_chunks{job=~"kubernetes-service-endpoints",instance=~"(10\\.240\\.0\\.5:9093|10\\.240\\.0\\.76:9093|10\\.240\\.0\\.26:9114|10\\.240\\.0\\.253:8080|10\\.240\\.0\\.94:9090|10\\.240\\.1\\.199:9090|10\\.240\\.2\\.4:9090|10\\.240\\.2\\.204:9121|10\\.240\\.2\\.245:9121|10\\.240\\.3\\.10:9121)"})
An example of this panel is shown below:
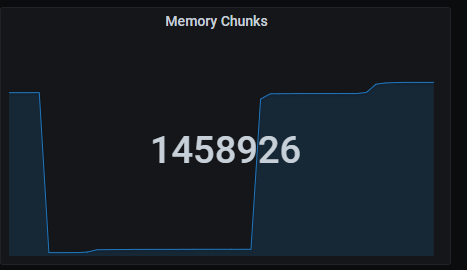
Quick numbers
Quick numbers section shows a series of Prometheus indicators.
Missed iterations
Number of missed iterations, aggregated by one hour.
The queries used to get the panel information are:
sum(sum_over_time(prometheus_evaluator_iterations_missed_total{job=~"kubernetes-service-endpoints",instance=~"(10\\.240\\.0\\.5:9093|10\\.240\\.0\\.76:9093|10\\.240\\.0\\.26:9114|10\\.240\\.0\\.253:8080|10\\.240\\.0\\.94:9090|10\\.240\\.1\\.199:9090|10\\.240\\.2\\.4:9090|10\\.240\\.2\\.204:9121|10\\.240\\.2\\.245:9121|10\\.240\\.3\\.10:9121)"}[1h]))
Skipped iterations
Number of skipped iterations, aggregated by one hour.
The queries used to get the panel information are:
sum(sum_over_time(prometheus_evaluator_iterations_skipped_total{job=~"kubernetes-service-endpoints",instance=~"(10\\.240\\.0\\.5:9093|10\\.240\\.0\\.76:9093|10\\.240\\.0\\.26:9114|10\\.240\\.0\\.253:8080|10\\.240\\.0\\.94:9090|10\\.240\\.1\\.199:9090|10\\.240\\.2\\.4:9090|10\\.240\\.2\\.204:9121|10\\.240\\.2\\.245:9121|10\\.240\\.3\\.10:9121)"}[1h]))
Tardy scrapes
Number of scrapes that elapsed more than expected, aggregated by one hour.
The queries used to get the panel information are:
sum(sum_over_time(prometheus_target_scrapes_exceeded_sample_limit_total{job=~"kubernetes-service-endpoints",instance=~"(10\\.240\\.0\\.5:9093|10\\.240\\.0\\.76:9093|10\\.240\\.0\\.26:9114|10\\.240\\.0\\.253:8080|10\\.240\\.0\\.94:9090|10\\.240\\.1\\.199:9090|10\\.240\\.2\\.4:9090|10\\.240\\.2\\.204:9121|10\\.240\\.2\\.245:9121|10\\.240\\.3\\.10:9121)"}[1h]))
Reload failures
Number of reload failures, aggregated by one hour.
The queries used to get the panel information are:
sum(sum_over_time(prometheus_tsdb_reloads_failures_total{job=~"kubernetes-service-endpoints",instance=~"(10\\.240\\.0\\.5:9093|10\\.240\\.0\\.76:9093|10\\.240\\.0\\.26:9114|10\\.240\\.0\\.253:8080|10\\.240\\.0\\.94:9090|10\\.240\\.1\\.199:9090|10\\.240\\.2\\.4:9090|10\\.240\\.2\\.204:9121|10\\.240\\.2\\.245:9121|10\\.240\\.3\\.10:9121)"}[1h]))
Skipped scrapes
Number of uncompleted scrapes due to multiple reasons, aggregated by one hour.
The queries used to get the panel information are:
sum(sum_over_time(prometheus_target_scrapes_exceeded_sample_limit_total{job=~"kubernetes-service-endpoints",instance=~"(10\\.240\\.0\\.5:9093|10\\.240\\.0\\.76:9093|10\\.240\\.0\\.26:9114|10\\.240\\.0\\.253:8080|10\\.240\\.0\\.94:9090|10\\.240\\.1\\.199:9090|10\\.240\\.2\\.4:9090|10\\.240\\.2\\.204:9121|10\\.240\\.2\\.245:9121|10\\.240\\.3\\.10:9121)"}[1h])) +
sum(sum_over_time(prometheus_target_scrapes_sample_duplicate_timestamp_total{job=~"kubernetes-service-endpoints",instance=~"(10\\.240\\.0\\.5:9093|10\\.240\\.0\\.76:9093|10\\.240\\.0\\.26:9114|10\\.240\\.0\\.253:8080|10\\.240\\.0\\.94:9090|10\\.240\\.1\\.199:9090|10\\.240\\.2\\.4:9090|10\\.240\\.2\\.204:9121|10\\.240\\.2\\.245:9121|10\\.240\\.3\\.10:9121)"}[1h])) +
sum(sum_over_time(prometheus_target_scrapes_sample_out_of_bounds_total{job=~"kubernetes-service-endpoints",instance=~"(10\\.240\\.0\\.5:9093|10\\.240\\.0\\.76:9093|10\\.240\\.0\\.26:9114|10\\.240\\.0\\.253:8080|10\\.240\\.0\\.94:9090|10\\.240\\.1\\.199:9090|10\\.240\\.2\\.4:9090|10\\.240\\.2\\.204:9121|10\\.240\\.2\\.245:9121|10\\.240\\.3\\.10:9121)"}[1h])) +
sum(sum_over_time(prometheus_target_scrapes_sample_out_of_order_total{job=~"kubernetes-service-endpoints",instance=~"(10\\.240\\.0\\.5:9093|10\\.240\\.0\\.76:9093|10\\.240\\.0\\.26:9114|10\\.240\\.0\\.253:8080|10\\.240\\.0\\.94:9090|10\\.240\\.1\\.199:9090|10\\.240\\.2\\.4:9090|10\\.240\\.2\\.204:9121|10\\.240\\.2\\.245:9121|10\\.240\\.3\\.10:9121)"}[1h]))
An example of this panel is shown below:
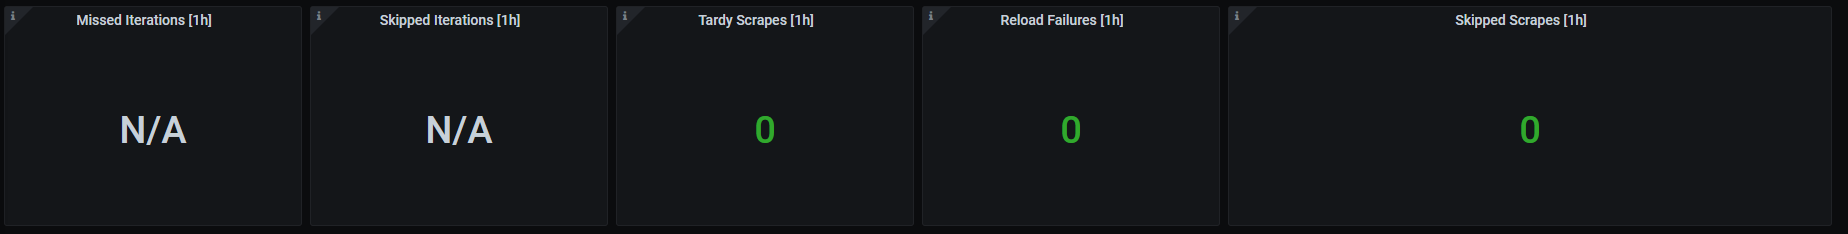
Failures and errors
Time series with the number of several different errors and failures, aggregated by five minutes.
The x-axis shows the time series and the y-axis shows a series of different errors and failures:
- Dialer connection errors.
- Evaluator iterations missed.
- Evaluator iterations skipped.
- Evaluation failures.
- Azure refresh failures.
- Consul rpc failures.
- Dns lookup failures.
- Ec2 refresh failures.
- Gce refresh failures.
- Marathon refresh failures.
- Openstack refresh failures.
- Triton refresh failures.
- Scrapes exceeded sample limit.
- Scrapes sample duplicate timestamp.
- Scrapes sample out of bounds.
- Treecache zookeeper failures.
- Tsdb compactions failed.
- Tsdb head series not found.
- Tsdb reloads failures.
The queries used to get the panel information are:
sum(increase(net_conntrack_dialer_conn_failed_total{instance=~"(10\\.240\\.0\\.5:9093|10\\.240\\.0\\.76:9093|10\\.240\\.0\\.26:9114|10\\.240\\.0\\.253:8080|10\\.240\\.0\\.94:9090|10\\.240\\.1\\.199:9090|10\\.240\\.2\\.4:9090|10\\.240\\.2\\.204:9121|10\\.240\\.2\\.245:9121|10\\.240\\.3\\.10:9121)"}[5m])) > 0
sum(increase(prometheus_evaluator_iterations_missed_total{instance=~"(10\\.240\\.0\\.5:9093|10\\.240\\.0\\.76:9093|10\\.240\\.0\\.26:9114|10\\.240\\.0\\.253:8080|10\\.240\\.0\\.94:9090|10\\.240\\.1\\.199:9090|10\\.240\\.2\\.4:9090|10\\.240\\.2\\.204:9121|10\\.240\\.2\\.245:9121|10\\.240\\.3\\.10:9121)"}[5m])) > 0
sum(increase(prometheus_evaluator_iterations_skipped_total{instance=~"(10\\.240\\.0\\.5:9093|10\\.240\\.0\\.76:9093|10\\.240\\.0\\.26:9114|10\\.240\\.0\\.253:8080|10\\.240\\.0\\.94:9090|10\\.240\\.1\\.199:9090|10\\.240\\.2\\.4:9090|10\\.240\\.2\\.204:9121|10\\.240\\.2\\.245:9121|10\\.240\\.3\\.10:9121)"}[5m])) > 0
sum(increase(prometheus_rule_evaluation_failures_total{instance=~"(10\\.240\\.0\\.5:9093|10\\.240\\.0\\.76:9093|10\\.240\\.0\\.26:9114|10\\.240\\.0\\.253:8080|10\\.240\\.0\\.94:9090|10\\.240\\.1\\.199:9090|10\\.240\\.2\\.4:9090|10\\.240\\.2\\.204:9121|10\\.240\\.2\\.245:9121|10\\.240\\.3\\.10:9121)"}[5m])) > 0
sum(increase(prometheus_sd_azure_refresh_failures_total{instance=~"(10\\.240\\.0\\.5:9093|10\\.240\\.0\\.76:9093|10\\.240\\.0\\.26:9114|10\\.240\\.0\\.253:8080|10\\.240\\.0\\.94:9090|10\\.240\\.1\\.199:9090|10\\.240\\.2\\.4:9090|10\\.240\\.2\\.204:9121|10\\.240\\.2\\.245:9121|10\\.240\\.3\\.10:9121)"}[5m])) > 0
sum(increase(prometheus_sd_consul_rpc_failures_total{instance=~"(10\\.240\\.0\\.5:9093|10\\.240\\.0\\.76:9093|10\\.240\\.0\\.26:9114|10\\.240\\.0\\.253:8080|10\\.240\\.0\\.94:9090|10\\.240\\.1\\.199:9090|10\\.240\\.2\\.4:9090|10\\.240\\.2\\.204:9121|10\\.240\\.2\\.245:9121|10\\.240\\.3\\.10:9121)"}[5m])) > 0
sum(increase(prometheus_sd_dns_lookup_failures_total{instance=~"(10\\.240\\.0\\.5:9093|10\\.240\\.0\\.76:9093|10\\.240\\.0\\.26:9114|10\\.240\\.0\\.253:8080|10\\.240\\.0\\.94:9090|10\\.240\\.1\\.199:9090|10\\.240\\.2\\.4:9090|10\\.240\\.2\\.204:9121|10\\.240\\.2\\.245:9121|10\\.240\\.3\\.10:9121)"}[5m])) > 0
sum(increase(prometheus_sd_ec2_refresh_failures_total{instance=~"(10\\.240\\.0\\.5:9093|10\\.240\\.0\\.76:9093|10\\.240\\.0\\.26:9114|10\\.240\\.0\\.253:8080|10\\.240\\.0\\.94:9090|10\\.240\\.1\\.199:9090|10\\.240\\.2\\.4:9090|10\\.240\\.2\\.204:9121|10\\.240\\.2\\.245:9121|10\\.240\\.3\\.10:9121)"}[5m])) > 0
sum(increase(prometheus_sd_gce_refresh_failures_total{instance=~"(10\\.240\\.0\\.5:9093|10\\.240\\.0\\.76:9093|10\\.240\\.0\\.26:9114|10\\.240\\.0\\.253:8080|10\\.240\\.0\\.94:9090|10\\.240\\.1\\.199:9090|10\\.240\\.2\\.4:9090|10\\.240\\.2\\.204:9121|10\\.240\\.2\\.245:9121|10\\.240\\.3\\.10:9121)"}[5m])) > 0
sum(increase(prometheus_sd_marathon_refresh_failures_total{instance=~"(10\\.240\\.0\\.5:9093|10\\.240\\.0\\.76:9093|10\\.240\\.0\\.26:9114|10\\.240\\.0\\.253:8080|10\\.240\\.0\\.94:9090|10\\.240\\.1\\.199:9090|10\\.240\\.2\\.4:9090|10\\.240\\.2\\.204:9121|10\\.240\\.2\\.245:9121|10\\.240\\.3\\.10:9121)"}[5m])) > 0
sum(increase(prometheus_sd_openstack_refresh_failures_total{instance=~"(10\\.240\\.0\\.5:9093|10\\.240\\.0\\.76:9093|10\\.240\\.0\\.26:9114|10\\.240\\.0\\.253:8080|10\\.240\\.0\\.94:9090|10\\.240\\.1\\.199:9090|10\\.240\\.2\\.4:9090|10\\.240\\.2\\.204:9121|10\\.240\\.2\\.245:9121|10\\.240\\.3\\.10:9121)"}[5m])) > 0
sum(increase(prometheus_sd_triton_refresh_failures_total{instance=~"(10\\.240\\.0\\.5:9093|10\\.240\\.0\\.76:9093|10\\.240\\.0\\.26:9114|10\\.240\\.0\\.253:8080|10\\.240\\.0\\.94:9090|10\\.240\\.1\\.199:9090|10\\.240\\.2\\.4:9090|10\\.240\\.2\\.204:9121|10\\.240\\.2\\.245:9121|10\\.240\\.3\\.10:9121)"}[5m])) > 0
sum(increase(prometheus_target_scrapes_exceeded_sample_limit_total{instance=~"(10\\.240\\.0\\.5:9093|10\\.240\\.0\\.76:9093|10\\.240\\.0\\.26:9114|10\\.240\\.0\\.253:8080|10\\.240\\.0\\.94:9090|10\\.240\\.1\\.199:9090|10\\.240\\.2\\.4:9090|10\\.240\\.2\\.204:9121|10\\.240\\.2\\.245:9121|10\\.240\\.3\\.10:9121)"}[5m])) > 0
sum(increase(prometheus_target_scrapes_sample_duplicate_timestamp_total{instance=~"(10\\.240\\.0\\.5:9093|10\\.240\\.0\\.76:9093|10\\.240\\.0\\.26:9114|10\\.240\\.0\\.253:8080|10\\.240\\.0\\.94:9090|10\\.240\\.1\\.199:9090|10\\.240\\.2\\.4:9090|10\\.240\\.2\\.204:9121|10\\.240\\.2\\.245:9121|10\\.240\\.3\\.10:9121)"}[5m])) > 0
sum(increase(prometheus_target_scrapes_sample_out_of_bounds_total{instance=~"(10\\.240\\.0\\.5:9093|10\\.240\\.0\\.76:9093|10\\.240\\.0\\.26:9114|10\\.240\\.0\\.253:8080|10\\.240\\.0\\.94:9090|10\\.240\\.1\\.199:9090|10\\.240\\.2\\.4:9090|10\\.240\\.2\\.204:9121|10\\.240\\.2\\.245:9121|10\\.240\\.3\\.10:9121)"}[5m])) > 0
sum(increase(prometheus_target_scrapes_sample_out_of_order_total{instance=~"(10\\.240\\.0\\.5:9093|10\\.240\\.0\\.76:9093|10\\.240\\.0\\.26:9114|10\\.240\\.0\\.253:8080|10\\.240\\.0\\.94:9090|10\\.240\\.1\\.199:9090|10\\.240\\.2\\.4:9090|10\\.240\\.2\\.204:9121|10\\.240\\.2\\.245:9121|10\\.240\\.3\\.10:9121)"}[5m])) > 0
sum(increase(prometheus_treecache_zookeeper_failures_total{instance=~"(10\\.240\\.0\\.5:9093|10\\.240\\.0\\.76:9093|10\\.240\\.0\\.26:9114|10\\.240\\.0\\.253:8080|10\\.240\\.0\\.94:9090|10\\.240\\.1\\.199:9090|10\\.240\\.2\\.4:9090|10\\.240\\.2\\.204:9121|10\\.240\\.2\\.245:9121|10\\.240\\.3\\.10:9121)"}[5m])) > 0
sum(increase(prometheus_tsdb_compactions_failed_total{instance=~"(10\\.240\\.0\\.5:9093|10\\.240\\.0\\.76:9093|10\\.240\\.0\\.26:9114|10\\.240\\.0\\.253:8080|10\\.240\\.0\\.94:9090|10\\.240\\.1\\.199:9090|10\\.240\\.2\\.4:9090|10\\.240\\.2\\.204:9121|10\\.240\\.2\\.245:9121|10\\.240\\.3\\.10:9121)"}[5m])) > 0
sum(increase(prometheus_tsdb_head_series_not_found{instance=~"(10\\.240\\.0\\.5:9093|10\\.240\\.0\\.76:9093|10\\.240\\.0\\.26:9114|10\\.240\\.0\\.253:8080|10\\.240\\.0\\.94:9090|10\\.240\\.1\\.199:9090|10\\.240\\.2\\.4:9090|10\\.240\\.2\\.204:9121|10\\.240\\.2\\.245:9121|10\\.240\\.3\\.10:9121)"}[5m])) > 0
sum(increase(prometheus_tsdb_reloads_failures_total{instance=~"(10\\.240\\.0\\.5:9093|10\\.240\\.0\\.76:9093|10\\.240\\.0\\.26:9114|10\\.240\\.0\\.253:8080|10\\.240\\.0\\.94:9090|10\\.240\\.1\\.199:9090|10\\.240\\.2\\.4:9090|10\\.240\\.2\\.204:9121|10\\.240\\.2\\.245:9121|10\\.240\\.3\\.10:9121)"}[5m])) > 0
An example of how this panel looks like:
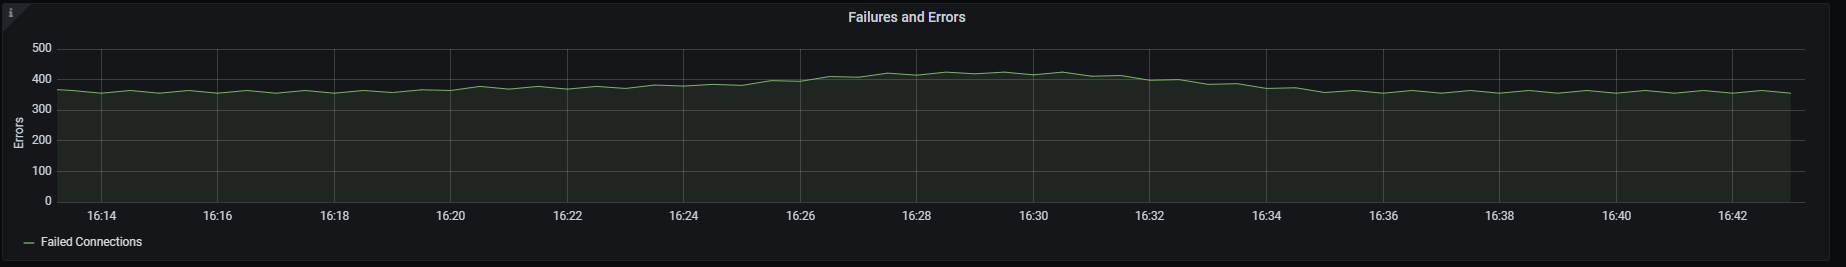
Upness (stacked)
Time series with a time bound representation of services upness. Those values are shown stacked.
The x-axis shows the time series and the y-axis shows the upness state of the different services.
The queries used to get the panel information are:
up{instance=~"(10\\.240\\.0\\.5:9093|10\\.240\\.0\\.76:9093|10\\.240\\.0\\.26:9114|10\\.240\\.0\\.253:8080|10\\.240\\.0\\.94:9090|10\\.240\\.1\\.199:9090|10\\.240\\.2\\.4:9090|10\\.240\\.2\\.204:9121|10\\.240\\.2\\.245:9121|10\\.240\\.3\\.10:9121)",job=~"kubernetes-service-endpoints"}
An example of this panel is shown below:
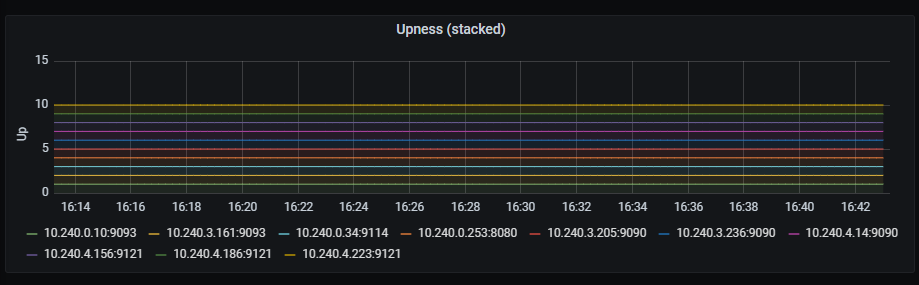
Storage memory chunks
Time series with the number of memory chunks used.
The x-axis shows the time series and the y-axis shows the number of memory chunks.
The queries used to get the panel information are:
prometheus_tsdb_head_chunks{job=~"kubernetes-service-endpoints",instance=~"(10\\.240\\.0\\.5:9093|10\\.240\\.0\\.76:9093|10\\.240\\.0\\.26:9114|10\\.240\\.0\\.253:8080|10\\.240\\.0\\.94:9090|10\\.240\\.1\\.199:9090|10\\.240\\.2\\.4:9090|10\\.240\\.2\\.204:9121|10\\.240\\.2\\.245:9121|10\\.240\\.3\\.10:9121)"}
An example of this panel is shown below:
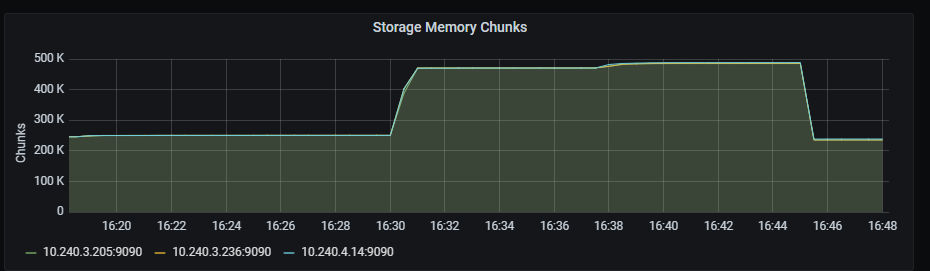
Series count
Time series with the number of tsdb series.
The x-axis shows the time series and the y-axis shows the number of series.
The queries used to get the panel information are:
prometheus_tsdb_head_series{job=~"kubernetes-service-endpoints",instance=~"(10\\.240\\.0\\.5:9093|10\\.240\\.0\\.76:9093|10\\.240\\.0\\.26:9114|10\\.240\\.0\\.253:8080|10\\.240\\.0\\.94:9090|10\\.240\\.1\\.199:9090|10\\.240\\.2\\.4:9090|10\\.240\\.2\\.204:9121|10\\.240\\.2\\.245:9121|10\\.240\\.3\\.10:9121)"}
An example of this panel is shown below:
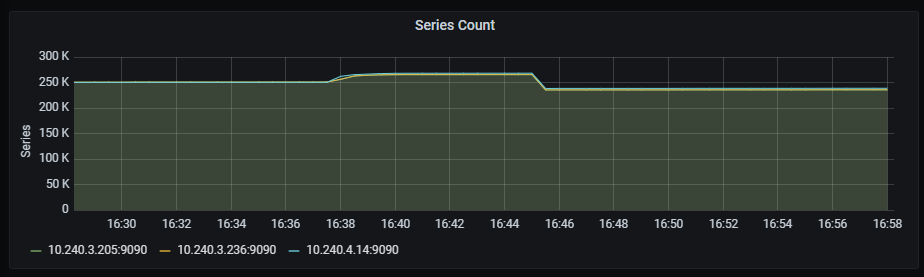
Series created/removed
Time series with the number of tsdb series created/removed.
The x-axis shows the time series and the y-axis shows the number of series created/removed, aggregated by 5 minutes.
The queries used to get the panel information are:
sum( increase(prometheus_tsdb_head_series_created_total{instance=~"(10\\.240\\.0\\.5:9093|10\\.240\\.0\\.76:9093|10\\.240\\.0\\.26:9114|10\\.240\\.0\\.253:8080|10\\.240\\.0\\.94:9090|10\\.240\\.1\\.199:9090|10\\.240\\.2\\.4:9090|10\\.240\\.2\\.204:9121|10\\.240\\.2\\.245:9121|10\\.240\\.3\\.10:9121)"}[5m]) )
sum( increase(prometheus_tsdb_head_series_removed_total{instance=~"(10\\.240\\.0\\.5:9093|10\\.240\\.0\\.76:9093|10\\.240\\.0\\.26:9114|10\\.240\\.0\\.253:8080|10\\.240\\.0\\.94:9090|10\\.240\\.1\\.199:9090|10\\.240\\.2\\.4:9090|10\\.240\\.2\\.204:9121|10\\.240\\.2\\.245:9121|10\\.240\\.3\\.10:9121)"}[5m]) )
An example of this panel is shown below:
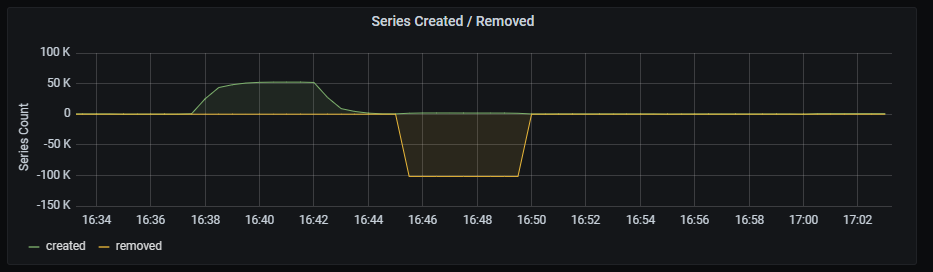
Appended samples per second
Time series with the number of metrics per second stored by Prometheus.
The x-axis shows the time series and the y-axis shows the number of metrics per second stored by Prometheus.
The queries used to get the panel information are:
rate(prometheus_tsdb_head_samples_appended_total{job=~"kubernetes-service-endpoints",instance=~"(10\\.240\\.0\\.5:9093|10\\.240\\.0\\.76:9093|10\\.240\\.0\\.26:9114|10\\.240\\.0\\.253:8080|10\\.240\\.0\\.94:9090|10\\.240\\.1\\.199:9090|10\\.240\\.2\\.4:9090|10\\.240\\.2\\.204:9121|10\\.240\\.2\\.245:9121|10\\.240\\.3\\.10:9121)"}[1m])
An example of this panel is shown below:
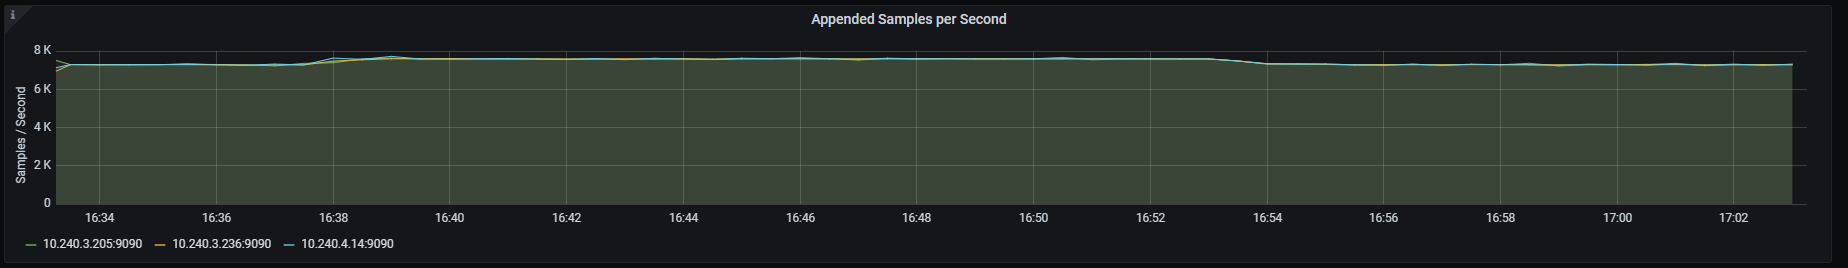
Scrape Sync total
Time series with the total number of syncs that were executed on a scrape pool.
The x-axis shows the time series and the y-axis shows the total number of syncs that were executed on a scrape pool.
The queries used to get the panel information are:
sum(prometheus_target_scrape_pool_sync_total{job=~"kubernetes-service-endpoints",instance=~"(10\\.240\\.0\\.5:9093|10\\.240\\.0\\.76:9093|10\\.240\\.0\\.26:9114|10\\.240\\.0\\.253:8080|10\\.240\\.0\\.94:9090|10\\.240\\.1\\.199:9090|10\\.240\\.2\\.4:9090|10\\.240\\.2\\.204:9121|10\\.240\\.2\\.245:9121|10\\.240\\.3\\.10:9121)"}) by (scrape_job)
An example of this panel is shown below:
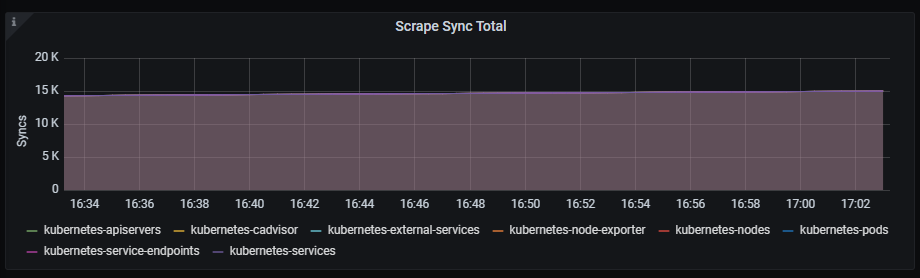
Target sync
Time series with the interval to sync the scrape pool.
The x-axis shows the time series and the y-axis shows the interval to sync the scrape pool.
The queries used to get the panel information are:
sum(rate(prometheus_target_sync_length_seconds_sum{job=~"kubernetes-service-endpoints",instance=~"(10\\.240\\.0\\.5:9093|10\\.240\\.0\\.76:9093|10\\.240\\.0\\.26:9114|10\\.240\\.0\\.253:8080|10\\.240\\.0\\.94:9090|10\\.240\\.1\\.199:9090|10\\.240\\.2\\.4:9090|10\\.240\\.2\\.204:9121|10\\.240\\.2\\.245:9121|10\\.240\\.3\\.10:9121)"}[2m])) by (scrape_job) * 1000
An example of this panel is shown below:
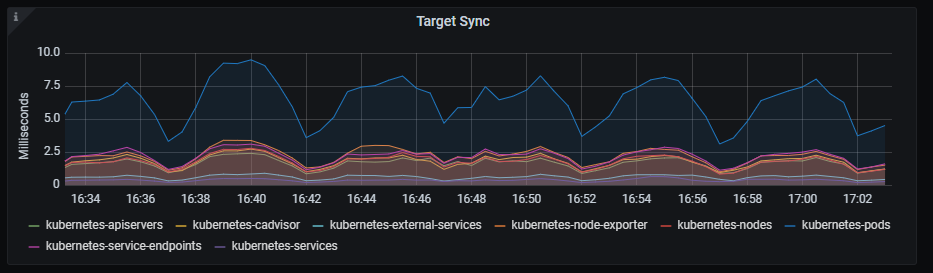
Scrape duration
Time series with the scrape duration in seconds.
The x-axis shows the time series and the y-axis shows the scrape duration in seconds.
The queries used to get the panel information are:
scrape_duration_seconds{instance=~"(10\\.240\\.0\\.5:9093|10\\.240\\.0\\.76:9093|10\\.240\\.0\\.26:9114|10\\.240\\.0\\.253:8080|10\\.240\\.0\\.94:9090|10\\.240\\.1\\.199:9090|10\\.240\\.2\\.4:9090|10\\.240\\.2\\.204:9121|10\\.240\\.2\\.245:9121|10\\.240\\.3\\.10:9121)"}
An example of this panel is shown below:
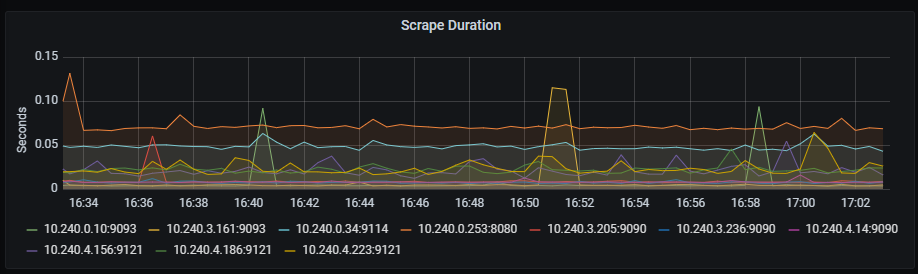
Rejected scrapes
Time series with the rejected scrapes.
The x-axis shows the time series and the y-axis shows the rejected scrapes for several reasons:
- Total number of scrapes that hit the sample limit and were rejected.
- Total number of scrapes samples duplicated.
- Total number of scrapes samples out of bounds.
- Total number of scrapes samples out of order.
The queries used to get the panel information are:
sum(prometheus_target_scrapes_exceeded_sample_limit_total{job=~"kubernetes-service-endpoints",instance=~"(10\\.240\\.0\\.5:9093|10\\.240\\.0\\.76:9093|10\\.240\\.0\\.26:9114|10\\.240\\.0\\.253:8080|10\\.240\\.0\\.94:9090|10\\.240\\.1\\.199:9090|10\\.240\\.2\\.4:9090|10\\.240\\.2\\.204:9121|10\\.240\\.2\\.245:9121|10\\.240\\.3\\.10:9121)"})
sum(prometheus_target_scrapes_sample_duplicate_timestamp_total{job=~"kubernetes-service-endpoints",instance=~"(10\\.240\\.0\\.5:9093|10\\.240\\.0\\.76:9093|10\\.240\\.0\\.26:9114|10\\.240\\.0\\.253:8080|10\\.240\\.0\\.94:9090|10\\.240\\.1\\.199:9090|10\\.240\\.2\\.4:9090|10\\.240\\.2\\.204:9121|10\\.240\\.2\\.245:9121|10\\.240\\.3\\.10:9121)"})
sum(prometheus_target_scrapes_sample_out_of_bounds_total{job=~"kubernetes-service-endpoints",instance=~"(10\\.240\\.0\\.5:9093|10\\.240\\.0\\.76:9093|10\\.240\\.0\\.26:9114|10\\.240\\.0\\.253:8080|10\\.240\\.0\\.94:9090|10\\.240\\.1\\.199:9090|10\\.240\\.2\\.4:9090|10\\.240\\.2\\.204:9121|10\\.240\\.2\\.245:9121|10\\.240\\.3\\.10:9121)"})
sum(prometheus_target_scrapes_sample_out_of_order_total{job=~"kubernetes-service-endpoints",instance=~"(10\\.240\\.0\\.5:9093|10\\.240\\.0\\.76:9093|10\\.240\\.0\\.26:9114|10\\.240\\.0\\.253:8080|10\\.240\\.0\\.94:9090|10\\.240\\.1\\.199:9090|10\\.240\\.2\\.4:9090|10\\.240\\.2\\.204:9121|10\\.240\\.2\\.245:9121|10\\.240\\.3\\.10:9121)"})
An example of this panel is shown below:
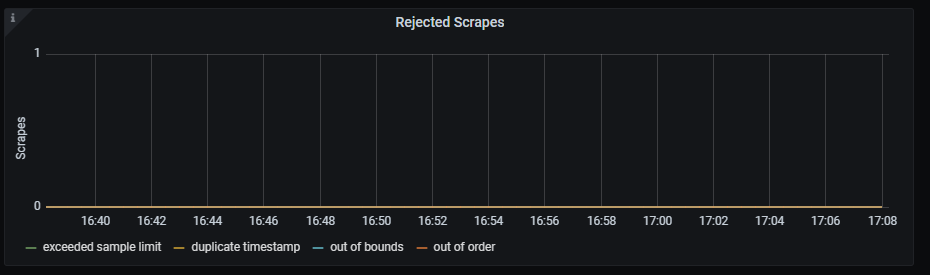
Average rule evaluation duration
Time series with the average duration of rule group evaluations, aggregated by five minutes.
The x-axis shows the time series and the y-axis shows the average duration of rule group evaluations.
The queries used to get the panel information are:
1000 * rate(prometheus_evaluator_duration_seconds_sum{job=~"kubernetes-service-endpoints", instance=~"(10\\.240\\.0\\.5:9093|10\\.240\\.0\\.76:9093|10\\.240\\.0\\.26:9114|10\\.240\\.0\\.253:8080|10\\.240\\.0\\.94:9090|10\\.240\\.1\\.199:9090|10\\.240\\.2\\.4:9090|10\\.240\\.2\\.204:9121|10\\.240\\.2\\.245:9121|10\\.240\\.3\\.10:9121)"}[5m]) /
rate(prometheus_evaluator_duration_seconds_count{job=~"kubernetes-service-endpoints", instance=~"(10\\.240\\.0\\.5:9093|10\\.240\\.0\\.76:9093|10\\.240\\.0\\.26:9114|10\\.240\\.0\\.253:8080|10\\.240\\.0\\.94:9090|10\\.240\\.1\\.199:9090|10\\.240\\.2\\.4:9090|10\\.240\\.2\\.204:9121|10\\.240\\.2\\.245:9121|10\\.240\\.3\\.10:9121)"}[5m])
An example of this panel is shown below:
HTTP request duration
Time series with the HTTP request duration, aggregated by one minute.
The x-axis shows the time series and the y-axis shows the http request duration.
The queries used to get the panel information are:
sum(rate(http_request_duration_microseconds_count{job=~"kubernetes-service-endpoints",instance=~"(10\\.240\\.0\\.5:9093|10\\.240\\.0\\.76:9093|10\\.240\\.0\\.26:9114|10\\.240\\.0\\.253:8080|10\\.240\\.0\\.94:9090|10\\.240\\.1\\.199:9090|10\\.240\\.2\\.4:9090|10\\.240\\.2\\.204:9121|10\\.240\\.2\\.245:9121|10\\.240\\.3\\.10:9121)"}[1m])) by (handler) > 0
An example of this panel is shown below:
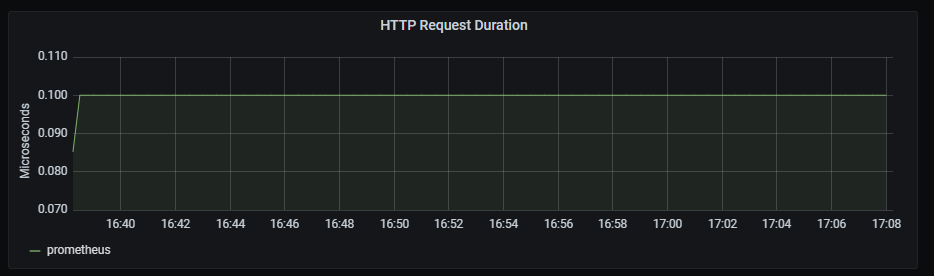
Prometheus engine query duration seconds
Time series with the engine query duration in seconds.
The x-axis shows the time series and the y-axis shows the engine query duration.
The queries used to get the panel information are:
sum(prometheus_engine_query_duration_seconds_sum{job=~"kubernetes-service-endpoints",instance=~"(10\\.240\\.0\\.5:9093|10\\.240\\.0\\.76:9093|10\\.240\\.0\\.26:9114|10\\.240\\.0\\.253:8080|10\\.240\\.0\\.94:9090|10\\.240\\.1\\.199:9090|10\\.240\\.2\\.4:9090|10\\.240\\.2\\.204:9121|10\\.240\\.2\\.245:9121|10\\.240\\.3\\.10:9121)"}) by (slice)
An example of this panel is shown below:
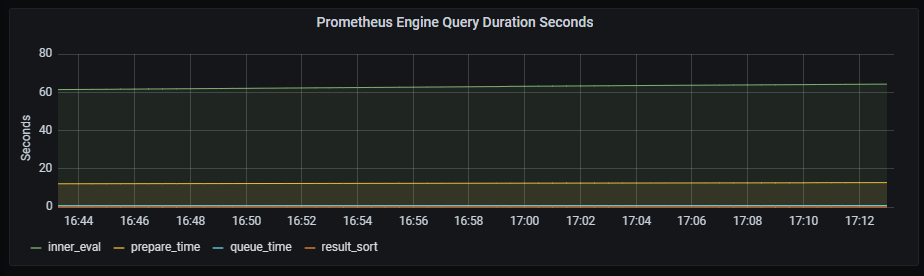
Rule evaluator iterations
Time series with the number of scheduled rule group evaluations, whether executed, missed or skipped.
The x-axis shows the time series and the y-axis shows the number of scheduled rule group evaluations.
The queries used to get the panel information are:
sum(rate(prometheus_evaluator_iterations_total{job=~"kubernetes-service-endpoints", instance=~"(10\\.240\\.0\\.5:9093|10\\.240\\.0\\.76:9093|10\\.240\\.0\\.26:9114|10\\.240\\.0\\.253:8080|10\\.240\\.0\\.94:9090|10\\.240\\.1\\.199:9090|10\\.240\\.2\\.4:9090|10\\.240\\.2\\.204:9121|10\\.240\\.2\\.245:9121|10\\.240\\.3\\.10:9121)"}[5m]))
sum(rate(prometheus_evaluator_iterations_missed_total{job=~"kubernetes-service-endpoints", instance=~"(10\\.240\\.0\\.5:9093|10\\.240\\.0\\.76:9093|10\\.240\\.0\\.26:9114|10\\.240\\.0\\.253:8080|10\\.240\\.0\\.94:9090|10\\.240\\.1\\.199:9090|10\\.240\\.2\\.4:9090|10\\.240\\.2\\.204:9121|10\\.240\\.2\\.245:9121|10\\.240\\.3\\.10:9121)"}[5m]))
sum(rate(prometheus_evaluator_iterations_skipped_total{job=~"kubernetes-service-endpoints", instance=~"(10\\.240\\.0\\.5:9093|10\\.240\\.0\\.76:9093|10\\.240\\.0\\.26:9114|10\\.240\\.0\\.253:8080|10\\.240\\.0\\.94:9090|10\\.240\\.1\\.199:9090|10\\.240\\.2\\.4:9090|10\\.240\\.2\\.204:9121|10\\.240\\.2\\.245:9121|10\\.240\\.3\\.10:9121)"}[5m]))
An example of this panel is shown below:
Notifications sent
Time series with the rate of sent notifications, aggregated by 5 minutes.
The x-axis shows the time series and the y-axis shows the rate of sent notifications.
The queries used to get the panel information are:
rate(prometheus_notifications_sent_total[5m])
An example of this panel is shown below:
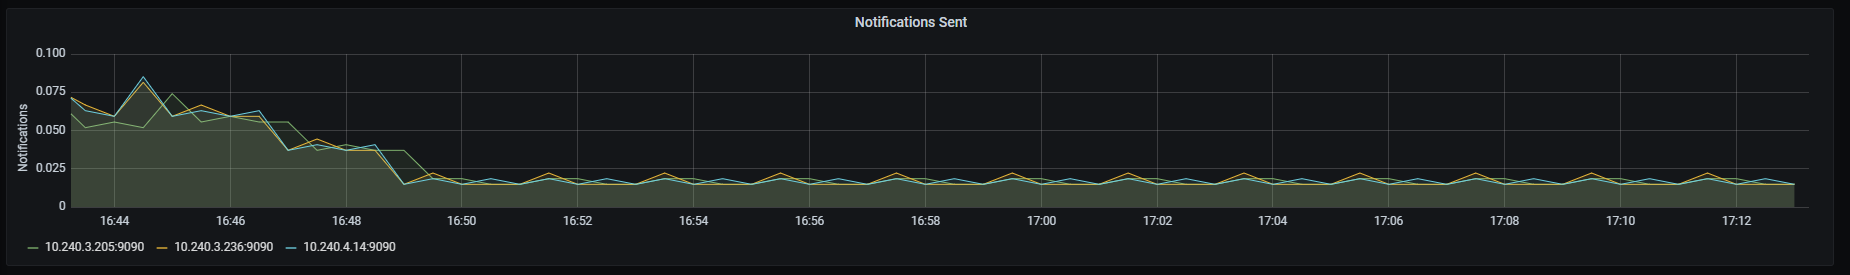
Minutes since successful config reload
Time series with the number of minutes since the last successful config reload.
The x-axis shows the time series and the y-axis shows the number of minutes since the last successful reload.
The queries used to get the panel information are:
(time() - prometheus_config_last_reload_success_timestamp_seconds{job=~"kubernetes-service-endpoints",instance=~"(10\\.240\\.0\\.5:9093|10\\.240\\.0\\.76:9093|10\\.240\\.0\\.26:9114|10\\.240\\.0\\.253:8080|10\\.240\\.0\\.94:9090|10\\.240\\.1\\.199:9090|10\\.240\\.2\\.4:9090|10\\.240\\.2\\.204:9121|10\\.240\\.2\\.245:9121|10\\.240\\.3\\.10:9121)"}) / 60
An example of this panel is shown below:
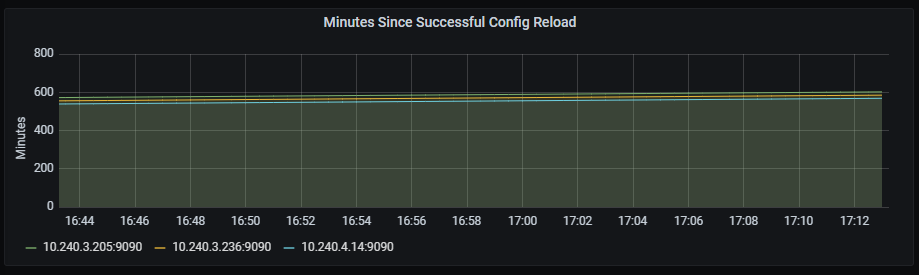
Successful config reload
Time series with the last successful reload.
The x-axis shows the time series and the y-axis shows the last successful reload.
The queries used to get the panel information are:
prometheus_config_last_reload_successful{job=~"kubernetes-service-endpoints",instance=~"(10\\.240\\.0\\.5:9093|10\\.240\\.0\\.76:9093|10\\.240\\.0\\.26:9114|10\\.240\\.0\\.253:8080|10\\.240\\.0\\.94:9090|10\\.240\\.1\\.199:9090|10\\.240\\.2\\.4:9090|10\\.240\\.2\\.204:9121|10\\.240\\.2\\.245:9121|10\\.240\\.3\\.10:9121)"}
An example of this panel is shown below:
GC rate
Time series with the GC invocation durations rate, aggregated by two minutes.
The x-axis shows the time series and the y-axis shows the GC invocation durations rate.
The queries used to get the panel information are:
sum(rate(go_gc_duration_seconds_sum{instance=~"(10\\.240\\.0\\.5:9093|10\\.240\\.0\\.76:9093|10\\.240\\.0\\.26:9114|10\\.240\\.0\\.253:8080|10\\.240\\.0\\.94:9090|10\\.240\\.1\\.199:9090|10\\.240\\.2\\.4:9090|10\\.240\\.2\\.204:9121|10\\.240\\.2\\.245:9121|10\\.240\\.3\\.10:9121)",job=~"kubernetes-service-endpoints"}[2m])) by (instance)
An example of this panel is shown below:
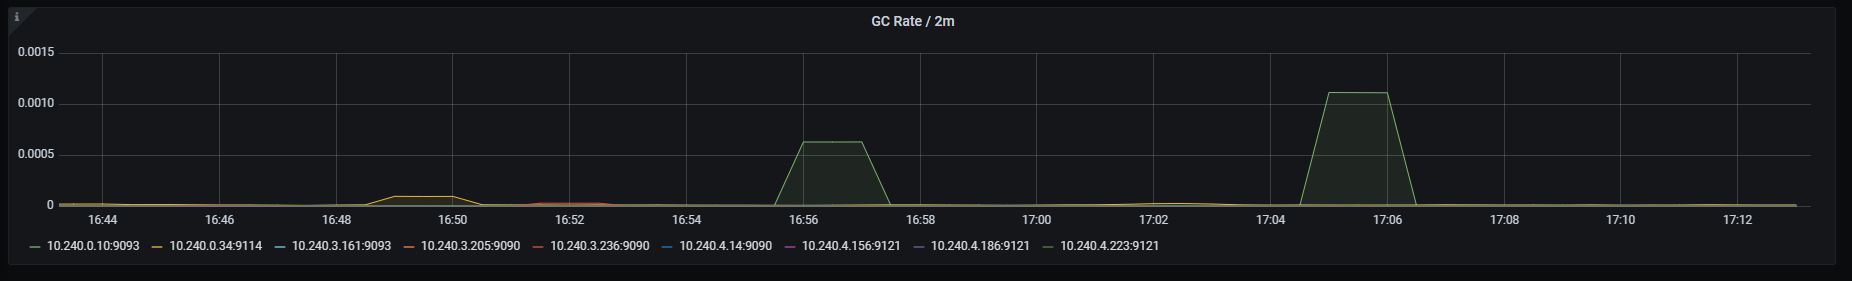
6.1.11 - Redis dashboard
Redis dashboard
Information provided by Redis dashboard
Introduction
Redis dashboard monitors multiple data and service-related metrics.
The available metrics are defined in the following sections.
Redis uptime
Uptime graph shows time since last restart/shutdown.
Metrics:
max(max_over_time(redis_uptime_in_seconds{kubernetes_name=~"redis-announce-0"}[$__interval]))
Graph visual
Redis clients
Clients graph shows number of connected clients.
Metrics:
redis_connected_clients{kubernetes_name=~"redis-announce-0"}
Graph visual
Redis memory usage
Memory usage graph shows percentage of used memory.
Metrics:
100 * (redis_memory_used_bytes{kubernetes_name=~"redis-announce-0"} / redis_memory_max_bytes{kubernetes_name=~"redis-announce-0"} )
Graph visual
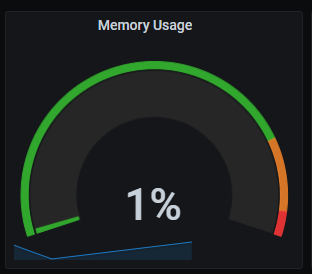
Redis commands executed per second
Commands executed per second graph shows the rate of commands executed per second, aggregated by one minute.
Metrics:
rate(redis_commands_processed_total{kubernetes_name=~"redis-announce-0"}[1m])
Graph visual
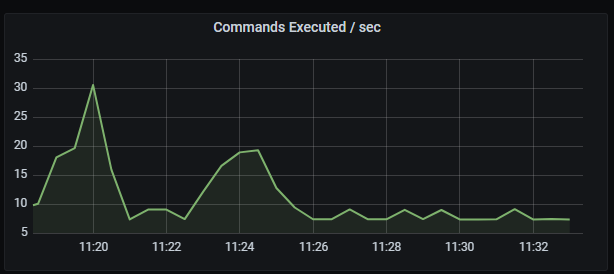
Redis commands executed per second
Commands executed per second graph shows the rate of commands executed per second, aggregated by one minute.
Metrics:
rate(redis_commands_processed_total{kubernetes_name=~"redis-announce-0"}[1m])
Graph visual
Redis hits/missed per second
Hits/missed per second graph shows the rate of hits and misses per second, aggregated by five minutes.
Metrics:
It includes two metrics:
irate(redis_keyspace_hits_total{kubernetes_name=~"redis-announce-0"}[5m])
irate(redis_keyspace_hits_total{kubernetes_name=~"redis-announce-0"}[5m])
Graph visual
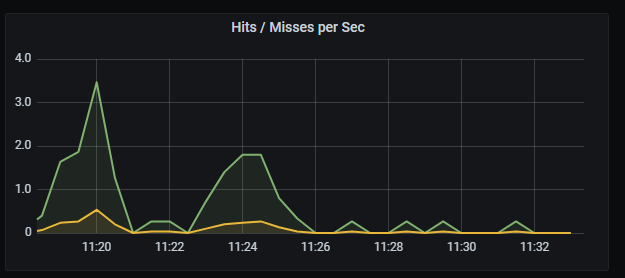
Redis total memory usage
Total memory usage graph shows total memory usage and total memory free + used.
Metrics:
It includes two metrics:
redis_memory_used_bytes{kubernetes_name=~"redis-announce-0"}
redis_memory_max_bytes{kubernetes_name=~"redis-announce-0"}
Graph visual
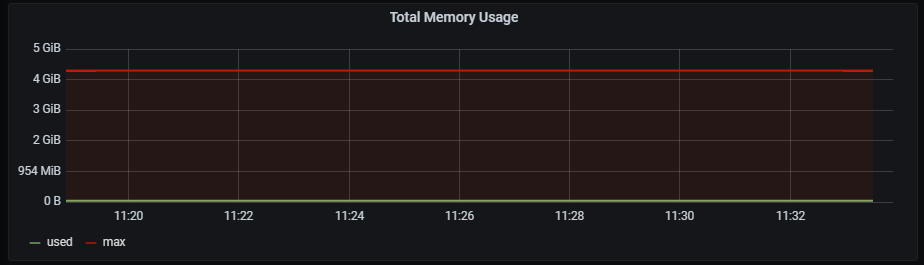
Redis network I/O
Network I/O graph shows rate of total in/out bytes, aggregated by 5 minutes.
Metrics:
It includes two metrics:
rate(redis_net_input_bytes_total{kubernetes_name=~"redis-announce-0"}[5m])
rate(redis_net_output_bytes_total{kubernetes_name=~"redis-announce-0"}[5m])
Graph visual
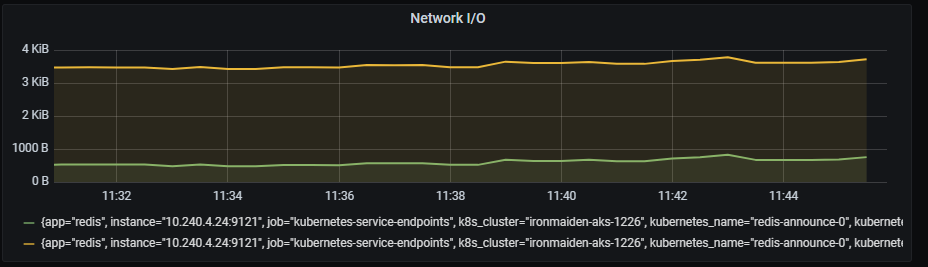
Redis total items per DB
Total items per DB graph shows total number of items separated by db number.
Metrics:
sum (redis_db_keys{kubernetes_name=~"redis-announce-0"}) by (db) > 0
Graph visual
Redis expiring vs not-expiring keys
Expiring vs not-expiring keys graph shows total number of expiring and not expiring keys.
Metrics:
It includes two metrics:
sum (redis_db_keys{kubernetes_name=~"redis-announce-0"}) - sum (redis_db_keys_expiring{kubernetes_name=~"redis-announce-0"})
sum (redis_db_keys_expiring{kubernetes_name=~"redis-announce-0"})
Graph visual
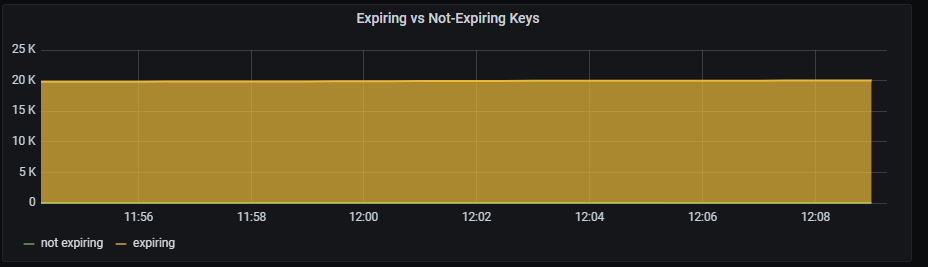
Redis expired/evicted
Expired/evicted graph shows total number of expired and evicted keys, aggregated by 5 minutes.
Metrics:
It includes two metrics:
sum(rate(redis_expired_keys_total{kubernetes_name=~"redis-announce-0"}[5m])) by (kubernetes_name)
sum(rate(redis_evicted_keys_total{kubernetes_name=~"redis-announce-0"}[5m])) by (kubernetes_name)
Graph visual
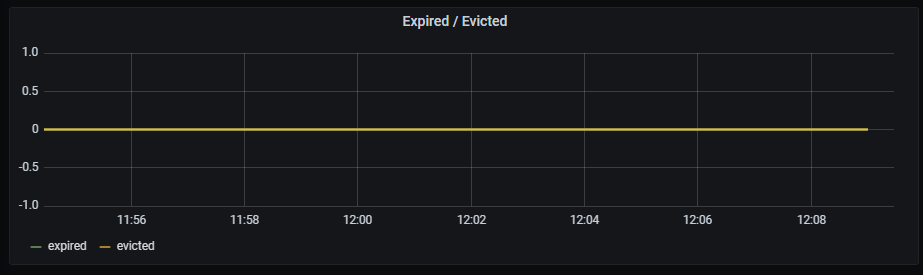
Redis command calls per second
Command calls per second graph shows top commands number of executions rate, aggregated by 5 minutes.
Metrics:
topk(5, irate(redis_commands_total{kubernetes_name=~"redis-announce-0"} [1m]))
Graph visual
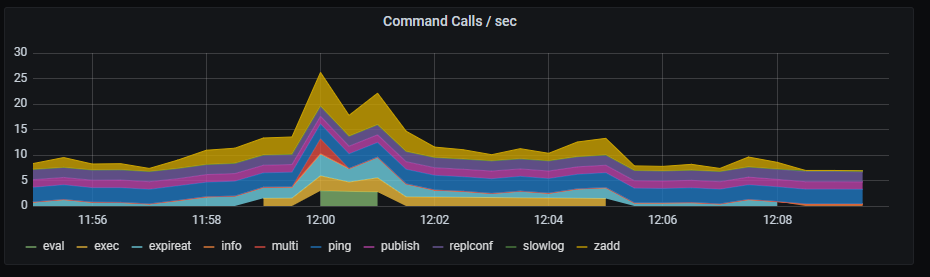
6.2 - Aura components dashboards
Aura components dashboards
Grafana dashboards with metrics related to the performance of specific Aura components
Introduction
Currently, these are the available dashboards for Aura components in Grafana based on metrics stored in Prometheus:
6.2.1 - Aura bot latencies dashboard
Aura bot latencies dashboard
Information provided by Aura bot latencies dashboard
Introduction
Aura bot latencies dashboard monitors outbound and inbound latencies on the request and responses handled directly by aura-bot.
The available metrics are defined in the following sections, corresponding to request errors and latency for requests, Microsoft APIs, Kernel APIs, Cognitive APIs, aura-services APIs and other APIs.
Request error
Request error graph shows the number of errors rate, aggregated by one minute.
Graph metrics
sum by (kubernetes_namespace,path)(rate(outgoing_request_duration_seconds_count{app="aura-bot",status=~"4..|500"}[1m]))
Graph visual
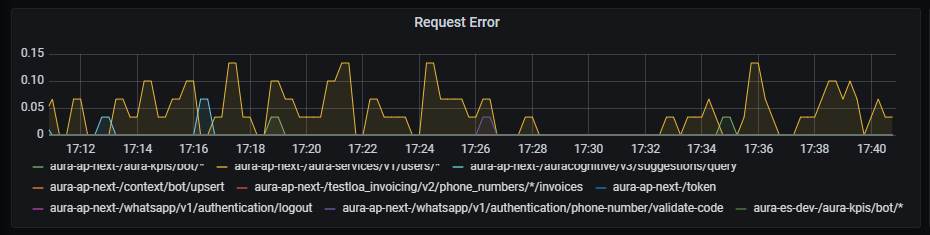
Request latency
Request latency graph shows latency rate for outgoing traffic, aggregated by one minute.
Graph metrics
sum by (path,kubernetes_namespace)(rate(outgoing_request_duration_seconds_sum{app="aura-bot"}[1m]))
Graph visual
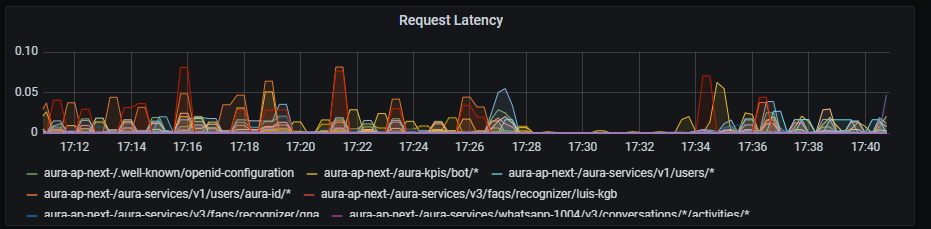
Microsoft APIs latency
Microsoft APIs latency graph shows mean latency rate for the different Microsoft APIs used.
Graph metrics
Currently, there are three monitored Microsoft endpoints:
sum by (path,kubernetes_namespace)(rate(outgoing_request_duration_seconds_sum{app="aura-bot",host=~"directline.botframework.com"}[1m]))/
sum by (path,kubernetes_namespace)(rate(outgoing_request_duration_seconds_count{app="aura-bot",host=~"directline.botframework.com"}[1m]))
sum by (path,kubernetes_namespace)(rate(outgoing_request_duration_seconds_sum{app="aura-bot",host=~"login.microsoftonline.com"}[1m]))/
sum by (path,kubernetes_namespace)(rate(outgoing_request_duration_seconds_count{app="aura-bot",host=~"login.microsoftonline.com"}[1m]))
sum (label_replace(outgoing_request_duration_seconds_sum{app="aura-bot",host=~"aura.*blob.core.windows.net",path=~"/aura-temporary-resources/.*"},"path_set","$1","path","/aura-temporary-resources/.*")) by (path_set,kubernetes_namespace) /
sum (label_replace(outgoing_request_duration_seconds_count{app="aura-bot",host=~"aura.*blob.core.windows.net",path=~"/aura-temporary-resources/.*"},"path_set","$1","path","/aura-temporary-resources/.*")) by (path_set,kubernetes_namespace)
Graph visual
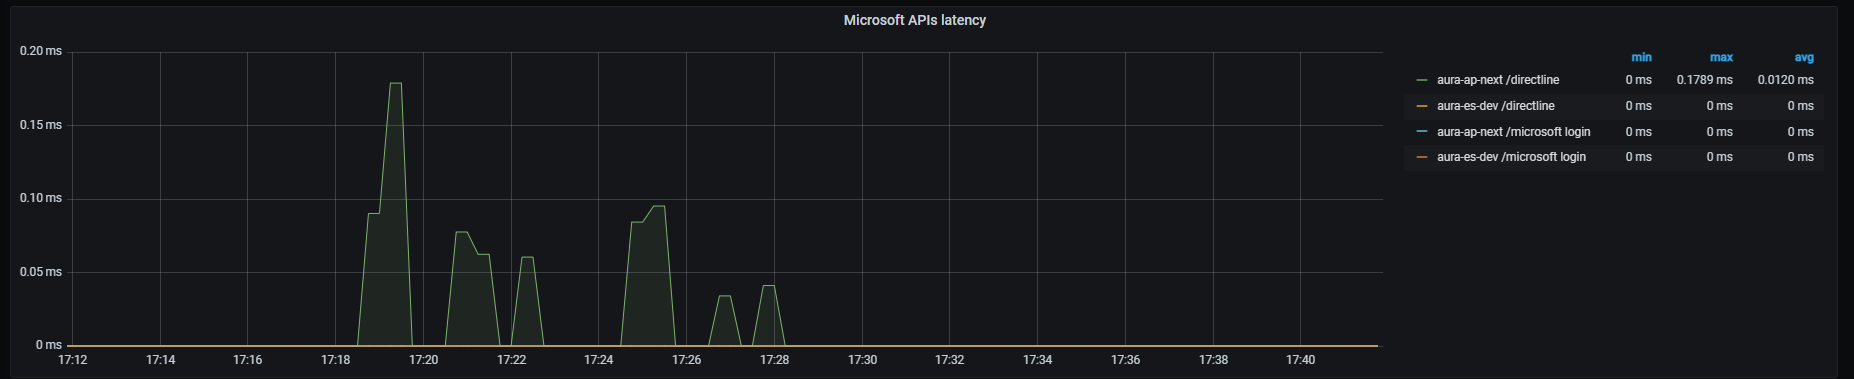
Kernel APIs latency
Kernel APIs latency graph shows mean latency rate for the different Kernel APIs used.
Graph metrics
Currently, there are four monitored Kernel endpoints (more can be added if necessary for a given environment):
sum by (kubernetes_namespace,path)(rate(outgoing_request_duration_seconds_sum{app="aura-bot",host=~"auth.*"}[1m]))/
sum by (kubernetes_namespace,path)(rate(outgoing_request_duration_seconds_count{app="aura-bot",host=~"auth.*"}[1m]))
- Kernel subscribed products endpoint
sum by (kubernetes_namespace,path)(rate(outgoing_request_duration_seconds_sum{app="aura-bot",host=~"api.*",path=~"/subscribed_products/.*"}[1m]))/
sum by (kubernetes_namespace,path)(rate(outgoing_request_duration_seconds_count{app="aura-bot",host=~"api.*",path=~"/subscribed_products/.*"}[1m]))
- Kernel user profile endpoint
sum by (kubernetes_namespace,path)(rate(outgoing_request_duration_seconds_sum{app="aura-bot",host=~"api.*",path=~"/userprofile/.*"}[1m]))/
sum by (kubernetes_namespace,path)(rate(outgoing_request_duration_seconds_count{app="aura-bot",host=~"api.*",path=~"/userprofile/.*"}[1m]))
sum by (kubernetes_namespace,path)(rate(outgoing_request_duration_seconds_sum{app="aura-bot",host=~"api.*",path=~"/invoicing/.*"}[1m]))/
sum by (kubernetes_namespace,path)(rate(outgoing_request_duration_seconds_count{app="aura-bot",host=~"api.*",path=~"/invoicing/.*"}[1m]))
Graph visual
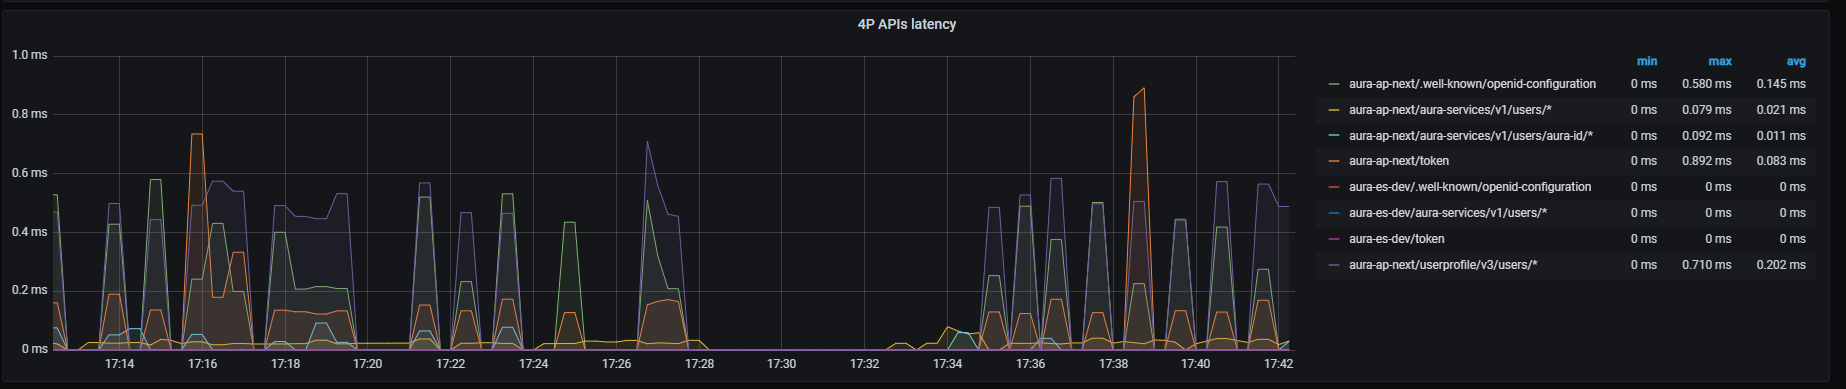
Cognitive APIs latency
Cognitive APIs latency graph shows mean latency rate for the different cognitive APIs used.
Graph metrics
Currently, there are three monitored Cognitive endpoints:
- Domain classifier endpoint
sum by (kubernetes_namespace,path)(rate(outgoing_request_duration_seconds_sum{app="aura-bot",host=~"api-.*",path=~"/auracognitive/v3/domain_classifier/.*"}[1m]))/
sum by (kubernetes_namespace,path)(rate(outgoing_request_duration_seconds_count{app="aura-bot",host=~"api-.*",path=~"/auracognitive/v3/domain_classifier/.*"}[1m]))
- Mplus resolution endpoint
sum by (kubernetes_namespace,path)(rate(outgoing_request_duration_seconds_sum{app="aura-bot",host=~"api-.*",path=~"/auracognitive/v3/mplus_resolution/.*"}[1m]))/
sum by (kubernetes_namespace,path)(rate(outgoing_request_duration_seconds_count{app="aura-bot",host=~"api-.*",path=~"/auracognitive/v3/mplus_resolution/.*"}[1m]))
sum by (kubernetes_namespace,path)(rate(outgoing_request_duration_seconds_sum{app="aura-bot",host=~"api-.*",path=~"/auracognitive/v3/suggestions/.*"}[1m]))/
sum by (kubernetes_namespace,path)(rate(outgoing_request_duration_seconds_count{app="aura-bot",host=~"api-.*",path=~"/auracognitive/v3/suggestions/.*"}[1m]))
Graph visual
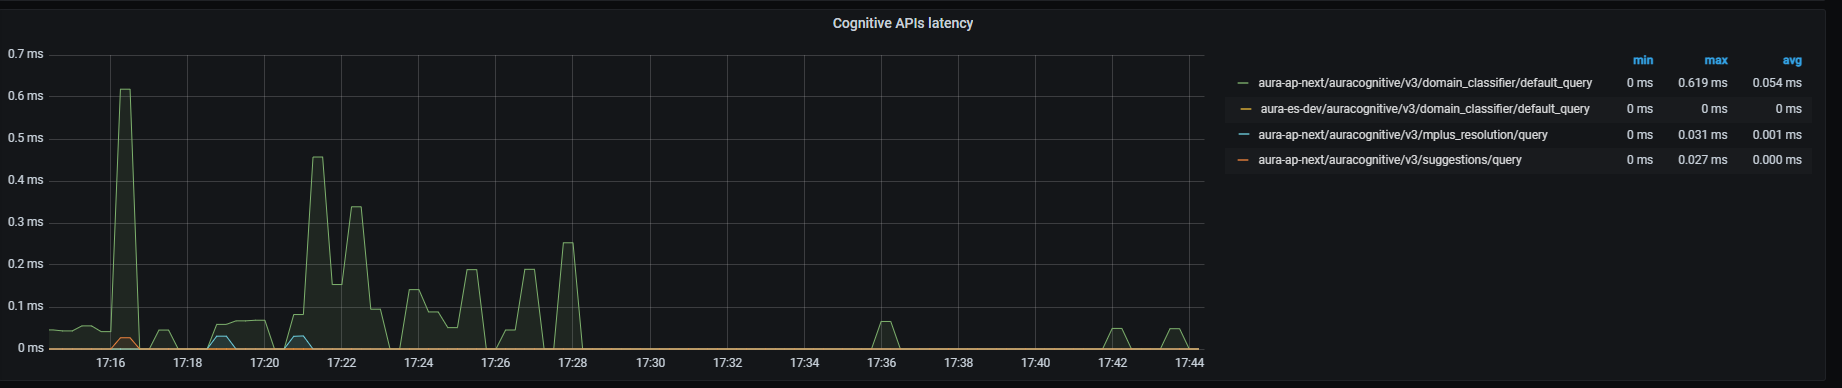
Aura-services APIs latency
Graph metrics
sum by (path,kubernetes_namespace)(rate(outgoing_request_duration_seconds_sum{app="aura-bot", path=~"/aura-services/.*"}[1m]))/
sum by (path,kubernetes_namespace)(rate(outgoing_request_duration_seconds_count{app="aura-bot", path=~"/aura-services/.*"}[1m]))
Graph visual
Other APIs latency
Other APIs latency graph shows mean latency rate for traffic directed to other APIs different from those above, aggregated by one minute.
Graph metrics
Currently, the only API monitored is Genesys API:
sum (label_replace(outgoing_request_duration_seconds_sum{app="aura-bot",path=~"/genesys/.*"},"path_set","$1","path","/genesys/.*")) by (path_set,kubernetes_namespace) / sum (label_replace(outgoing_request_duration_seconds_count{app="aura-bot",path=~"/genesys/.*"},"path_set","$1","path","/genesys/.*")) by (path_set,kubernetes_namespace)
Graph visual
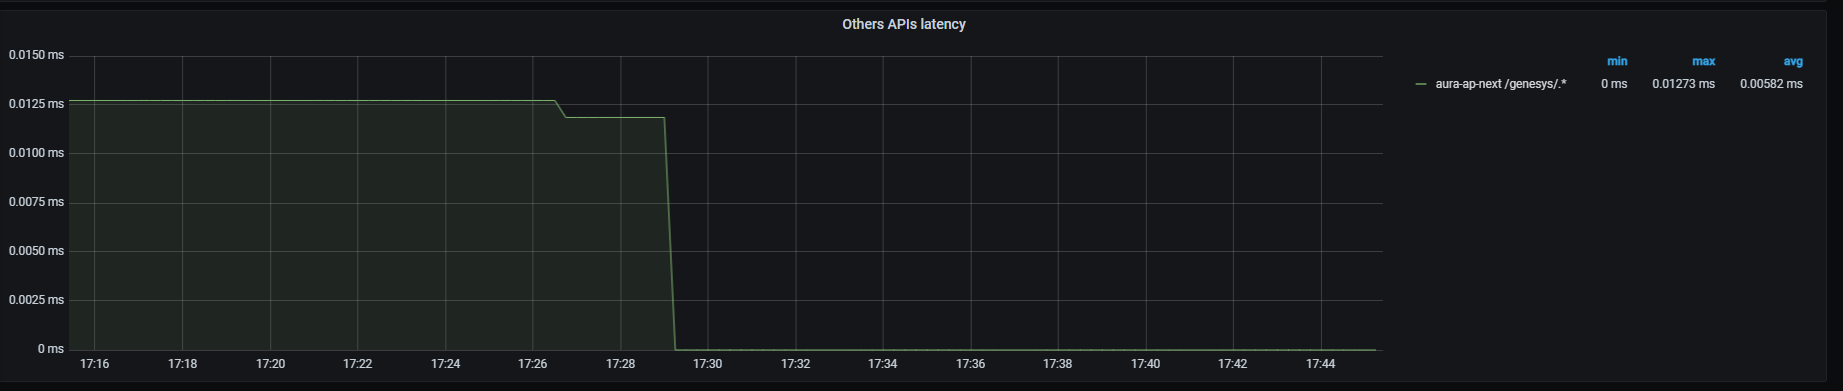
Service API
Service API graph shows mean latency rate for the main endpoint on aura-bridge, that receives requests from Direct Line and aura-bridge. Aggregated by one minute.
Graph metrics
sum by (path,kubernetes_namespace)(rate(http_request_duration_seconds_sum{path=~"/api/messages"}[1m]))/
sum by (path,kubernetes_namespace)(rate(http_request_duration_seconds_count{path=~"/api/messages"}[1m]))
Graph visual
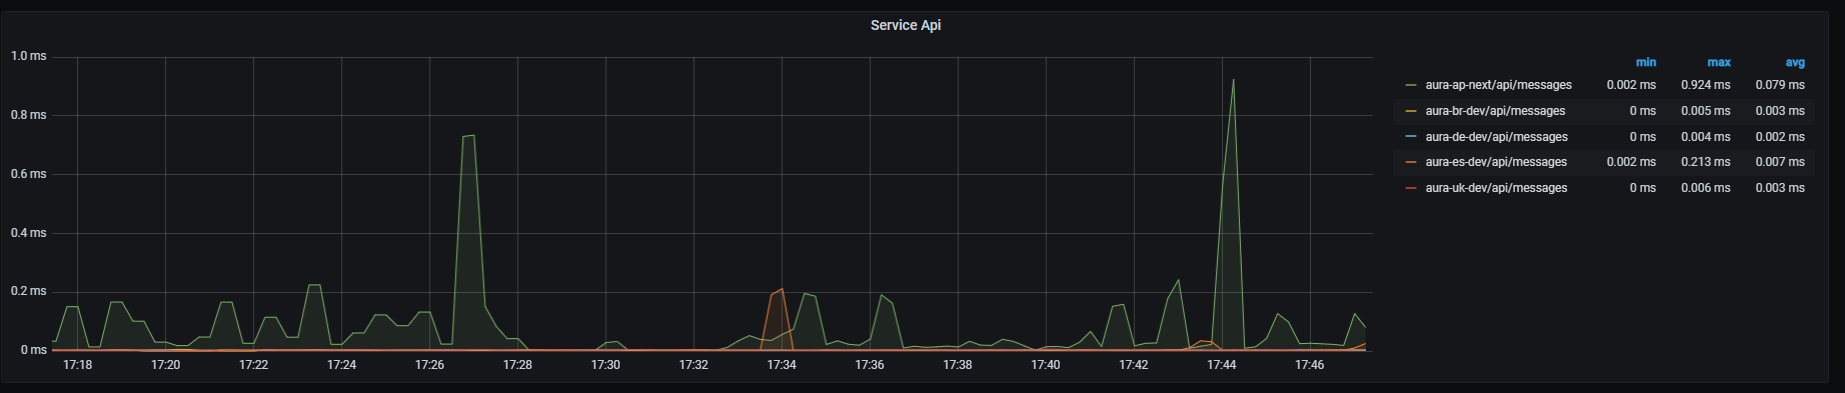
6.2.2 - Aura bridge dashboard
Aura bridge dashboard
Information provided by Aura bridge dashboard
Aura bridge ack success
Ack success graph shows the number of successful acks rate, aggregated by three minutes.
The available metrics are defined in the following sections.
Graph metrics
sum by (origin,originStatus)(rate(aura_response_ack_duration_seconds_count{app="aura-bridge",origin=~"aura-bot|whatsapp|4p",originStatus="200"}[3m]))
Graph visual
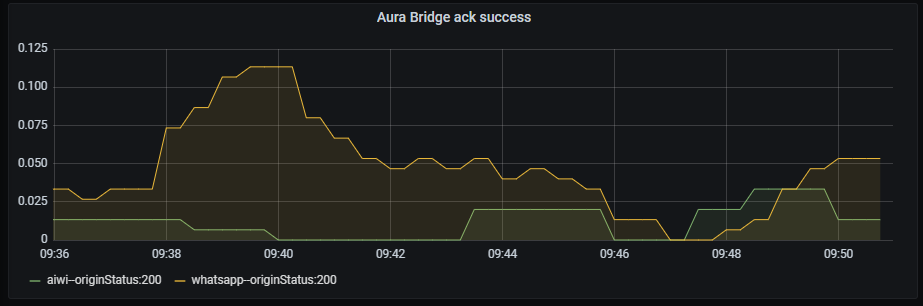
Aura bridge ack error
Ack error graph shows acks rate with an error status, aggregated by three minutes.
Graph metrics
sum by (origin,originStatus)(rate(aura_response_ack_duration_seconds_count{app="aura-bridge",origin=~"aura-bot|whatsapp|4p",originStatus!="200"}[3m]))
Graph visual
Aura bridge message success
Message success graph shows the number of successful messages rate, aggregated by three minutes.
Graph metrics
sum by (origin,originStatus)(rate(outgoing_message_duration_seconds_count{app="aura-bridge",origin=~"aura-bot|whatsapp|4p",originStatus="200"}[3m]))
Graph visual
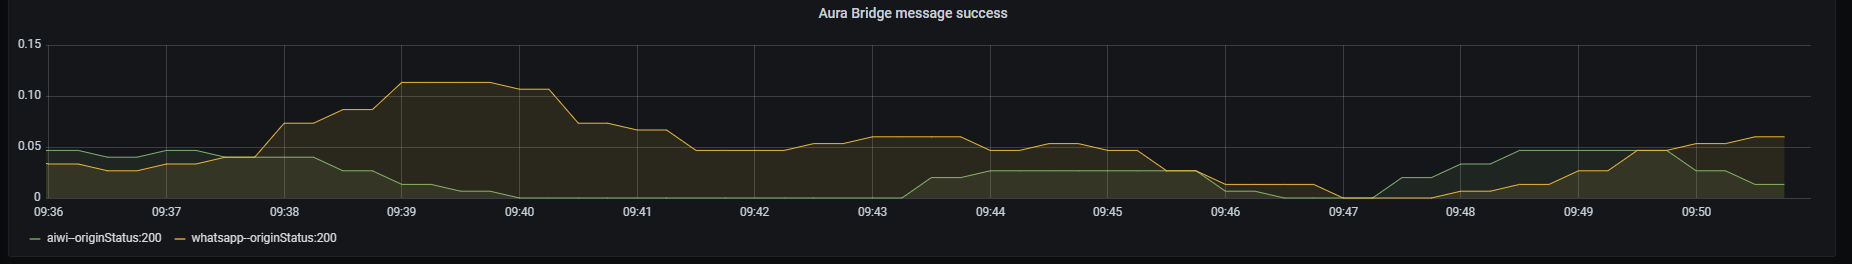
Aura bridge message error
Message error graph shows number of erroneous messages rate, aggregated by three minutes.
Graph metrics
sum by (origin,originStatus)(rate(outgoing_message_duration_seconds_count{app="aura-bridge",origin=~"aura-bot|whatsapp|4p",originStatus!="200"}[3m]))
Graph visual
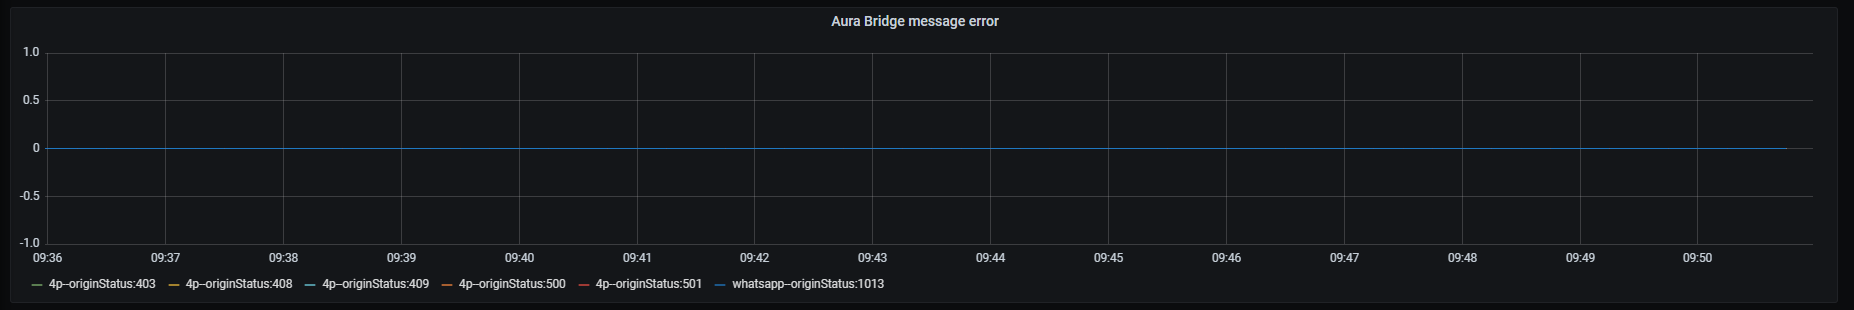
Aura bridge bot message error
They correspond to errors that aura-bridge receives from aura-bot. Bot message error graph shows the number of erroneous messages (sent by aura-bot) rate, aggregated by three minutes.
Graph metrics
sum by (origin,originStatus)(rate(outgoing_message_duration_seconds_count{app="aura-bridge",origin=~"aura-bot",originStatus!="200"}[3m]))
Graph visual
Aura bridge message - Kernel internal error
Kernel internal error graph shows number of erroneous messages (sent by Kernel) rate, regardless of the error type and aggregated by three minutes.
Graph metrics
sum by (origin,originStatus)(rate(outgoing_message_duration_seconds_count{app="aura-bridge",origin=~"4p",originStatus!="200"}[3m]))
Graph visual
Aura bridge message - Kernel HTTP error
Kernel HTTP error graph shows number of erroneous messages (sent by Kernel) rate, filtered by HTTP client errors and aggregated by three minutes.
Graph metrics
sum by (origin,httpStatus)(rate(outgoing_message_duration_seconds_count{app="aura-bridge",origin=~"4p",httpStatus=~"4.."}[3m]))
Graph visual
6.2.3 - Authentication API dashboard
Aura authentication API dashboard
Information provided by Authentication API dashboard
Aura services latency
Aura services latency graph shows mean latency rate for the different incoming calls.
The available metrics are defined in the following sections.
Graph metrics
Currently, these are the existing monitored incoming calls:
- WhatsApp users’ retrieval
sum by (kubernetes_namespace,path)(rate(http_request_duration_seconds_sum{path=~"/aura-services/v1/users/whatsapp.*"}[1m]))/
sum by (kubernetes_namespace,path)(rate(http_request_duration_seconds_count{path=~"/aura-services/v1/users/whatsapp.*"}[1m]))
sum by (kubernetes_namespace,path)(http_request_duration_seconds_sum{app="authentication-api",path=~"/aura-services/v1/users/aura-id"})/
sum by (kubernetes_namespace,path)(http_request_duration_seconds_count{app="authentication-api",path=~"/aura-services/v1/users/aura-id"})
sum (label_replace(http_request_duration_seconds_sum{app="authentication-api",path=~"/aura-services/v1/users/aura-id/.*"},"path_set","$1","path","/aura-services/v1/users/aura-id/.*")) by (kubernetes_namespace,path_set) /
sum (label_replace(http_request_duration_seconds_count{app="authentication-api",path=~"/aura-services/v1/users/aura-id/.*"},"path_set","$1","path","/aura-services/v1/users/aura-id/.*")) by (kubernetes_namespace,path_set)
- Retrieves an Aura user by the given
auraIdGlobal and the channelId
sum (label_replace(http_request_duration_seconds_sum{app="authentication-api",path=~"/aura-services/v1/users/aura-id-global/.*"},"path_set","$1","path","/aura-services/v1/users/aura-id-global/.*")) by (kubernetes_namespace,path_set) /
sum (label_replace(http_request_duration_seconds_count{app="authentication-api",path=~"/aura-services/v1/users/aura-id-global/.*"},"path_set","$1","path","/aura-services/v1/users/aura-id-global/.*")) by (kubernetes_namespace,path_set)
- Gets given authorization and identification information to register the user
sum (label_replace(http_request_duration_seconds_sum{app="authentication-api",path=~"/aura-services/v1/users/auraid/integrated/.*"},"path_set","$1","path","/aura-services/v1/users/auraid/integrated/.*")) by (kubernetes_namespace,path_set) /
sum (label_replace(http_request_duration_seconds_count{app="authentication-api",path=~"/aura-services/v1/users/auraid/integrated/.*"},"path_set","$1","path","/aura-services/v1/users/auraid/integrated/.*")) by (kubernetes_namespace,path_set)
sum by (kubernetes_namespace,path)(http_request_duration_seconds_sum{app="authentication-api",path=~"/aura-services/v1/users/auraid/integrated/logout"})/
sum by (kubernetes_namespace,path)(http_request_duration_seconds_count{app="authentication-api",path=~"/aura-services/v1/users/auraid/integrated/logout"})
sum by (kubernetes_namespace,path)(http_request_duration_seconds_sum{app="authentication-api",path=~"/aura-services/v1/token"})/
sum by (kubernetes_namespace,path)(http_request_duration_seconds_count{app="authentication-api",path=~"/aura-services/v1/token"})
- New Direct Line token(wss)
sum by (kubernetes_namespace,path)(http_request_duration_seconds_sum{app="authentication-api",path=~"/aura-services/v1/token/wss"})/
sum by (kubernetes_namespace,path)(http_request_duration_seconds_count{app="authentication-api",path=~"/aura-services/v1/token/wss"})
sum by (kubernetes_namespace,path)(http_request_duration_seconds_sum{app="authentication-api",path=~"/aura-services/v1/openid/issuer/.well-known/openid-configuration"})/
sum by (kubernetes_namespace,path)(http_request_duration_seconds_count{app="authentication-api",path=~"/aura-services/v1/openid/issuer/.well-known/openid-configuration"})
sum by (kubernetes_namespace,path)(http_request_duration_seconds_sum{app="authentication-api",path=~"/aura-services/v1/openid/jwk"})/
sum by (kubernetes_namespace,path)(http_request_duration_seconds_count{app="authentication-api",path=~"/aura-services/v1/openid/jwk"})
sum (label_replace(http_request_duration_seconds_sum{app="authentication-api",path=~"/users/aura-id/.*"},"path_set","$1","path","/users/aura-id/.*")) by (kubernetes_namespace,path_set) /
sum (label_replace(http_request_duration_seconds_count{app="authentication-api",path=~"/users/aura-id/.*"},"path_set","$1","path","/users/aura-id/.*")) by (kubernetes_namespace,path_set)
sum (label_replace(http_request_duration_seconds_sum{app="authentication-api",path=~"/aura-services/v1/admin/users/phone-numbers/.*"},"path_set","$1","path","/aura-services/v1/admin/users/phone-numbers/.*")) by (kubernetes_namespace,path_set) /
sum (label_replace(http_request_duration_seconds_count{app="authentication-api",path=~"/aura-services/v1/admin/users/phone-numbers/.*"},"path_set","$1","path","/aura-services/v1/admin/users/phone-numbers/.*")) by (kubernetes_namespace,path_set)
Graph visual
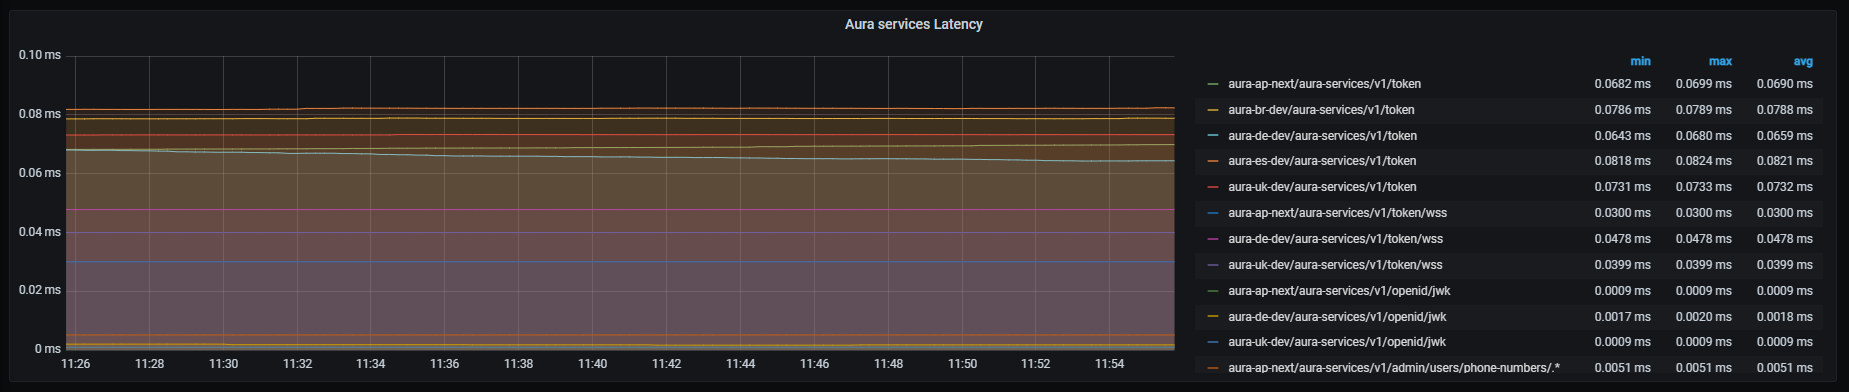
Request out error
Request out error graph shows error rate for outgoing requests with HTTP codes 4xx and 5xx, aggregated by 1 minute.
Graph metrics
sum by (kubernetes_namespace,path)(rate(outgoing_request_duration_seconds_count{app="authentication-api",status=~"4..|5.."}[1m]))
Graph visual
Microsoft APIs latency
Microsoft APIs latency graph shows mean latency rate for the different Microsoft APIs used.
Graph metrics
Currently, there are three monitored Microsoft endpoints:
sum by (kubernetes_namespace,path)(rate(outgoing_request_duration_seconds_sum{app="authentication-api",host=~"directline.botframework.com"}[1m]))/
sum by (kubernetes_namespace,path)(rate(outgoing_request_duration_seconds_count{app="authentication-api",host=~"directline.botframework.com"}[1m]))
sum by (kubernetes_namespace,path)(rate(outgoing_request_duration_seconds_sum{app="authentication-api",host=~"login.microsoftonline.com"}[1m]))/
sum by (kubernetes_namespace,path)(rate(outgoing_request_duration_seconds_count{app="authentication-api",host=~"login.microsoftonline.com"}[1m]))
sum by (kubernetes_namespace,path)(rate(outgoing_request_duration_seconds_sum{app="authentication-api",host=~"aura.*.blob.core.windows.net"}[1m]))/
sum by (kubernetes_namespace,path)(rate(outgoing_request_duration_seconds_count{app="authentication-api",host=~"aura.*.blob.core.windows.net"}[1m]))
Graph visual
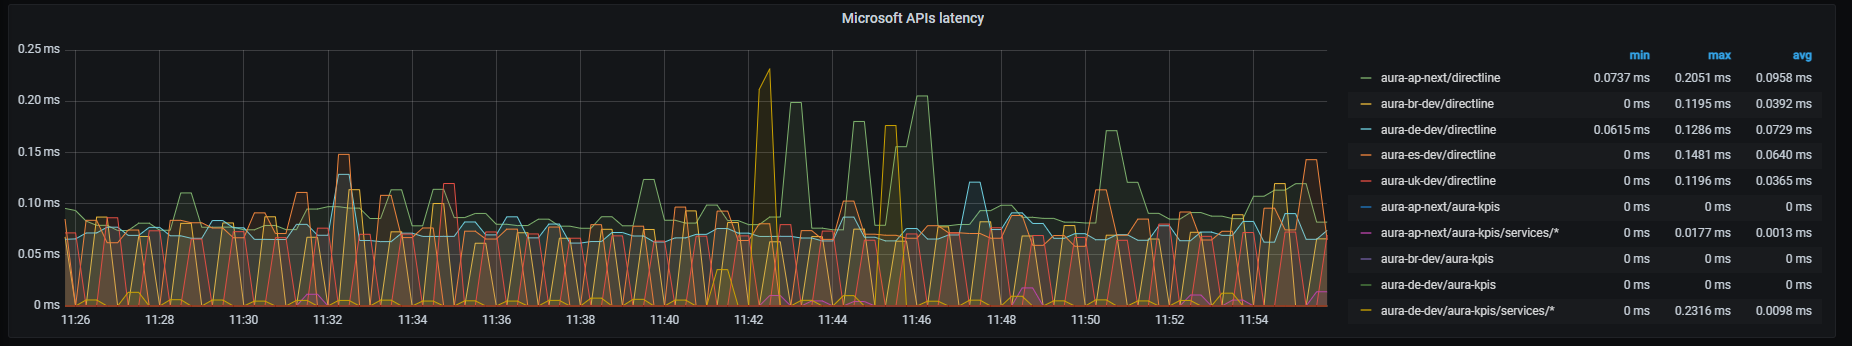
Kernel APIs latency
Kernel APIs latency graph shows mean latency rate for the different Kernel APIs used.
Graph metrics
Currently, there are three monitored Kernel endpoints:
- Kernel token retrieval endpoint
sum by (kubernetes_namespace,path)(rate(outgoing_request_duration_seconds_sum{app="authentication-api",host=~"auth.*",path="/token"}[1m]))/
sum by (kubernetes_namespace,path)(rate(outgoing_request_duration_seconds_count{app="authentication-api",host=~"auth.*",path="/token"}[1m]))
- Kernel token introspection endpoint
sum by (kubernetes_namespace,path)(rate(outgoing_request_duration_seconds_sum{app="authentication-api",host=~"api.*",path=~"/token-introspection/.*"}[1m]))/
sum by (kubernetes_namespace,path)(rate(outgoing_request_duration_seconds_count{app="authentication-api",host=~"api.*",path=~"/token-introspection/.*"}[1m]))
- Kernel open-id configuration endpoint
sum by (kubernetes_namespace,path)(rate(outgoing_request_duration_seconds_sum{app="authentication-api",host=~"auth.*",path="/.well-known/openid-configuration"}[1m]))/
sum by (kubernetes_namespace,path)(rate(outgoing_request_duration_seconds_count{app="authentication-api",host=~"auth.*",path="/.well-known/openid-configuration"}[1m]))
Graph visual
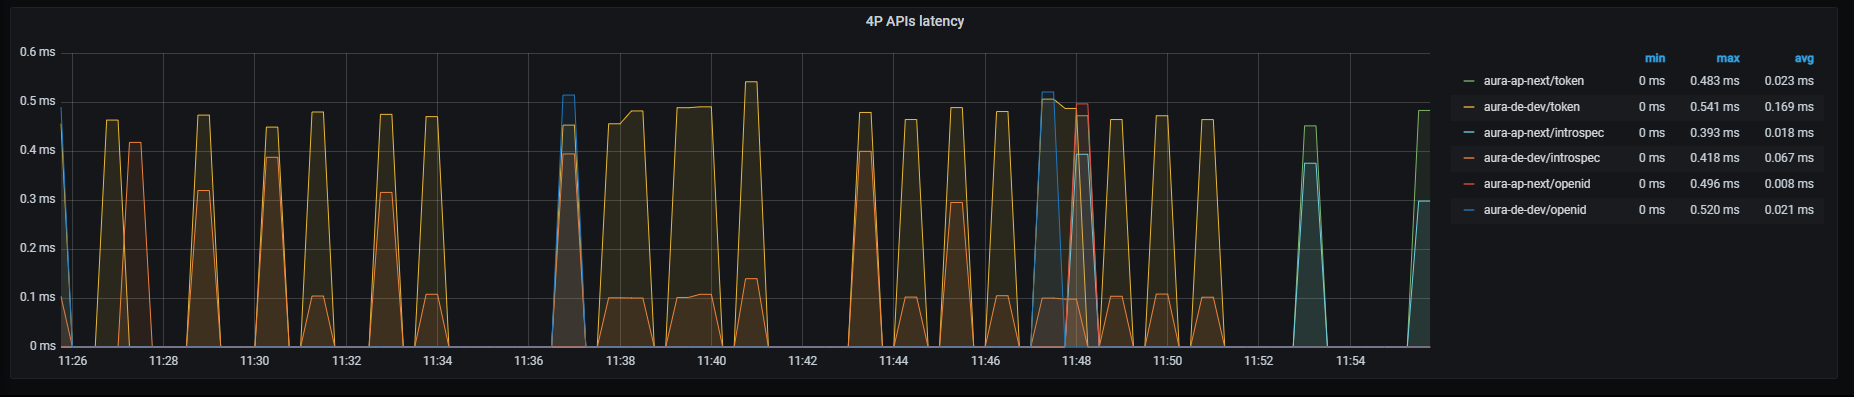
6.2.4 - Aura HTTP Inbound dashboard
Aura HTTP Inbound dashboard
Information provided Aura HTTP inbound dashboard
Introduction
HTTP inbound dashboard monitors inbound traffic to different services.
This inbound traffic can be visualized by channel, thus providing a detailed insight into the specific incoming traffic to this particular channel. It clearly improves the optimization of strategies for that channel or a performance comparison between different channels.
The available metrics are defined in the following sections.
HTTP request latency
HTTP request latency graph shows mean latency time aggregated by one minute.
Graph metrics
sum by (app, kubernetes_namespace)(rate(http_request_duration_seconds_sum{app=~'(aura-bot|aura-bridge|authentication-api|complex-logic|context|nlp|tac|thanos-querier)'}[1m])) /
sum by (app, kubernetes_namespace)(rate(http_request_duration_seconds_count{app=~'(aura-bot|aura-bridge|authentication-api|complex-logic|context|nlp|tac|thanos-querier)'}[1m]))
Graph visual
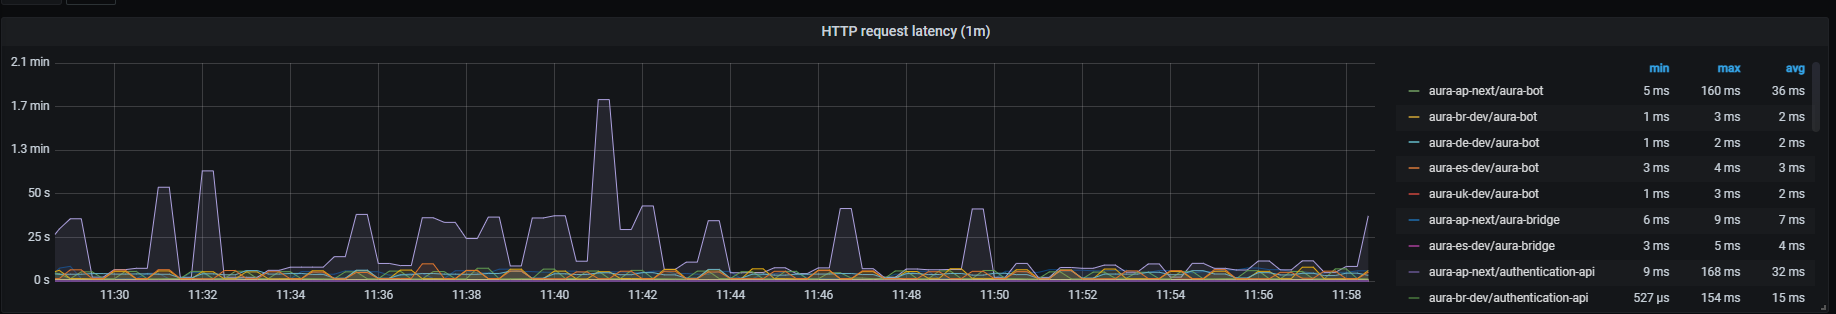
HTTP Request Rate
HTTP requests rate graph shows number of requests aggregated by one minute.
Graph metrics
sum by (app, kubernetes_namespace) (rate(http_request_duration_seconds_count{app=~'(aura-bot|aura-bridge|authentication-api|complex-logic|context|nlp|tac|thanos-querier)'}[1m]))
Graph visual
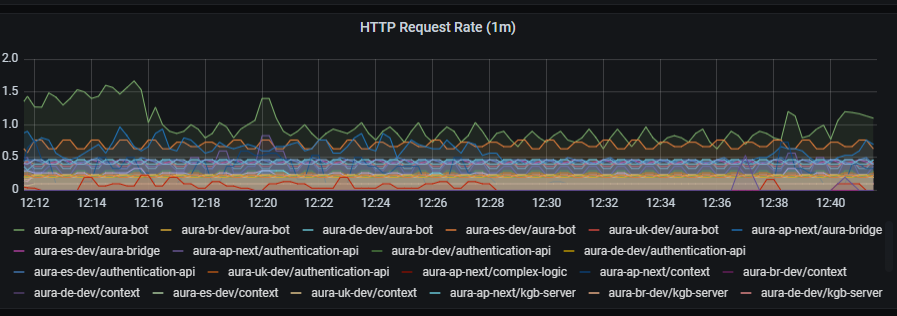
HTTP request latency
HTTP request latency graph shows request latency aggregated by one minute.
Graph metrics
sum by (app, kubernetes_namespace) (rate(http_request_duration_seconds_sum{app=~'(aura-bot|aura-bridge|authentication-api|complex-logic|context|nlp|tac|thanos-querier)'}[1m]))
Graph visual
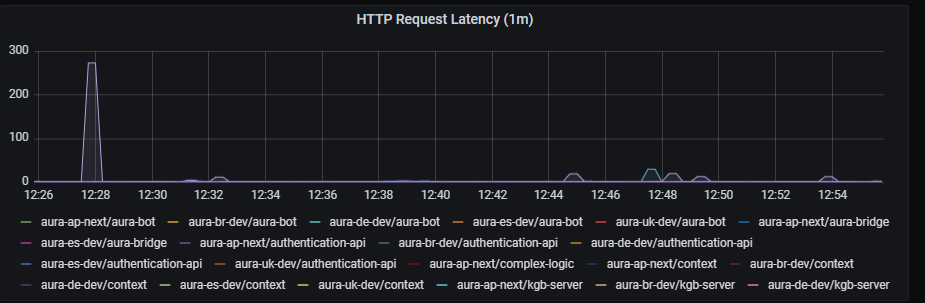
HTTP error rate
HTTP error rate shows rate of petition errors aggregated by one minute.
Graph metrics
sum by (app, kubernetes_namespace) (rate(http_request_duration_seconds_count{app=~'(aura-bot|aura-bridge|authentication-api|complex-logic|context|nlp|tac|thanos-querier)',status_code=~"4..|5.."}[1m]))
Graph visual
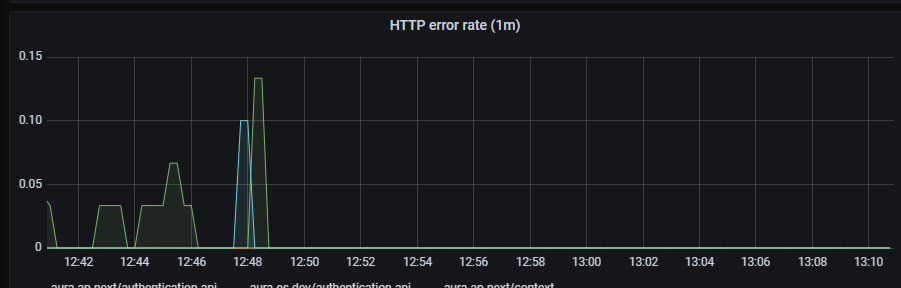
Errors
Errors graph shows errors duration aggregated by one minute.
Graph metrics
sum(rate(http_request_duration_seconds_count{app=~'(aura-bot|aura-bridge|authentication-api|complex-logic|context|nlp|tac|thanos-querier)',status_code=~"4..|5.."}[1m])) by (app, kubernetes_namespace)
Graph visual
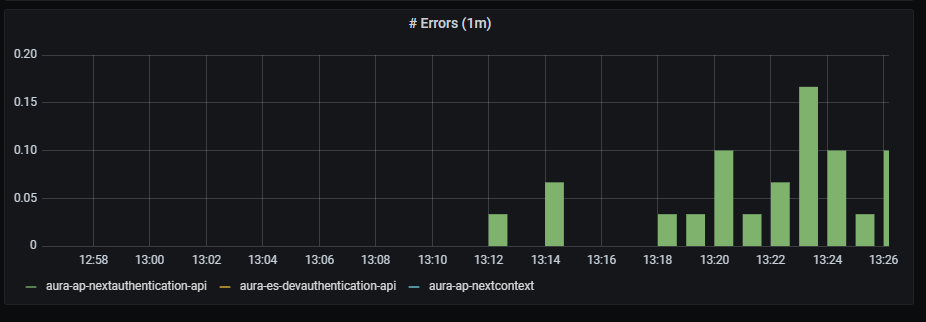
6.2.5 - Aura HTTP Outbound dashboard
Aura HTTP Outbound dashboard
Information provided Aura HTTP outbound dashboard
Introduction
HTTP outbound dashboard monitors outbound traffic to different services.
This outbound traffic can be visualized by channel, thus providing a detailed insight into the specific outgoing traffic from this particular channel. It clearly improves the optimization of strategies for that channel or a performance comparison between different channels.
The available metrics are defined in the following sections.
HTTP request latency
HTTP request latency graph shows mean latency time aggregated by one minute.
Graph metrics
sum by (app,kubernetes_namespace)(rate(outgoing_request_duration_seconds_sum{app=~'.*'}[1m])) / sum by (app,kubernetes_namespace)(rate(outgoing_request_duration_seconds_count{app=~'.*'}[1m]))
Graph visual
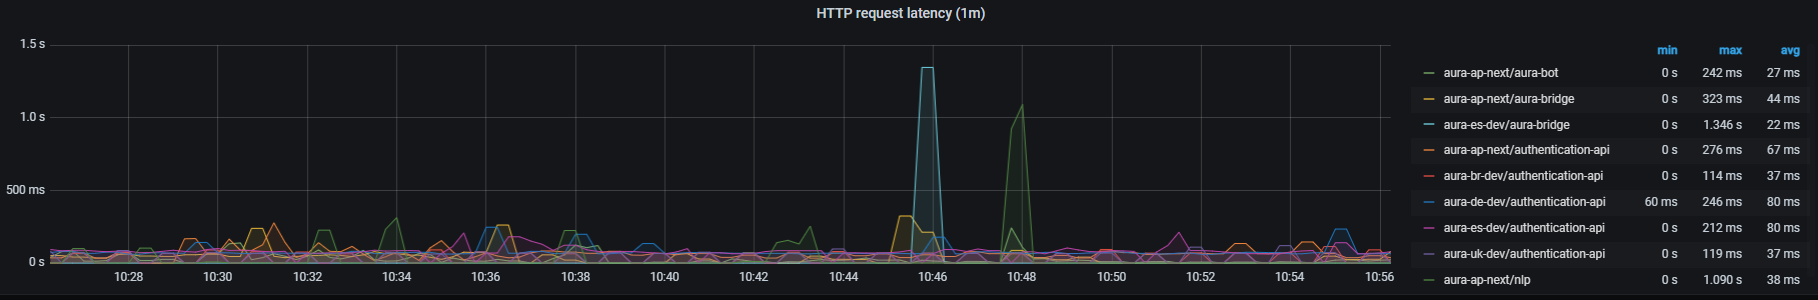
HTTP request rate
HTTP requests rate graph shows requests rate per second, aggregated by one minute.
Graph metrics
sum by (app,kubernetes_namespace) (rate(outgoing_request_duration_seconds_count{app=~'.*'}[1m]))
Graph visual
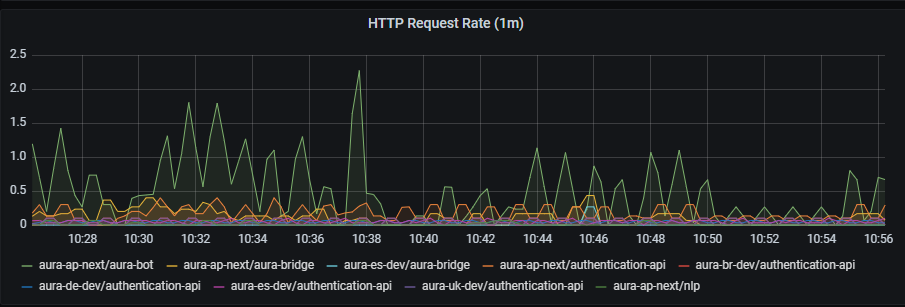
HTTP request latency
HTTP request latency graph shows request latency rate per second, aggregated by one minute.
Graph metrics
sum by (app,kubernetes_namespace) (rate(outgoing_request_duration_seconds_sum{app=~'.*'}[1m]))
Graph visual
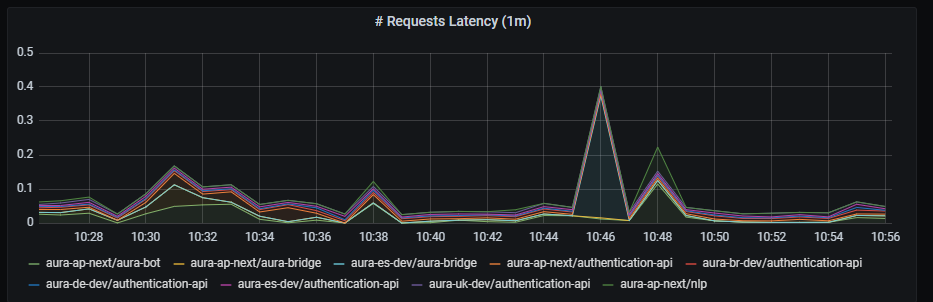
HTTP error rate
HTTP error rate shows request errors rate per second, aggregated by one minute
Graph metrics
sum by (app,kubernetes_namespace) (rate(outgoing_request_duration_seconds_count{app=~'.*',status=~"4..|5.."}[1m]))
Graph visual
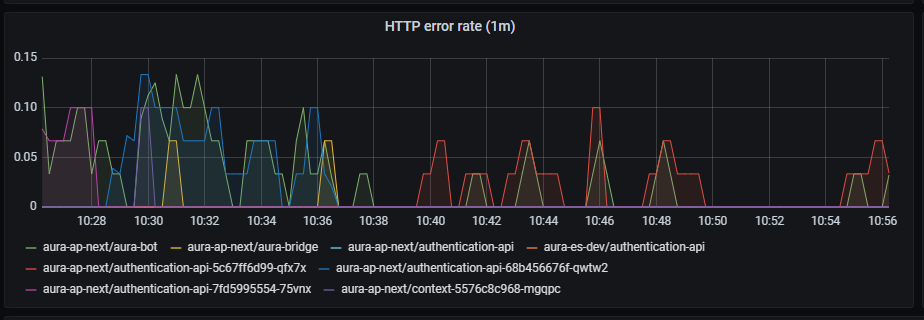
Errors
Errors graph shows errors duration aggregated by one minute.
Graph metrics
sum(rate(outgoing_request_duration_seconds_count{app=~'.*',status=~"4..|5.."}[1m])) by (app,kubernetes_namespace)
Graph visual
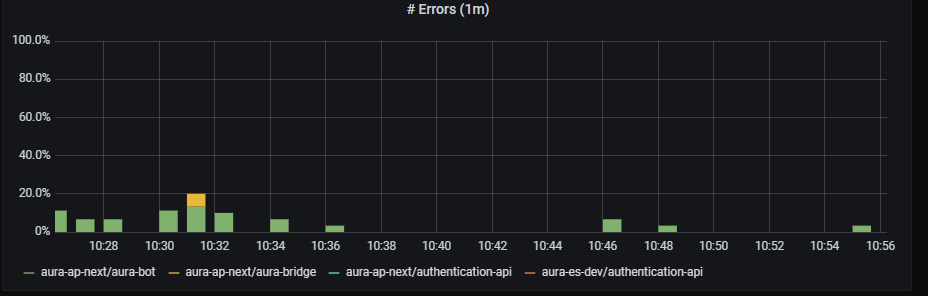
Aura bot backend latency
aura-bot backend latency shows mean latency rate on aura-bot backend, aggregated by one minute.
Graph metrics
sum(rate(outgoing_request_duration_seconds_sum{app=~"aura-bot"}[1m])) by (path,kubernetes_namespace)/sum(rate(outgoing_request_duration_seconds_count{app=~"aura-bot"}[1m])) by (path,kubernetes_namespace)
Graph visual
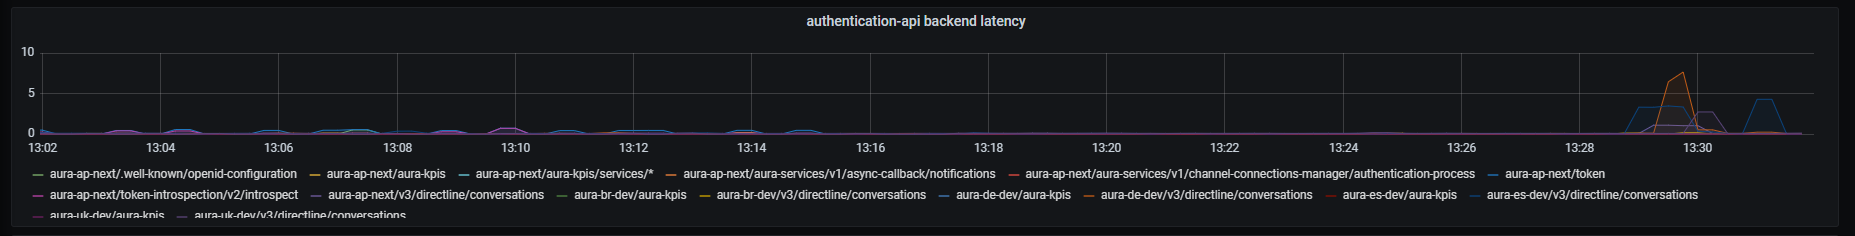
Authentication API backend latency
aura-authentication-api backend latency shows mean latency rate on aura-authentication-api backend, aggregated by one minute.
Graph metrics
sum(rate(outgoing_request_duration_seconds_sum{app=~"authentication-api"}[1m])) by (path,kubernetes_namespace)/sum(rate(outgoing_request_duration_seconds_count{app=~"authentication-api"}[1m])) by (path,kubernetes_namespace)
Graph visual
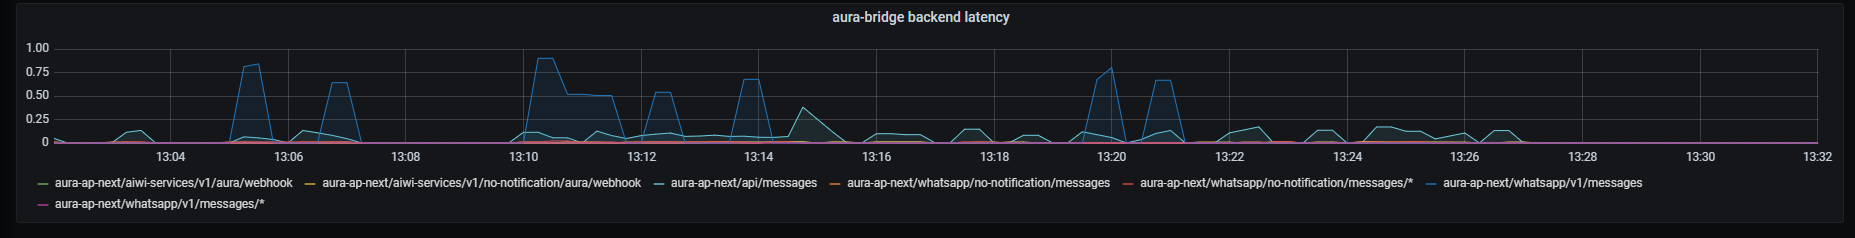
Aura bridge backend latency
aura-bridge backend latency shows mean latency rate on aura-bridge backend, aggregated by one minute.
Graph metrics
sum(rate(outgoing_request_duration_seconds_sum{app=~"aura-bridge"}[1m])) by (path,kubernetes_namespace)/sum(rate(outgoing_request_duration_seconds_count{app=~"aura-bridge"}[1m])) by (path,kubernetes_namespace)
Graph visual
6.2.6 - Pod resources dashboard
Pod resources dashboard
Information provided by Pod resources dashboard
Introduction
This is a unique dashboard to obtain the most basic information about how the environment pods behavior is.
To get the information about each pod, the dashboard counts on a filter with the following fields:
namespace: list of all the available namespaces of your deployment.pod: list of pods running in the selected namespace.container: list of containers running in the selected pod.DS_PROMETHEUS: Prometheus data source to be used. By default, Prometheus.
Once selected, the following graphs are printed, with the data of the pod.
Panels
Pod memory
Pod memory panel shows a time series with the current memory consumption in the selected pod. It also shows the current, maximum, minimum and average memory consumption of the Pod.
The x-axis shows the time series and the y-axis shows the amount of memory consumed by the pod.
The queries used to get the panel information are:
sum(kube_pod_container_resource_requests_memory_bytes{namespace="aura-<env>",pod="aura-bot-<id>"})
sum(kube_pod_container_resource_limits_memory_bytes{namespace="aura-<env>",pod="aura-bot-<id>"})
sum(container_memory_working_set_bytes{namespace="aura-<dev>",container!="POD",container!="",pod!="", pod="aura-bot-<id>"})
An example of this panel is shown below:
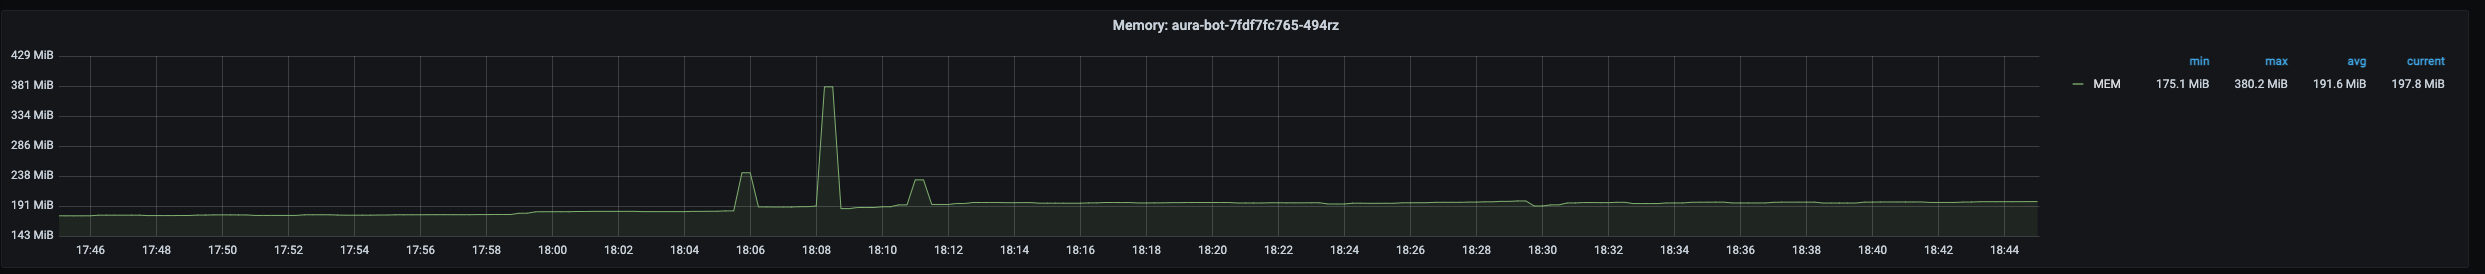
Container memory
Container memory panel shows a time series with the current memory consumption the selected container. It also shows the current, maximum, minimum and average memory consumption of the container.
The x-axis shows the time series and the y-axis shows the amount of memory consumed by the container.
The queries used to get the panel information are:
sum(kube_pod_container_resource_requests_memory_bytes{namespace="aura-<env>",pod="aura-bot-<id>",container="aura-bot"})
sum(kube_pod_container_resource_limits_memory_bytes{namespace="aura-<env>",pod="aura-bot-<id>",container="aura-bot"})
sum(container_memory_working_set_bytes{namespace="aura-<dev>",container!="POD",container!="",pod!="", pod="aura-bot-<id>",container="aura-bot"}) by (container)
An example of this panel is shown below:
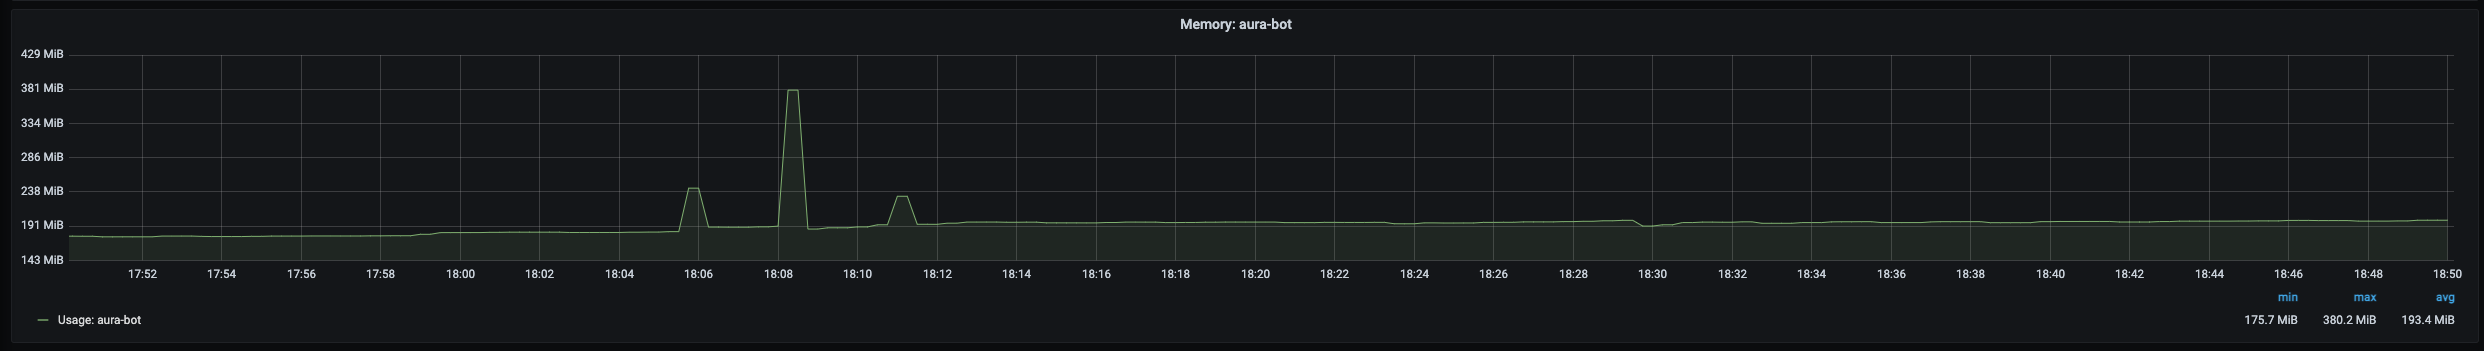
Pod network
Pod network panel shows a time series with the current I/O network consumption of the selected pod. It also shows the current, maximum, minimum and average network consumption of the pod.
The x-axis shows the time series and the y-axis shows the amount of bytes consumed by the pod.
The queries used to get the panel information are:
sum(rate(container_network_receive_bytes_total{namespace="aura-<env>",pod="aura-bot-<id>"}[5m]))
sum(rate(container_network_transmit_bytes_total{namespace="aura-<env>",pod="aura-bot-<id>"}[5m]))
An example of this panel is shown below:
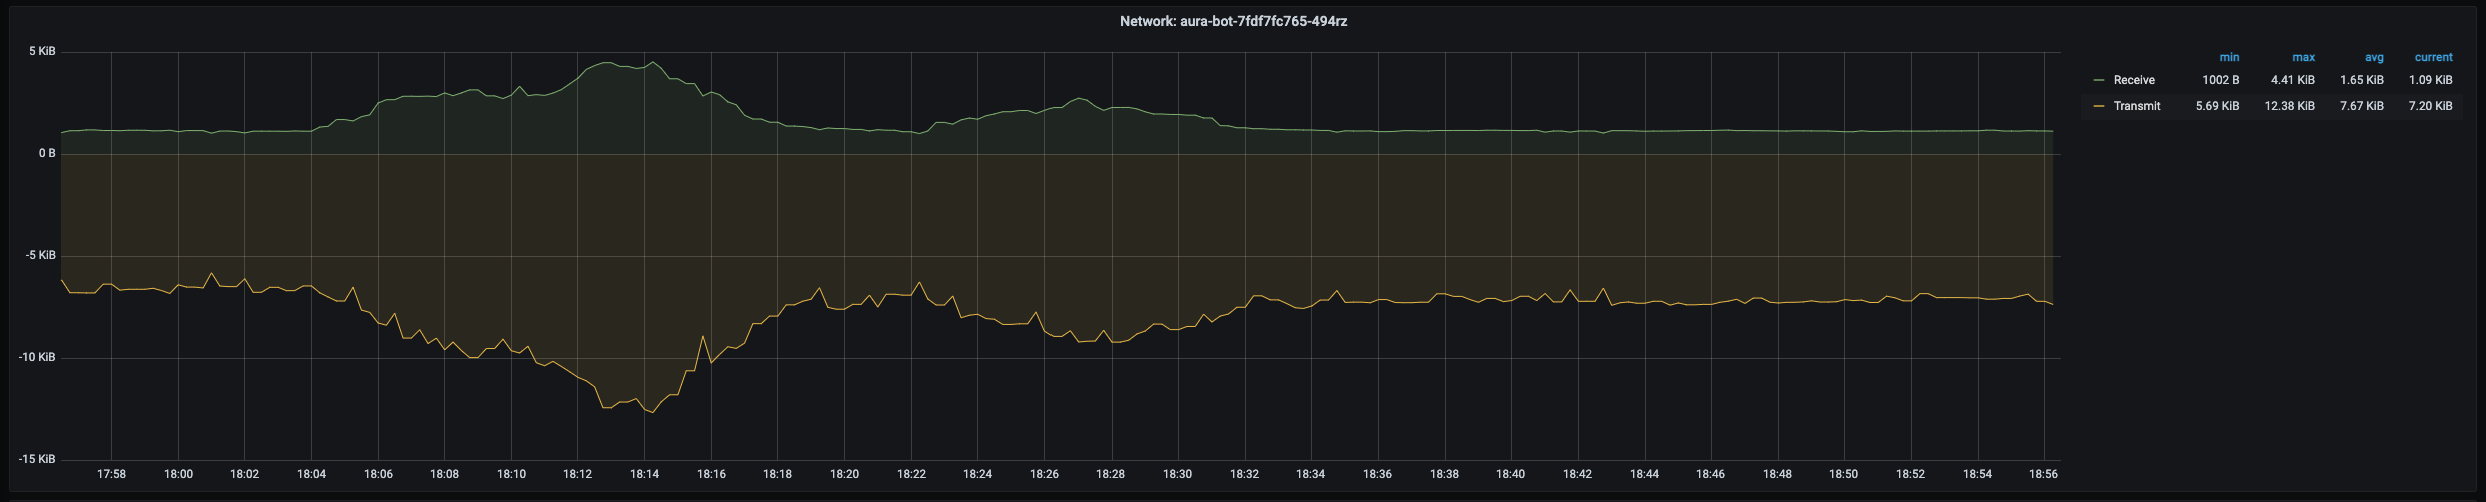
Pod CPU
Pod CPU panel shows a time series with the current CPU consumption of the selected pod. It also shows the current, maximum, minimum and average CPU consumption of the pod.
The x-axis shows the time series and the y-axis shows the percentage of CPU used by the pod.
The queries used to get the panel information are:
sum(kube_pod_container_resource_requests_cpu_cores{namespace="aura-<env>",pod="aura-bot-<id>"})
sum(kube_pod_container_resource_limits_cpu_cores{namespace="aura-<env>",pod="aura-bot-<id>"})
sum(rate(container_cpu_usage_seconds_total{namespace="aura-<env>",container!="POD",container!="",pod!="", pod="aura-bot-<id>"}[1m]))
An example of this panel is shown below:
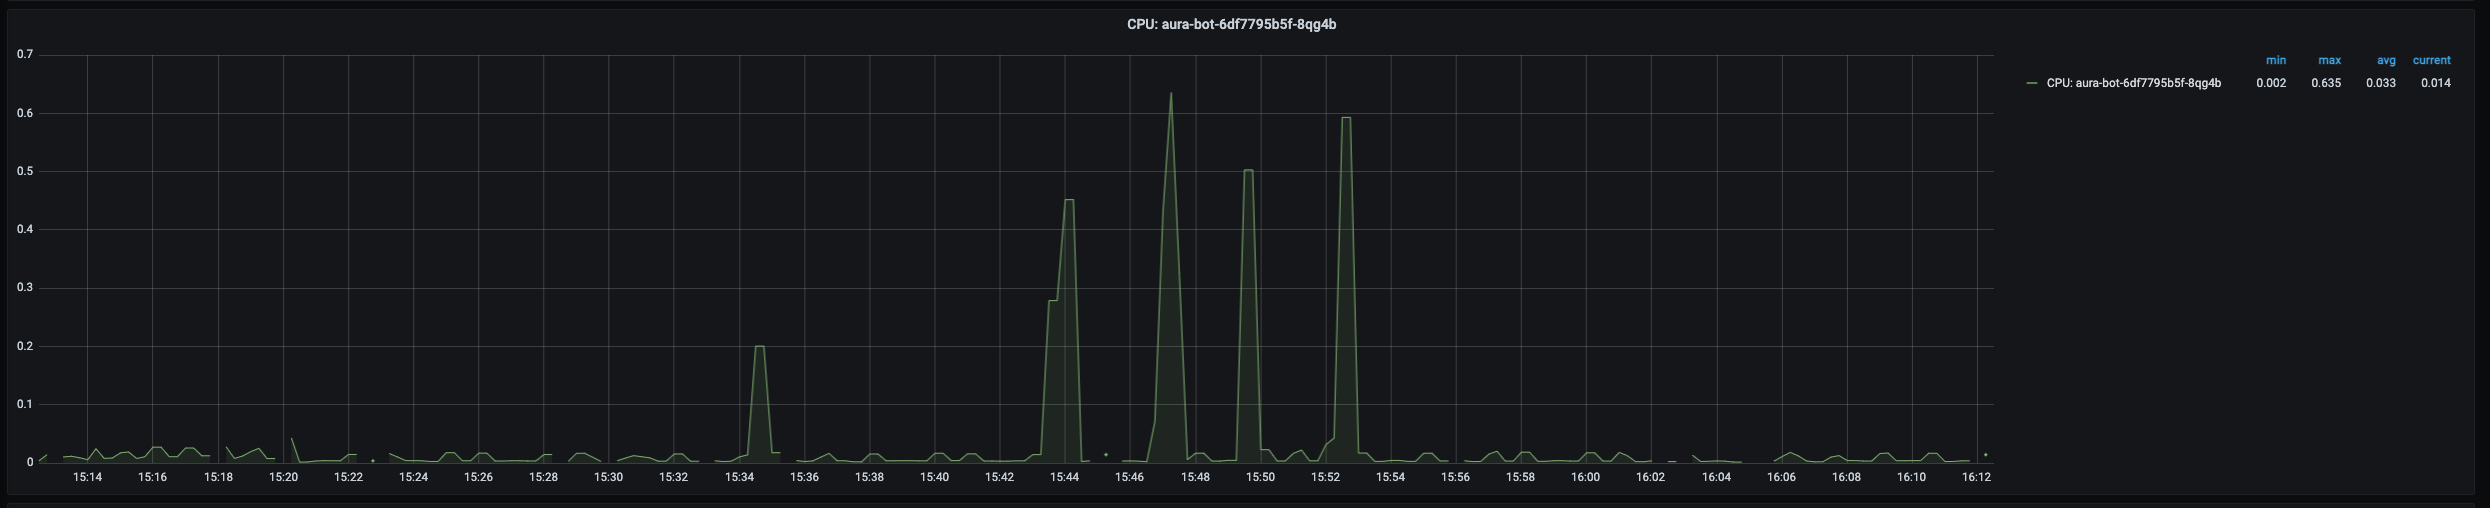
Container CPU
Container CPU panel shows a time series with the current CPU usage of the selected container within the pod. It also shows the current, maximum, minimum and average CPU usage of the container.
The x-axis shows the time series and the y-axis shows the percentage of CPU used by the container.
The queries used to get the panel information are:
sum(kube_pod_container_resource_requests_cpu_cores{namespace="aura-<env>",pod="aura-bot-<id>",container="aura-bot"})
sum(kube_pod_container_resource_limits_cpu_cores{namespace="aura-<env>",pod="aura-bot-<id>",container="aura-bot"})
sum(rate(container_cpu_usage_seconds_total{namespace="aura-<env>",container!="POD",container!="",pod!="", pod="aura-bot-<id>",container="aura-bot"}[1m]))
An example of this panel is shown below:
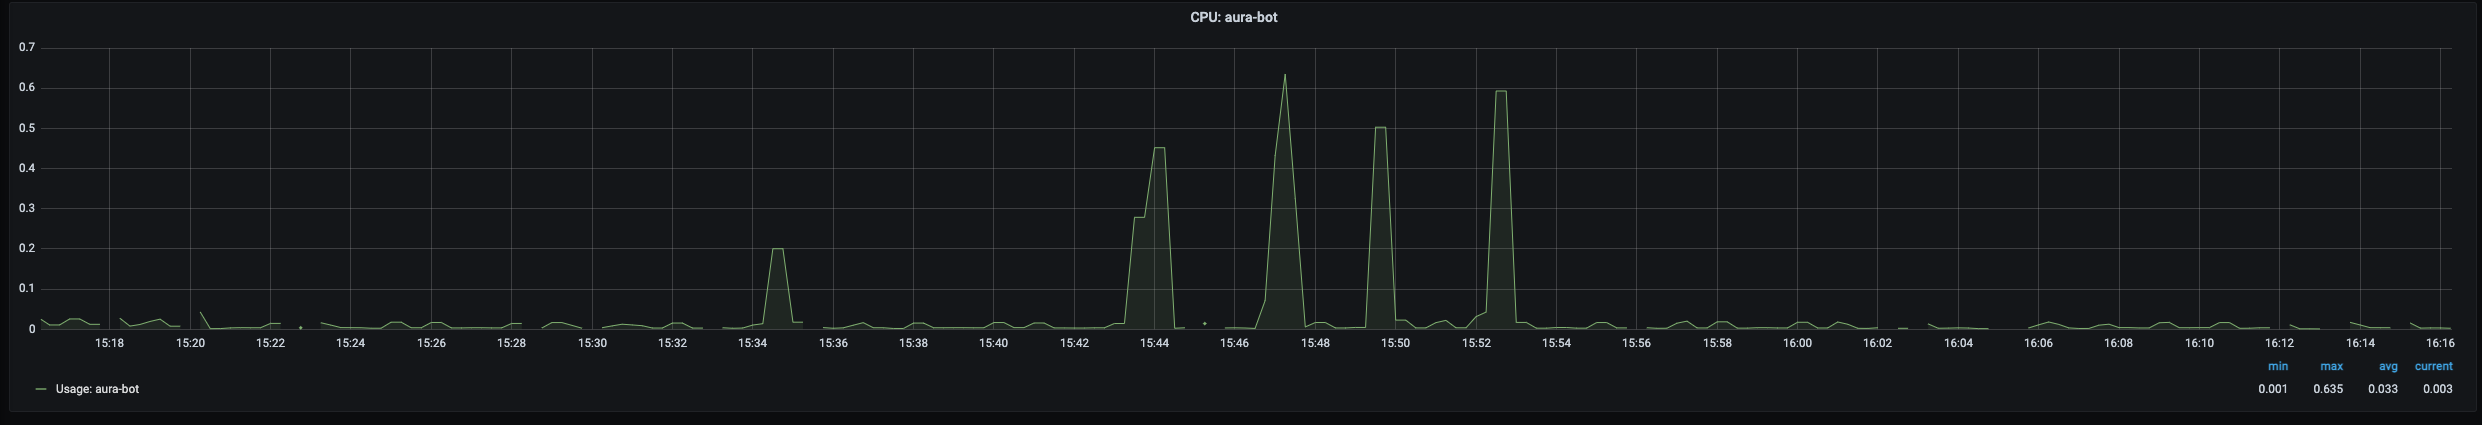
Container disk
Container Disk panel shows a time series with the current disk usage of the selected container within the pod. It also shows the current, maximum, minimum and average disk usage of the container.
The x-axis shows the time series and the y-axis shows the amount of disk used by the container.
The queries used to get the panel information are:
sum(rate(container_fs_reads_bytes_total{namespace="aura-<env>",pod="aura-bot-<id>",container="aura-bot"}[1m])) by (container,device)
sum(rate(container_fs_writes_bytes_total{namespace="aura-<env>",pod="aura-bot-<id>",container="aura-bot"}[1m])) by (container,device)
An example of this panel is shown below:
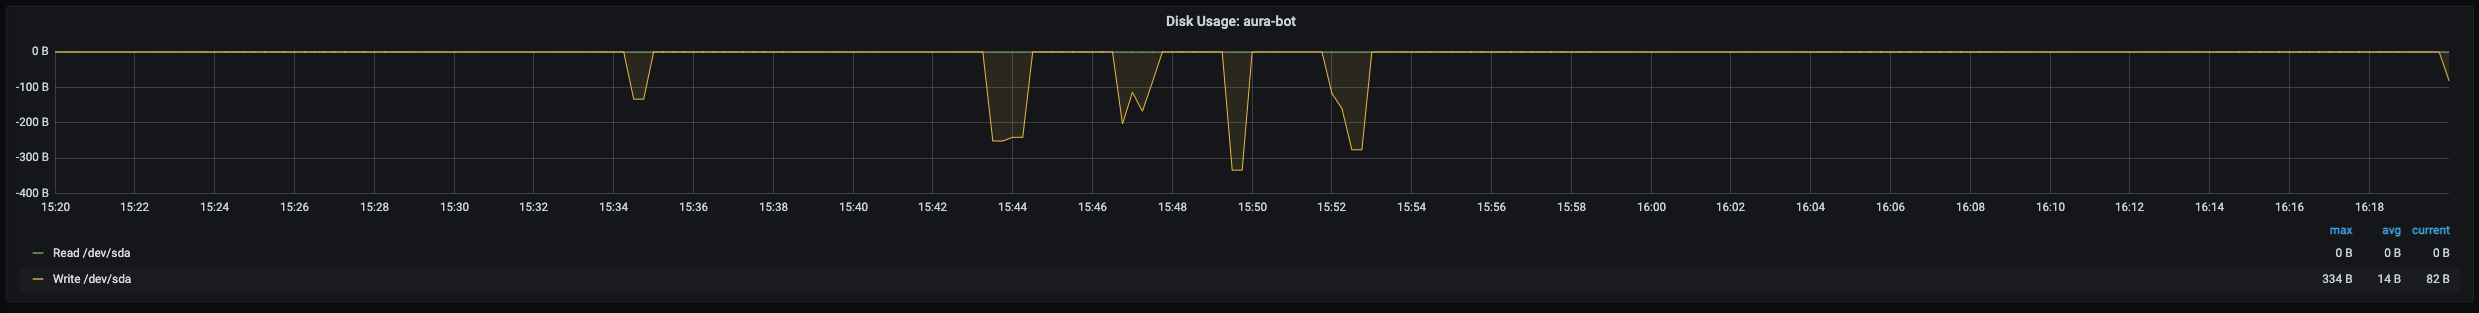
Pod network errors
Pods network errors panel shows a time series with the percentage of errors in network access of the pod. It also shows the current, maximum, minimum and average number of errors of the pod, related to errors while receiving and transmitting data to the network.
The x-axis shows the time series and the y-axis shows the percentage of errors of the pod network accesses.
The queries used to get the panel information are:
sum(rate(container_network_receive_packets_total{namespace="aura-<env>",pod="aura-bot-<id>"}[5m])) / sum(rate(container_network_receive_errors_total{namespace="aura-<env>",pod="aura-bot-<id>"}[5m])) * 100
sum(rate(container_network_receive_packets_total{namespace="aura-<env>",pod="aura-bot-<id>"}[5m])) / sum(rate(container_network_receive_packets_dropped_total{namespace="aura-<env>",pod="aura-bot-<id>"}[5m])) * 100
sum(rate(container_network_transmit_packets_total{namespace="aura-<env>",pod="aura-bot-<id>"}[5m])) / sum(rate(container_network_transmit_errors_total{namespace="aura-<env>",pod="aura-bot-<id>"}[5m])) * 100
sum(rate(container_network_transmit_packets_total{namespace="aura-<env>",pod="aura-bot-<id>"}[5m])) / sum(rate(container_network_receive_packets_dropped_total{namespace="aura-<env>",pod="aura-bot-<id>"}[5m])) * 100
Pod status
This section consists of 5 panels: ready, created, number of restarts, last terminated reason, waiting reason and the description of the image running in the container.
Ready
Ready panel shows a time series with heartbeat of the container. If there are no errors, it should be a flat line in 1.0.
The x-axis shows the time series and the y-axis shows the answer of the heartbeat of the container: 1 is a correct answer.
The queries used to get the panel information are:
kube_pod_container_status_ready{namespace="aura-<env>",pod="aura-bot-<id>",container="aura-bot"}
An example of this panel is shown below:
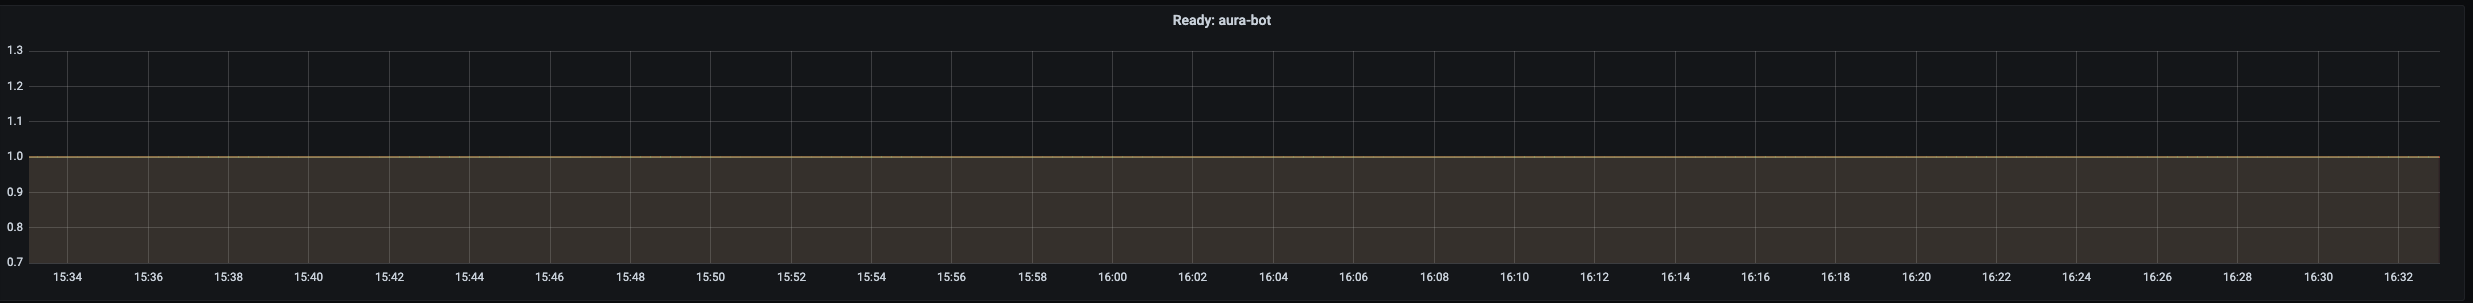
Pod created
Pod created panel shows the timestamp when the selected pod was created.
The queries used to get the panel information are:
kube_pod_created{namespace="aura-<env>",pod="aura-bot-<id>"} * 1000
An example of this panel is shown below:

Last terminated reason
This panel shows the reason why the pod entered the terminated status.
Last waiting reason
This panel shows the reason why the pod entered the waiting status.
Info
Info panel shows the images running in the containers of the selected pod.
The queries used to get the panel information are:
kube_pod_container_info{namespace="aura-<env>",pod="aura-bot-<id>"}
An example of this panel is shown below:

7 - Aura Alerts
Management of alerts in Aura
Learn how to manage alerts through Prometheus system
Introduction to alerts in Aura
As previously stated, Prometheus has a list of alert rules that are part of the platform configuration. These alerting rules allow you to define alert conditions based on Prometheus expression language.
⚠️ It is possible to edit the Aura alert rules but, for now, changes are lost in a re-deployment.
If you think an alert is important and should be part of the platform, let us know, so we can officially include it.
Alerts are sent via email, using a global SMTP server managed by the Aura Team. Other notification channels (Slack) are also available but not used by default in production.
Alerts are disabled (silenced) during Aura deployments to avoid false positives due to services that need to be restarted, etc.
In order to manage alerts, Aura Platform includes the AlertManager system, which is the part of Prometheus Stack.
The URL to access to alertmanager is:
alerts-{{ environment_name }}.auracognitive.com
When accessing the web, you can see all the alerts, as shown in the image below.

In this panel, the most important thing that you can do is “silence” one alarm pushing in the “silence alarm” or pressing the “new silence button”

In order to check if the cluster is ok (ready) or the status of the system, click in the “status” section.
Alerts set in Aura
The current section includes the different alerts currently set in Aura, organized by their scope.
Scope: infrastructure
-
high_cpu_usage_on_hosts
- Description: « $labels.kubernetes_io_hostname » is using a LOT of CPU. CPU usage is « humanize $value »%.
- Expr:
sum by(kubernetes_io_hostname) (rate(container_cpu_usage_seconds_total{id="/"}[5m])) / sum by(kubernetes_io_hostname) (machine_cpu_cores) * 100 > 90
- For: 10m
- summary: HIGH CPU USAGE WARNING ON ‘{{ $labels.kubernetes_io_hostname }}’
-
high_memory_usage_on_hosts
- Description: « $labels.kubernetes_io_hostname » is using a LOT of Memory. Memory usage is « humanize $value »%.
- Expr:
sum by(kubernetes_io_hostname) (container_memory_working_set_bytes{id="/"}) / sum by(kubernetes_io_hostname) (machine_memory_bytes) * 100 > 90
- For: 10m
- summary: HIGH MEMORY USAGE WARNING ON ‘{{ $labels.kubernetes_io_hostname }}’
-
high_fs_usage_on_hosts
- Description: « $labels.kubernetes_io_hostname » is using a LOT of FileSystem space. FileSystem usage is « humanize $value »%.
- Expr:
sum by(kubernetes_io_hostname) (container_fs_usage_bytes{device=~"^/dev/.*$",id="/"}) / sum by(kubernetes_io_hostname) (container_fs_limit_bytes{device=~"^/dev/.*$",id="/"}) * 100 > 70
- For: 10m
- summary: HIGH FILESYSTEM USAGE WARNING ON ‘{{ $labels.kubernetes_io_hostname }}’
Scope: kubernetes
-
high_persistent_volume_usage
- Description: « $labels.persistentvolumeclaim » on « $labels.kubernetes_io_hostname » is using a LOT of persistent volume space. Persistent volume usage is « humanize $value »%.
- Expr:
kubelet_volume_stats_used_bytes * 100 / kubelet_volume_stats_capacity_bytes > 70
- For: 10m
- summary: HIGH PERSISTENT VOLUME USAGE WARNING ON ‘{{ $labels.kubernetes_io_hostname }}’ by ‘{{ $labels.persistentvolumeclaim }}’
-
high_persistent_volume_inode_usage
- Description: « $labels.persistentvolumeclaim » on « $labels.kubernetes_io_hostname » is using a LOT of persistent volume inodes. Persistent volume inode usage is « humanize $value »%.
- Expr:
kubelet_volume_stats_inodes_used * 100 / kubelet_volume_stats_inodes > 70
- For: 10m
- summary: HIGH PERSISTENT VOLUME INODE USAGE WARNING ON ‘{{ $labels.kubernetes_io_hostname }}’ by ‘{{ $labels.persistentvolumeclaim }}’
-
docker_deleted_container_rate_on_hosts
- Description: « $labels.kubernetes_io_hostname » has a HIGH rate of deleted/stopped containers.
- Expr:
sum by(kubernetes_io_hostname) (rate(kubelet_docker_operations{operation_type=~"remove_container|stop_container"}[5m])) > 0.1
- For: 1m
- summary: DOCKER DELETED/STOPPED CONTAINER RATE WARNING
-
runtime_deleted_container_rate_on_hosts
- Description: « $labels.kubernetes_io_hostname » has a HIGH rate of deleted/stopped containers.
- Expr:
sum by(kubernetes_io_hostname) (rate(kubelet_runtime_operations{operation_type=~"stop_podsandbox|remove_container|stop_container"}[5m])) > 0.1
- For: 1m
- summary: RUNTIME DELETED/STOPPED CONTAINER RATE WARNING
-
frequent_container_restarts
- Description: Container « $labels.container » on pod « $labels.pod » has been restarted « $value » times within the last hour.
- Expr:
increase(kube_pod_container_status_restarts_total[1h]) > 5
- For: 5m
- summary: KUBERNETES FREQUENT CONTAINER RESTARTS WARNING
-
node_not_ready
- Description: Node « $labels.node » has status « $labels.condition » as « $labels.status ».
- Expr:
kube_node_status_condition{condition!="Ready",status!="false"} > 0 or on(node) kube_node_status_condition{condition="Ready",status="false"} > 0
- For: 5m
- summary: KUBERNETES NODE NOT READY WARNING
-
job_error
- Description: JOB ERROR
- Expr:
kube_job_status_failed==1
- For: 5m
- summary: KUBERNETES JOB NOT READY WARNING
Scope: prometheus
-
prometheus_rule_evaluation_slow
- Description: Prometheus has a 90th percentile latency of « $value »s completing rule evaluation cycles.
- Expr:
prometheus_evaluator_duration_seconds{quantile="0.9"} > 60
- For: 10m
- summary: PROMETHEUS RULE EVALUATION SLOW WARNING
-
prometheus_indexing_backlog
- Description: Prometheus is backlogging on the indexing queue. Queue is currently « $value | printf
%.0f »% full.
- Expr:
prometheus_local_storage_indexing_queue_length / prometheus_local_storage_indexing_queue_capacity * 100 > 10
- For: 10m
- summary: PROMETHEUS INDEXING BACKLOG WARNING
-
prometheus_not_ingesting_samples
- Description: Prometheus has not ingested any sample in the last 10 minutes.
- Expr:
rate(prometheus_local_storage_ingested_samples_total[5m]) == 0
- For: 5m
- summary: PROMETHEUS NOT INGESTING SAMPLES WARNING
-
prometheus_persist_errors
- Description: Prometheus has encountered « $value » persistent errors per second in the last 10 minutes.
- Expr:
rate(prometheus_local_storage_persist_errors_total[10m]) > 0
- For: 5m
- summary: PROMETHEUS PERSIST ERRORS WARNING
-
prometheus_notifications_backlog
- Description: Prometheus is backlogging on the notifications queue. The queue has not been empty for 10 minutes. Current queue length: « $value ».
- Expr:
prometheus_notifications_queue_length > 0
- For: 10m
- summary: PROMETHEUS NOTIFICATIONS BACKLOG WARNING
-
prometheus_storage_inconsistent
- Description: Prometheus has detected a storage inconsistency. A server restart is needed to initiate recovery.
- Expr:
prometheus_local_storage_inconsistencies_total > 0
- For: 5m
- summary: PROMETHEUS STORAGE INCONSISTENCY WARNING
-
prometheus_persistence_pressure_too_high_24h
- Description: Prometheus is approaching critical persistence pressure. Throttled ingestion expected within the next 24h.
- Expr:
prometheus_local_storage_persistence_urgency_score > 0.8 and predict_linear(prometheus_local_storage_persistence_urgency_score[30m], 3600 * 24) > 1
- For: 30m
- summary: PROMETHEUS PERSISTENCE PRESSURE 24H WARNING
-
prometheus_persistence_pressure_too_high_2h
- Description: Prometheus is approaching critical persistence pressure. Throttled ingestion expected within the next 2h.
- Expr:
prometheus_local_storage_persistence_urgency_score > 0.85 and predict_linear(prometheus_local_storage_persistence_urgency_score[30m], 3600 * 2) > 1
- For: 30m
- summary: PROMETHEUS PERSISTENCE PRESSURE 24H WARNING
-
prometheus_series_maintenance_stalled
- Description: Prometheus is maintaining memory time series so slowly that it will take « $value | printf
%.0f »h to complete a full cycle. This will lead to persistence falling behind.
- Expr:
prometheus_local_storage_memory_series / on(job, instance) rate(prometheus_local_storage_series_ops_total{type="maintenance_in_memory"}[5m]) / 3600 > 24 and prometheus_local_storage_rushed_mode == 1
- For: 1h
- summary: PROMETHEUS SERIES MAINTENANCE WARNING
-
prometheus_target_scrape_sync_too_low
- Description: Prometheus target scrape sync rate is too low.
- Expr:
rate(prometheus_target_scrape_pool_sync_total{app="prometheus"}[10m]) == 0
- For: 5m
- summary: PROMETHEUS TARGET SCRAPE SYNC WARNING
Scope: logs
-
elasticsearch_too_few_nodes_running
- Description: There are only « $value » < 3 ElasticSearch nodes running.
- Expr:
elasticsearch_cluster_health_number_of_node < 3
- For: 10m
- summary: TOO FEW ELASTICSEARCH NODES
-
elasticsearch_high_memory_usage
- Description: The memory (heap) usage is over 90% for 15m on node « $labels.node »
- Expr:
elasticsearch_jvm_memory_used_bytes{area="heap"} / elasticsearch_jvm_memory_max_bytes{area="heap"} > 0.9
- For: 15m
- summary: ELASTICSEARCH HIGH MEMORY USAGE
-
elasticsearch_not_indexing
- Description: ElasticSearch data node is not indexing new documents
- Expr:
increase(elasticsearch_indices_docs{es_data_node="true"}[1m]) == 0
- For: 5m
- summary: ELASTICSEARCH NOT INDEXING
Scope: Aura
-
aura-bot_unauthorized_aura-bridge
- Description: aura-bridge has not authorized the connection with aura-bot for 3 minutes.
- Expr:
sum by (status_code) (rate(http_request_duration_seconds_count{app="aura-bridge",status_code=~"401"}[3m])) > 0
- For: 3m
- summary: AURA-BOT RETURN UNAUTHORIZED TO AURA-BRIDGE
-
aura-bot_bad-request_aura-bridge
- Description: aura-bridge has not been able to correctly handle the connection with aura-bot for 3 minutes.
- Expr:
sum by (status_code) (rate(http_request_duration_seconds_count{app="aura-bridge",status_code=~"400"}[3m])) > 0
- For: 3m
- summary: AURA-BOT RETURN BAD REQUEST TO AURA-BRIDGE
-
aura-bot_internal-error_aura-bridge
- Description: aura-bridge failed to connect to aura-bot for 3 minutes.
- Expr:
sum by (host,status) (rate(outgoing_request_duration_seconds_count{app="aura-bridge",status=~"5..",host=~"aura-bot.*"}[3m])) > 0
- For: 3m
- summary: COMMUNICATION ERROR BETWEEN AURA-BOT AND AURA-BRIDGE
-
aura-bridge-error_callback
- Description: aura-bridge failed to handle the connection with callback for 3 minutes.
- Expr:
sum by (host,status) (rate(outgoing_request_duration_seconds_count{app="aura-bridge",status=~"5..",host!~"aura-bot.*"}[3m])) > 0
- For: 3m
- summary: COMMUNICATION ERROR BETWEEN AURA-BRIDGE AND CALLBACK
-
aura-bridge_error_whatsapp
- Description: errors in aura-bridge with WhatsApp functionality for 5 minutes.
- Expr:
sum by (origin,originStatus)(rate(outgoing_message_duration_seconds_count{app="aura-bridge",origin=~"aura-bot|whatsapp|4p",originStatus!="200",httpStatus!~"403|408|400"}[5m])) > 0
- For: 5m
- summary: Error happened in WhatsApp functionality.
-
aura-bridge_error_4p
- Description: errors in aura-bridge with Kernel in WhatsApp functionality for 5 minutes.
- Expr:
sum by (origin,originStatus)(rate(outgoing_message_duration_seconds_count{app="aura-bridge",origin=~"4p",httpStatus=~"403|408|400"}[5m])) > 0
- For: 5m
- summary: Error happened with Kernel in WhatsApp functionality.
-
nlp-provisioning_killed-processes
- Description: killed nlp-provisioning processes for 15 minutes.
- Expr:
sum by (exported_job) (rate(nlp_provisioning_killed_processes{exported_job="nlp_provisioning_job"}[15m])) > 0
- For: 15m
- summary: Processes killed in nlp-provisioning
-
alive-processes_nlp-provisioning_expected-alive-processes
- Description: alive nlp-provisioning processes vs expected alive nlp-provisioning processes for 15 minutes.
- Expr:
sum by (exported_job)(nlp_provisioning_alive_processes{exported_job="nlp_provisioning_job"}) / sum by (exported_job) (nlp_provisioning_expected_alive_processes{exported_job="nlp_provisioning_job"})!=1
- For: 15m
- summary: Processes killed in nlp-provisioning
Scope: misc
-
probe_down
- Description: The endpoint « $labels.instance » is down or not reachable. The blackbox exporter could not validate « $labels.app »’s health.
- Expr:
probe_success == 0
- For: 2m
- summary: PROBE FAILING
8 - Queries
Queries
Description of the different types of queries that can be done in order to retrieve metrics from the system
With the goal of retrieving from Aura specific information regarding the generated logs and metrics, we can make queries to the system.
These queries are classified into two categories:
8.1 - Basic monitoring queries
Basic monitoring queries
Learn how to get information for the evaluation of Aura system performance through basic queries
Introduction
The current document shows the guidelines for making queries to Grafana and Kibana in order to retrieve basic information from the system.
Number of TPS per component
Request rate in Grafana
- Access Grafana of the environment.
- Select “Aura HTTP inbounds” dashboard.
- Select the time period for the query.
- Select the service of your choice, as can be seen in the following picture:
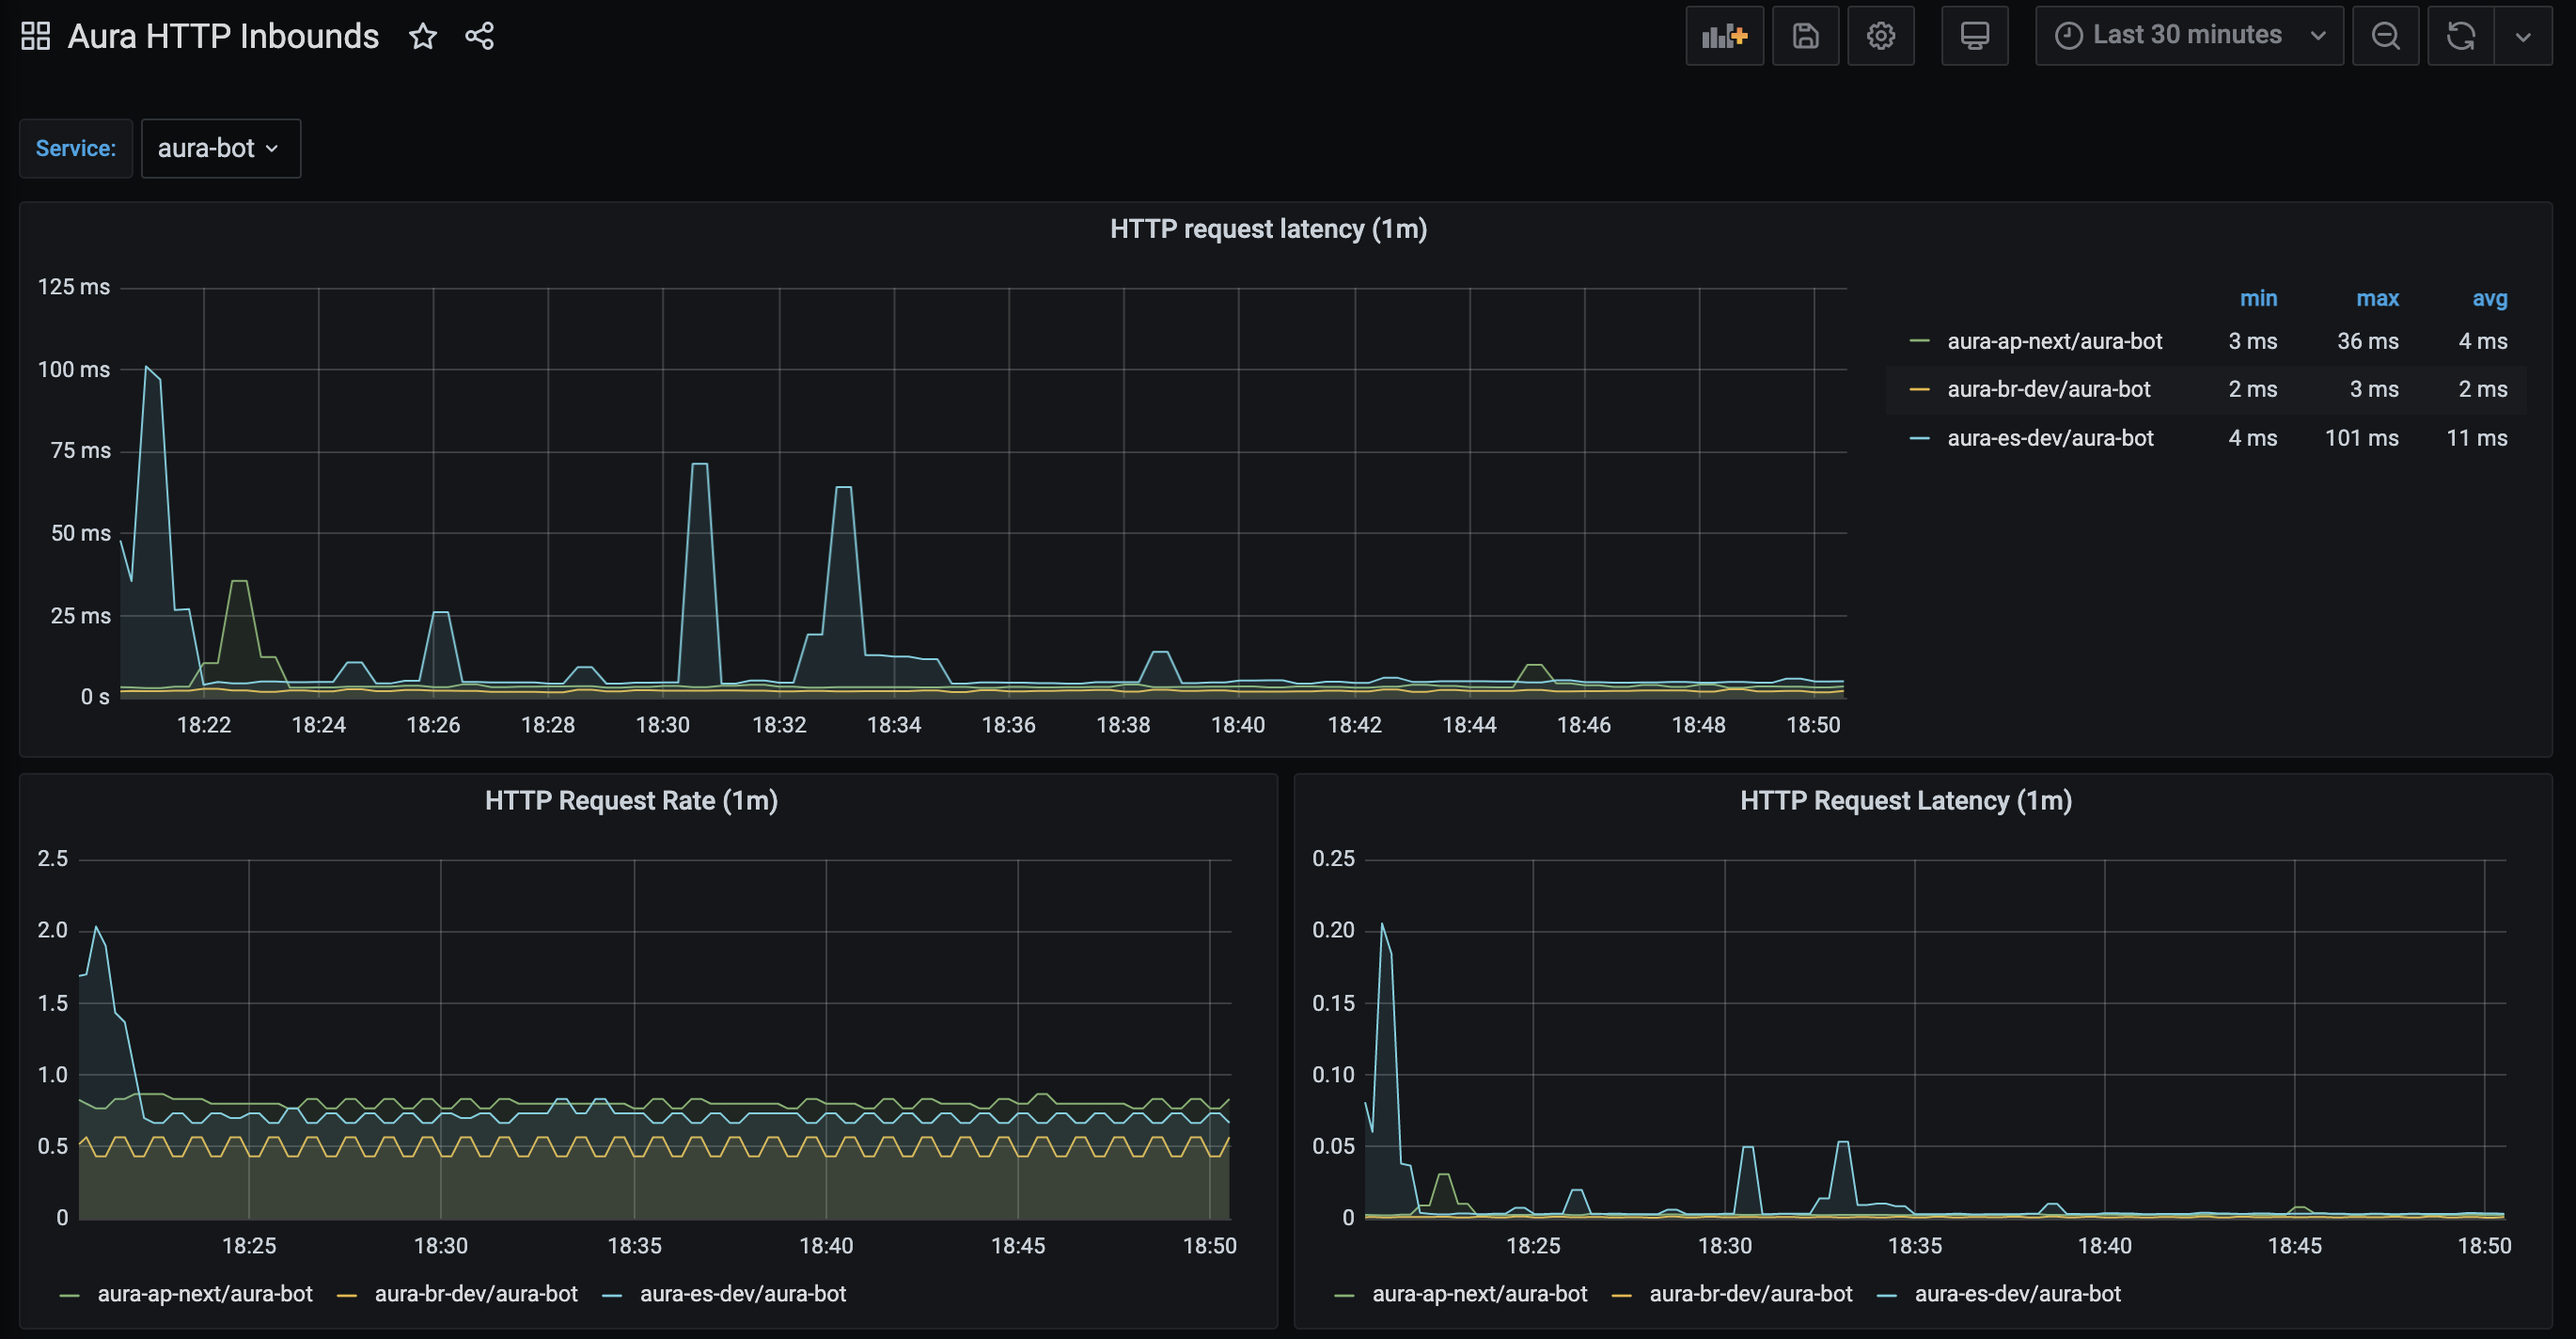
The panel named “HTTP Request Rate” shows the total number of requests being processed by a service.
This panel is based on the Prometheus aura-bot stored metric called http_request_duration_seconds aggregated in buckets of one minute.
It shows in the y-axis the number of requests in the service and in the x-axis the time period.
Request rate in Kibana
Add a new dashboard with the following data:
Update the dashboard and name it, in order to have it available.
A basic example of this dashboard with a panel per component is delivered with Aura, so it can be imported in the Kibana of the environment using Kibana import objects API.
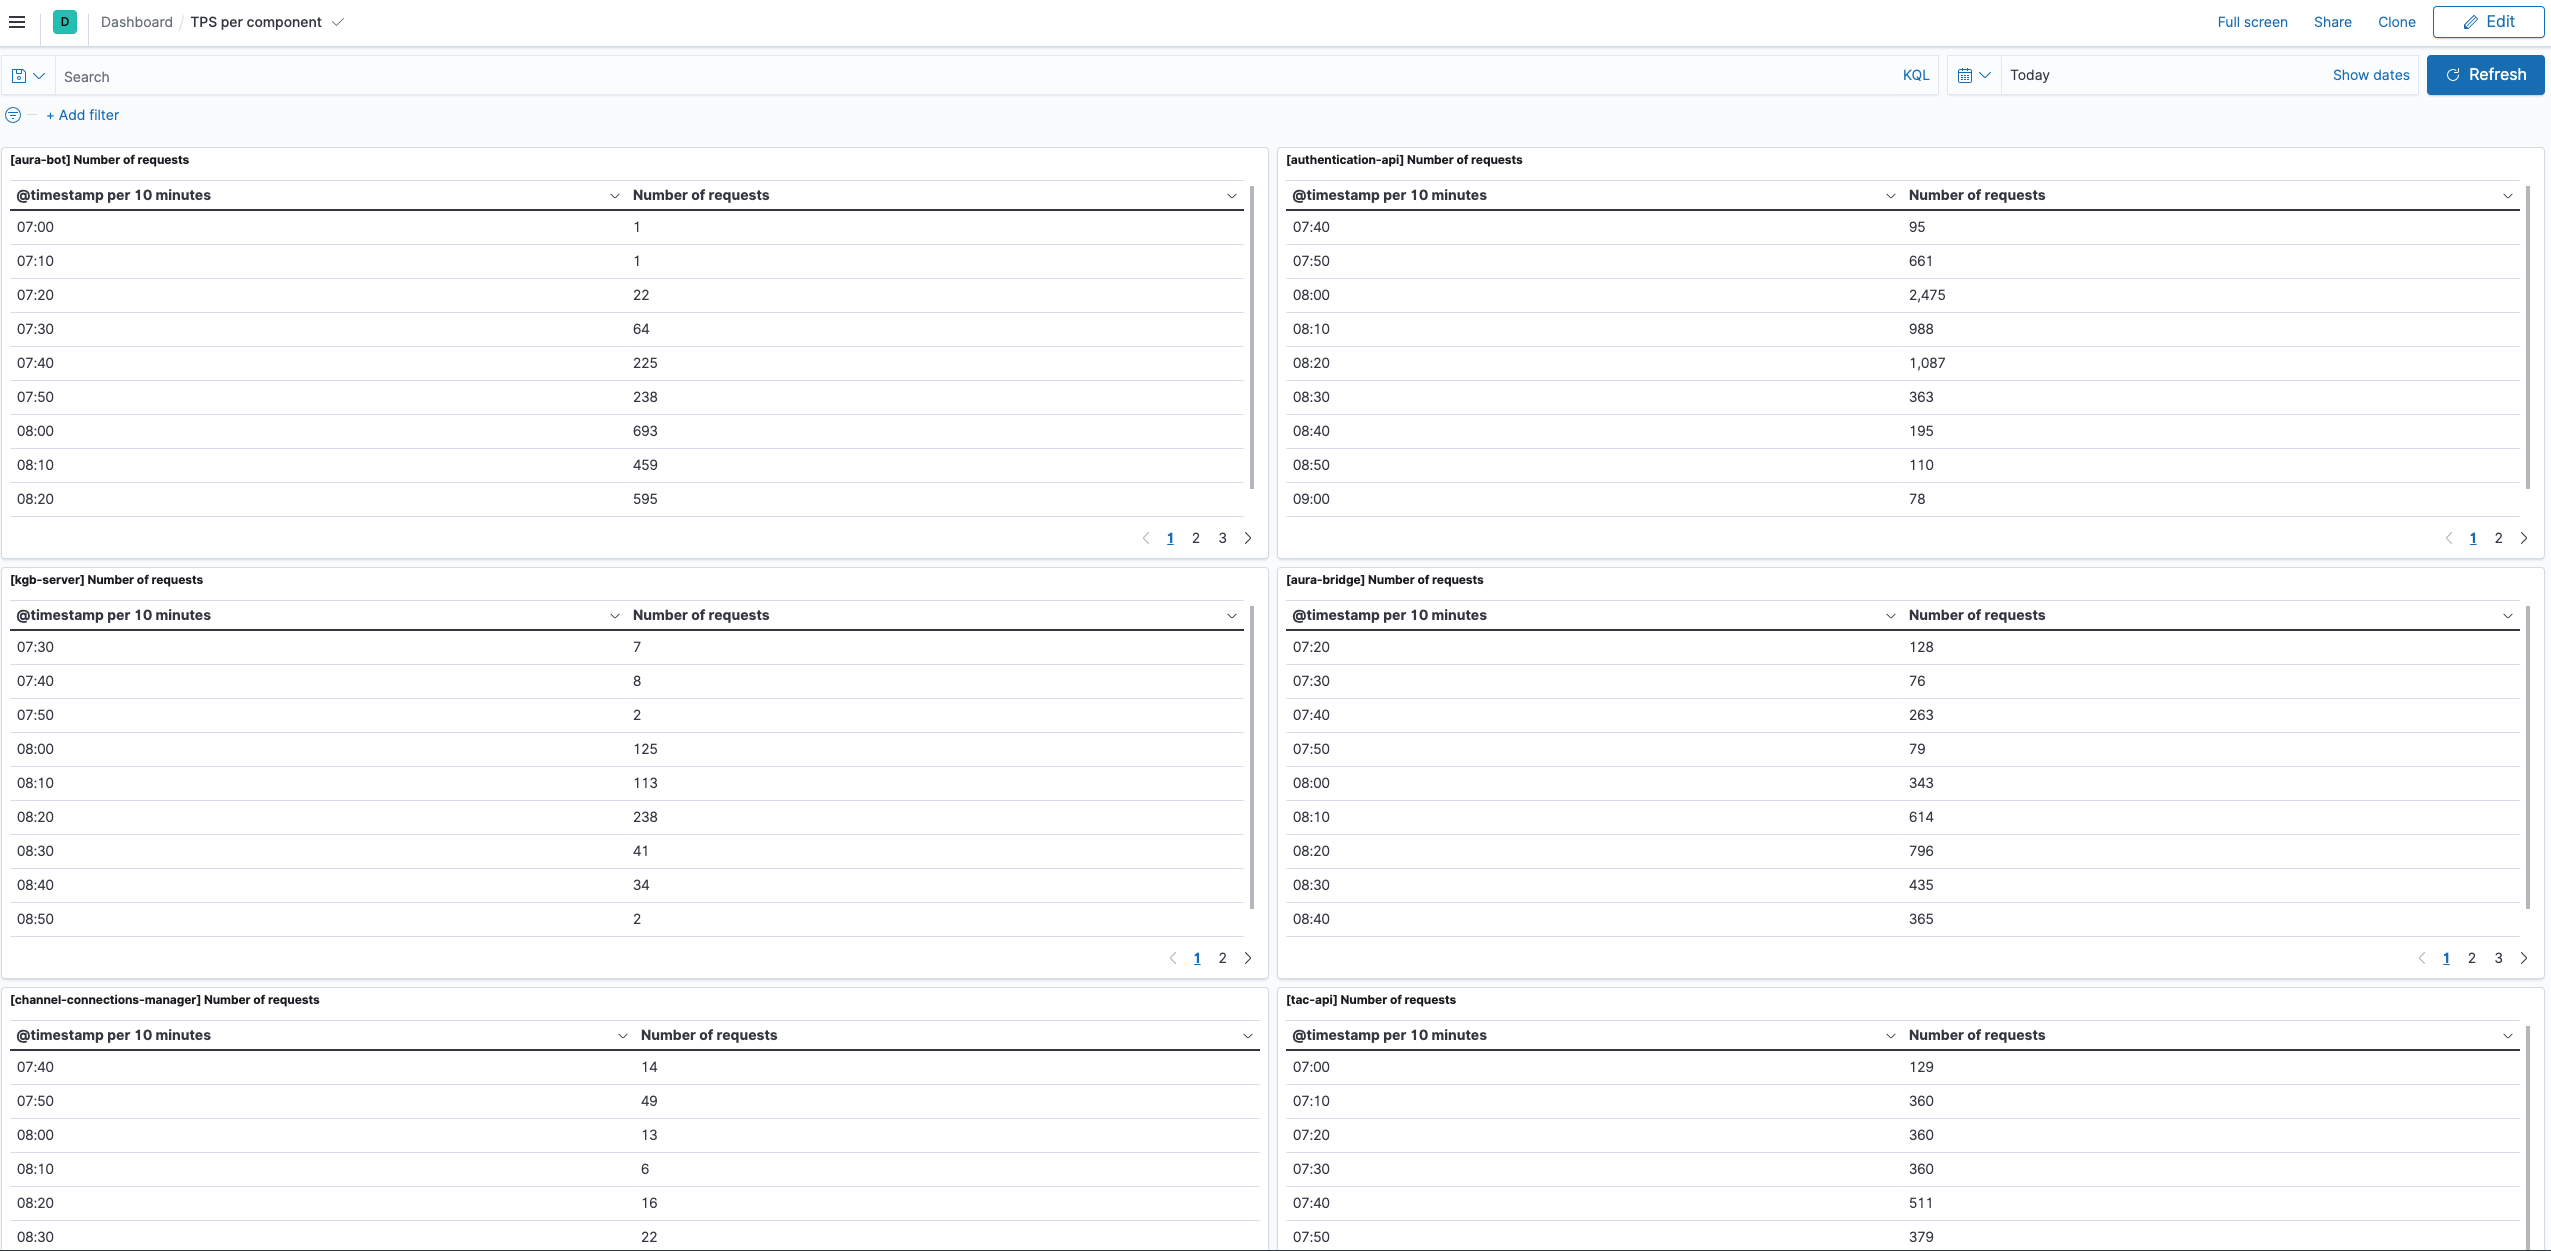
Number of unique users in Aura
In this case, the only way of getting the number of unique users accessing to Aura is querying the operational logs, in Kibana.
Add a new dashboard in Kibana with the following data:
- Select the time interval for the filter
- Query (overwrite your-env with the environment of your choice):
app.keyword : "aura-bot" and kubernetes.namespace_name.keyword : "your-env"
- Index: aurak8s-service
- Data:
- Metric: Unique Count
- Field: auraId.keyword
- Custom label: Number of unique aura users
- Buckets: split rows
- Aggregation: Date histogram
- Field: @timestamp
- Minimum interval: 1h
Update the dashboard and name it, to have it available.
A basic example of this dashboard with a panel per component is delivered with Aura, so it can be imported in the Kibana of the environment using kibana import objects API.
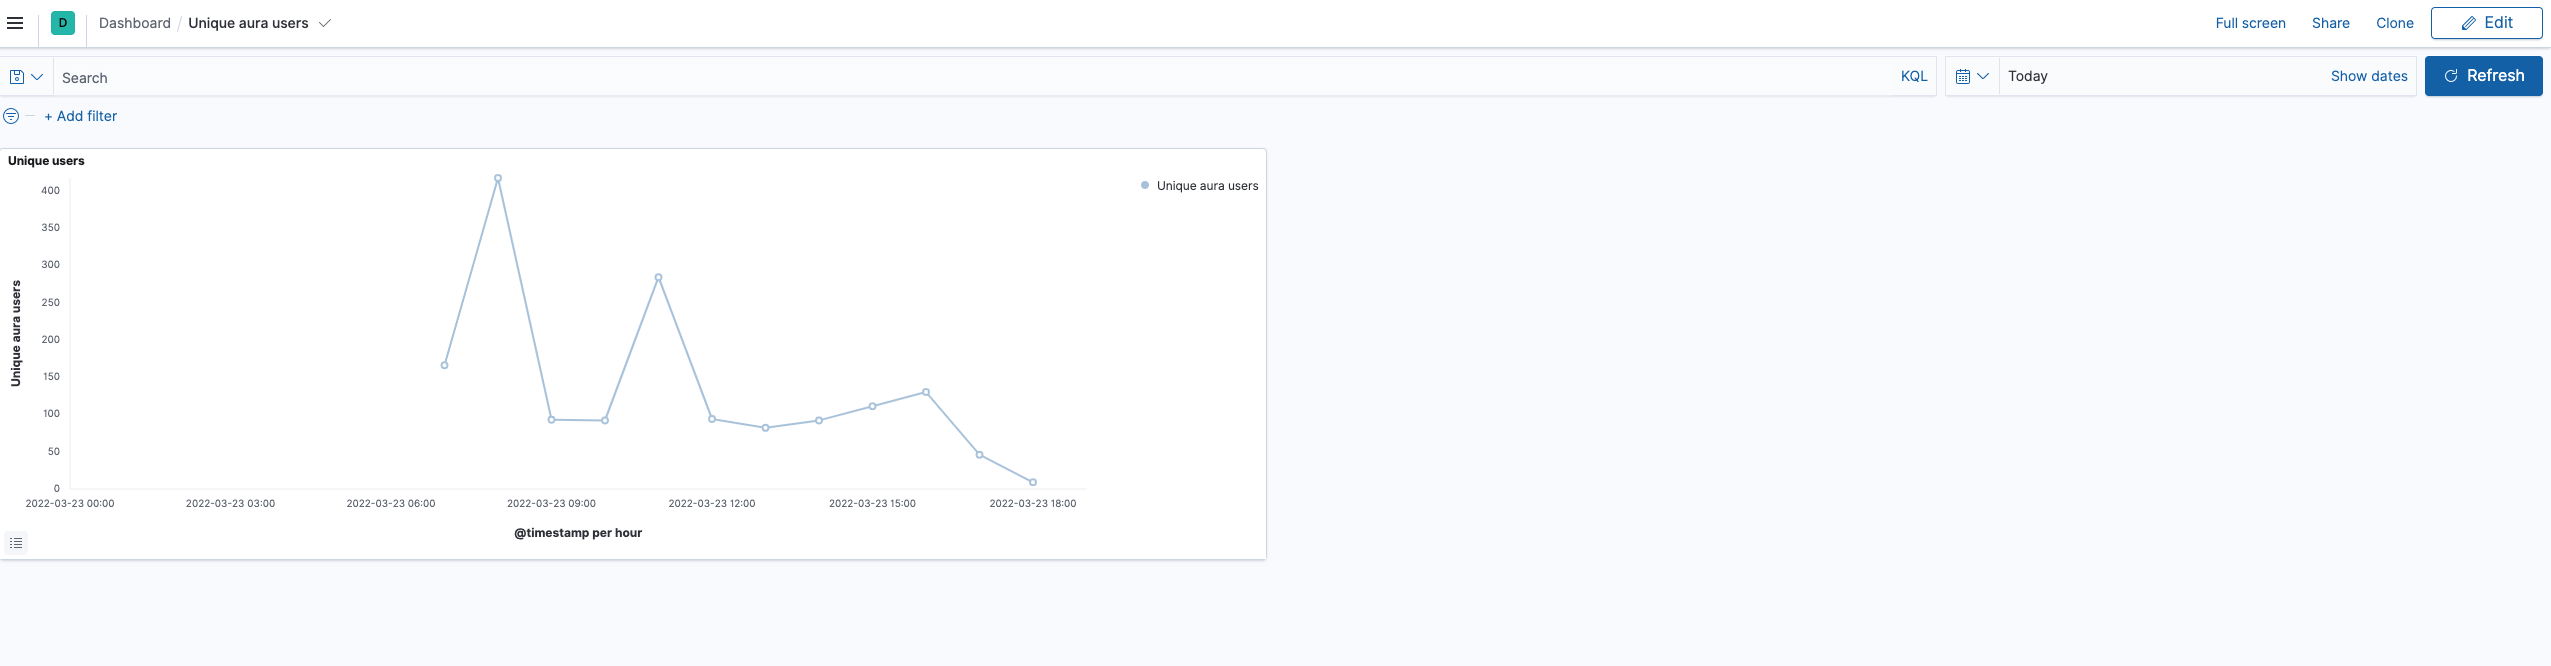
8.2 - Basic database queries
Basic database queries
Learn how to get information from the database to get some insights
Requirements
-
A valid kubeconfig for the environment
-
If the environment database is in Atlas: access to Atlas by IP
-
Get the variables to access the database:
# substitute {{aura-environment}} with the environment you're configuring
export AURA_ENVIRONMENT={{aura-environment}}

$ kubectl -n $AURA_ENVIRONMENT get cm authentication-api -o json | jq -r ".data.AURA_MONGODB_URI"

{{mongo_uri}}

$ kubectl -n $AURA_ENVIRONMENT get cm authentication-api -o json | jq -r ".data.AURA_MONGODB_USERNAME"

{{mongo_user}}

$ kubectl -n $AURA_ENVIRONMENT get secret authentication-api -o json | jq -r ".data.AURA_MONGODB_PASSWORD|@base64d"

{{mongo_pass}}

$ kubectl -n $AURA_ENVIRONMENT get cm authentication-api -o json | jq -r ".data.AURA_MONGODB_USER_DB"

{{mongo_users_db}}

$ kubectl -n $AURA_ENVIRONMENT get cm authentication-api -o json | jq -r ".data.AURA_MONGODB_USER_COLLECTION"

{{mongo_users_col}}
-
Get the channel_name and channel_id for the all channels in the environment:
# substitue {{aura-environment}} with the environment you're configuring
export AURA_ENVIRONMENT={{aura-environment}}

$ kubectl -n $AURA_ENVIRONMENT get cm aura-bot -o json | jq -r ".data.AURA_CHANNELS_CONFIGURATION_API_ENDPOINT"

{{channels_configuration_endpoint}}

$ kubectl -n $AURA_ENVIRONMENT get secret aura-bot -o json | jq -r ".data.AURA_AUTHORIZATION_HEADER|@base64d"

{{authorization_header}}

$ curl {{channels_configuration_endpoint}}/aura-services/v2/configuration/channels -H "Authorization: {{authorization_header}}" -o channels_config.json

$ cat channels_config.json| jq -r '.[] | .name + ":" +.id'
{{ channels }}

# Example of channels
# novum-mytelco:45494a5b-835a-4fff-a813-b3d2be529dbe
# whatsapp:f7fd1021-41cd-588a-a461-387cc24be223
# whatsapp-1004:e75e7b9d-7949-451a-9493-3d759745492c
# movistar-plus:60f0ffda-e58a-4a96-aad9-d42be70b7b42
# set-top-box:814bc401-7743-47d3-957b-7f1b2dafe398
# set-top-box-haac:dc388448-b1d1-11e9-b77b-67224ed60908
Queries
Total number of users registered in Aura
⚠️ This information is only for authenticated users. Currently, anonymous users are not stored in the Aura users’ database.
$ mongo -u {{mongo_user}} -p {{mongo_pass}} {{mongo_uri}}
> use {{mongo_users_db}}
> db.{{mongo_users_col}}.find({}).count()
10167
Total number of users registered in aura per channel
⚠️ This information is only for authenticated users. Currently, anonymous users are not stored in the Aura users’ database.
Use the output of {{ channels }} to identify the channel by its name rather than by its identifier.
$ mongo -u {{mongo_user}} -p {{mongo_pass}} {{mongo_uri}}
> use {{mongo_users_db}}
> db.{{mongo_users_col}}.aggregate([
    {"$group" : {_id: "$channelId", count: {$sum:1}}}
])
{ "_id" : "981e5db7-8031-4370-a326-b6f4d163cd82", "count" : 1 }
{ "_id" : "814bc401-7743-47d3-957b-7f1b2dafe398", "count" : 21 }
{ "_id" : "189d4016-bcd0-491d-a75e-64e7a54aa75c", "count" : 1 }
{ "_id" : "b2501583-6d76-4e77-b364-aa169490efec", "count" : 1 }
{ "_id" : "b94aec9a-da4d-46de-afc3-06cfe0157888", "count" : 1 }
{ "_id" : "60f0ffda-e58a-4a96-aad9-d42be70b7b42", "count" : 22 }
{ "_id" : "e75e7b9d-7949-451a-9493-3d759745492c", "count" : 2518 }
{ "_id" : "9924335b-321a-4f48-b820-e35c7eb9e58b", "count" : 1 }
{ "_id" : "dc388448-b1d1-11e9-b77b-67224ed60908", "count" : 69 }
{ "_id" : "f7fd1021-41cd-588a-a461-387cc24be223", "count" : 2062 }
{ "_id" : "e59aa30f-bae5-4c9e-9d1a-0be8b904711d", "count" : 1 }
{ "_id" : "45494a5b-835a-4fff-a813-b3d2be529dbe", "count" : 346 }
{ "_id" : "5ad28380-85fa-4ba2-bcdb-0732127f4a85", "count" : 4792 }
{ "_id" : "ecd189c2-b1dd-4142-bbe1-eb9549b327e2", "count" : 1 }
{ "_id" : "25695326-c67c-40fe-b5df-a8fd5b4deb22", "count" : 14 }
{ "_id" : "4c14973e-3369-4c6a-b59d-e3e0ecaed78c", "count" : 291 }
Total number of users with expired authorization_id
An authorization_id is expired if it has not been used for 180 days in a row.
$ mongo -u {{mongo_user}} -p {{mongo_pass}} {{mongo_uri}}
> use {{mongo_users_db}}
> db.{{mongo_users_col}}.find({lastAccess: {
        $lt: new Date(ISODate().getTime() - 180*24*60*60*1000)
    }
}).count()
3034